| Multiple Linear Regression - Estimated Regression Equation |
| BEL_20[t] = -4162.90150693943 + 0.0638179802619133Nikkei[t] + 0.402353700913268DJ_Indust[t] + 0.0963455379503522Goudprijs[t] -14.9608458786253Conjunct_Seizoenzuiver[t] -4.07998337596778Cons_vertrouw[t] + 253.964447027001Alg_consumptie_index_BE[t] + 183.299513518561Gem_rente_kasbon_1j[t] + 24.9144552917607M1[t] + 12.0310172490279M2[t] -31.6485543535592M3[t] -80.3430192654199M4[t] -47.2277227733143M5[t] -4.40120853957415M6[t] + 22.0742445366294M7[t] + 66.1102220435124M8[t] -38.1169925279443M9[t] -97.3200633225077M10[t] -33.8625976909345M11[t] + e[t] |
| Multiple Linear Regression - Ordinary Least Squares | |||||
| Variable | Parameter | S.D. | T-STAT H0: parameter = 0 | 2-tail p-value | 1-tail p-value |
| (Intercept) | -4162.90150693943 | 781.614662 | -5.326 | 8e-06 | 4e-06 |
| Nikkei | 0.0638179802619133 | 0.066388 | 0.9613 | 0.343618 | 0.171809 |
| DJ_Indust | 0.402353700913268 | 0.087547 | 4.5959 | 6.4e-05 | 3.2e-05 |
| Goudprijs | 0.0963455379503522 | 0.07518 | 1.2815 | 0.209215 | 0.104607 |
| Conjunct_Seizoenzuiver | -14.9608458786253 | 9.679435 | -1.5456 | 0.132027 | 0.066013 |
| Cons_vertrouw | -4.07998337596778 | 10.704407 | -0.3811 | 0.705611 | 0.352805 |
| Alg_consumptie_index_BE | 253.964447027001 | 60.738645 | 4.1813 | 0.00021 | 0.000105 |
| Gem_rente_kasbon_1j | 183.299513518561 | 141.873731 | 1.292 | 0.205614 | 0.102807 |
| M1 | 24.9144552917607 | 131.566276 | 0.1894 | 0.851 | 0.4255 |
| M2 | 12.0310172490279 | 127.484319 | 0.0944 | 0.925402 | 0.462701 |
| M3 | -31.6485543535592 | 131.943702 | -0.2399 | 0.811966 | 0.405983 |
| M4 | -80.3430192654199 | 134.506658 | -0.5973 | 0.5545 | 0.27725 |
| M5 | -47.2277227733143 | 139.800103 | -0.3378 | 0.737703 | 0.368851 |
| M6 | -4.40120853957415 | 135.633715 | -0.0324 | 0.974315 | 0.487158 |
| M7 | 22.0742445366294 | 136.724604 | 0.1615 | 0.872754 | 0.436377 |
| M8 | 66.1102220435124 | 144.043374 | 0.459 | 0.649365 | 0.324682 |
| M9 | -38.1169925279443 | 137.20537 | -0.2778 | 0.782945 | 0.391473 |
| M10 | -97.3200633225077 | 139.431396 | -0.698 | 0.490232 | 0.245116 |
| M11 | -33.8625976909345 | 131.573216 | -0.2574 | 0.798543 | 0.399272 |
| Multiple Linear Regression - Regression Statistics | |
| Multiple R | 0.984771263508163 |
| R-squared | 0.969774441431463 |
| Adjusted R-squared | 0.95277256473666 |
| F-TEST (value) | 57.0392585971375 |
| F-TEST (DF numerator) | 18 |
| F-TEST (DF denominator) | 32 |
| p-value | 0 |
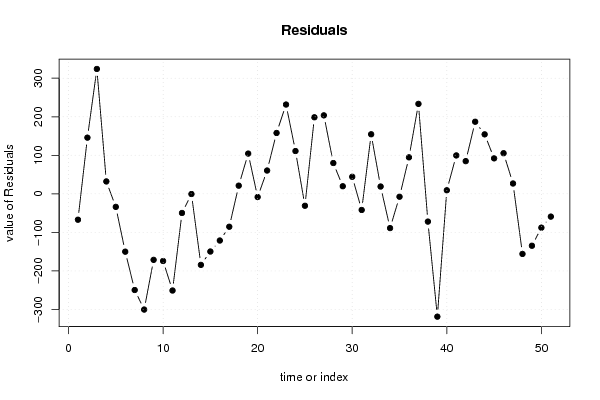
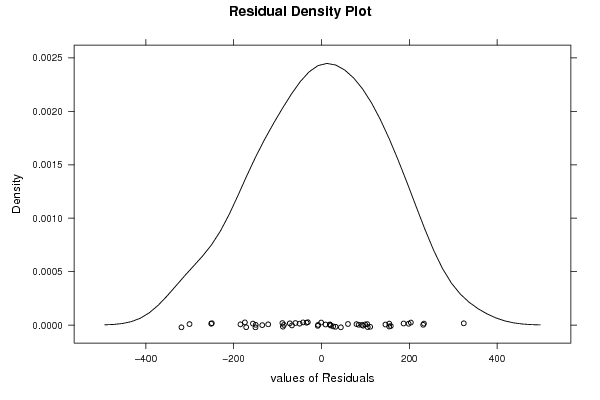
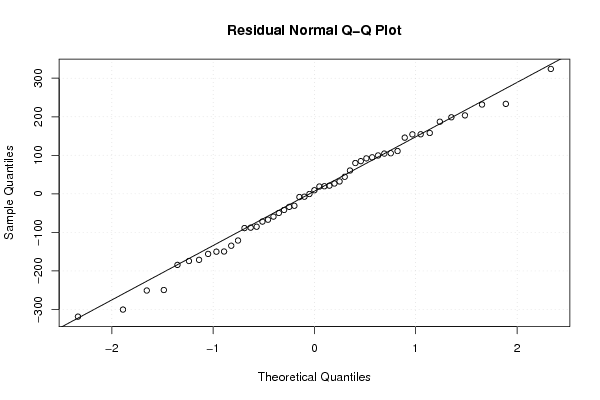
| Multiple Linear Regression - Residual Statistics | |
| Residual Standard Deviation | 182.219833680821 |
| Sum Squared Residuals | 1062530.16917331 |
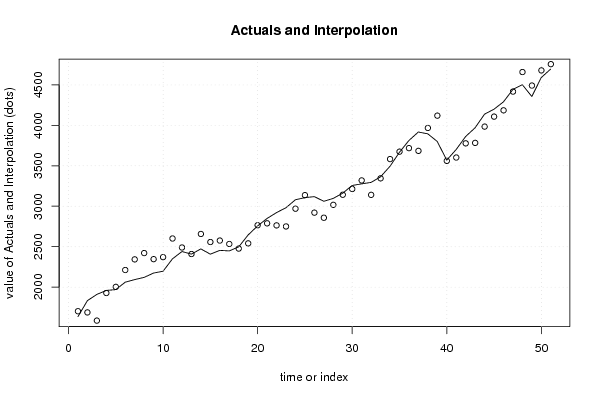
| Multiple Linear Regression - Actuals, Interpolation, and Residuals | |||
| Time or Index | Actuals | Interpolation Forecast | Residuals Prediction Error |
| 1 | 1635.25 | 1702.40964936445 | -67.1596493644514 |
| 2 | 1833.42 | 1687.64855151646 | 145.771448483541 |
| 3 | 1910.43 | 1586.36491561770 | 324.065084382304 |
| 4 | 1959.67 | 1927.55052154928 | 32.1194784507189 |
| 5 | 1969.6 | 2003.46099885971 | -33.8609988597131 |
| 6 | 2061.41 | 2211.58652924925 | -150.176529249245 |
| 7 | 2093.48 | 2343.10987712638 | -249.629877126381 |
| 8 | 2120.88 | 2421.29154667270 | -300.411546672704 |
| 9 | 2174.56 | 2345.92196602643 | -171.361966026433 |
| 10 | 2196.72 | 2371.07398158792 | -174.353981587924 |
| 11 | 2350.44 | 2601.41657562551 | -250.976575625514 |
| 12 | 2440.25 | 2489.95746899894 | -49.7074689989381 |
| 13 | 2408.64 | 2409.17600105041 | -0.536001050413833 |
| 14 | 2472.81 | 2657.24720643326 | -184.437206433259 |
| 15 | 2407.6 | 2557.32055684587 | -149.720556845872 |
| 16 | 2454.62 | 2575.85661019768 | -121.236610197682 |
| 17 | 2448.05 | 2533.46707675863 | -85.41707675863 |
| 18 | 2497.84 | 2476.67724246504 | 21.1627575349631 |
| 19 | 2645.64 | 2541.20144422476 | 104.438555775242 |
| 20 | 2756.76 | 2765.18444901326 | -8.42444901326227 |
| 21 | 2849.27 | 2788.85066298563 | 60.4193370143661 |
| 22 | 2921.44 | 2763.5072366613 | 157.932763338700 |
| 23 | 2981.85 | 2750.17518348297 | 231.674816517032 |
| 24 | 3080.58 | 2969.58095841580 | 110.999041584195 |
| 25 | 3106.22 | 3137.2079819904 | -30.9879819903986 |
| 26 | 3119.31 | 2920.71667528326 | 198.593324716736 |
| 27 | 3061.26 | 2857.67357373134 | 203.586426268661 |
| 28 | 3097.31 | 3017.46144638882 | 79.8485536111783 |
| 29 | 3161.69 | 3142.01760004093 | 19.672399959069 |
| 30 | 3257.16 | 3212.96503333271 | 44.1949666672939 |
| 31 | 3277.01 | 3318.87335223401 | -41.8633522340062 |
| 32 | 3295.32 | 3140.80721653638 | 154.512783463615 |
| 33 | 3363.99 | 3345.10659809418 | 18.8834019058189 |
| 34 | 3494.17 | 3583.08036003983 | -88.9103600398321 |
| 35 | 3667.03 | 3674.5408706455 | -7.51087064549996 |
| 36 | 3813.06 | 3718.34679909221 | 94.713200907786 |
| 37 | 3917.96 | 3684.52615498451 | 233.433845015485 |
| 38 | 3895.51 | 3967.59024821335 | -72.0802482133481 |
| 39 | 3801.06 | 4119.84169116165 | -318.781691161654 |
| 40 | 3570.12 | 3560.85142186421 | 9.2685781357851 |
| 41 | 3701.61 | 3602.00432434073 | 99.6056756592742 |
| 42 | 3862.27 | 3777.45119495301 | 84.8188050469886 |
| 43 | 3970.1 | 3783.04532641486 | 187.054673585145 |
| 44 | 4138.52 | 3984.19678777765 | 154.323212222350 |
| 45 | 4199.75 | 4107.69077289375 | 92.059227106248 |
| 46 | 4290.89 | 4185.55842171094 | 105.331578289056 |
| 47 | 4443.91 | 4417.09737024602 | 26.8126297539823 |
| 48 | 4502.64 | 4658.64477349304 | -156.004773493043 |
| 49 | 4356.98 | 4491.73021261022 | -134.750212610222 |
| 50 | 4591.27 | 4679.11731855367 | -87.8473185536699 |
| 51 | 4696.96 | 4756.10926264344 | -59.1492626434395 |
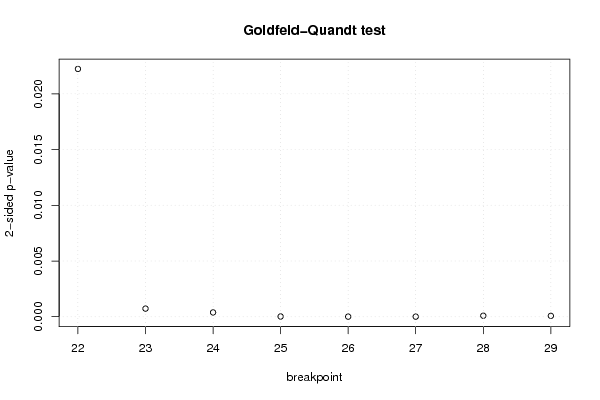
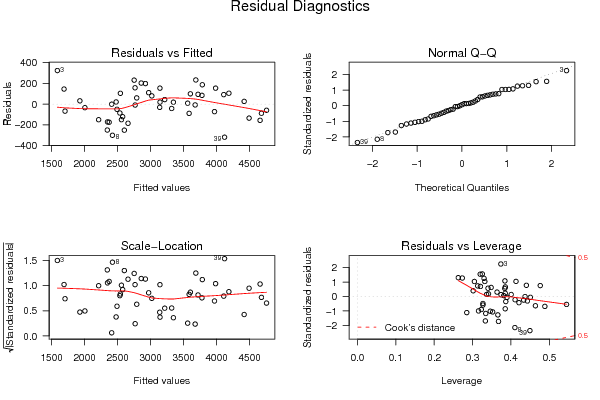
| Goldfeld-Quandt test for Heteroskedasticity | |||
| p-values | Alternative Hypothesis | ||
| breakpoint index | greater | 2-sided | less |
| 22 | 0.988882868531454 | 0.0222342629370918 | 0.0111171314685459 |
| 23 | 0.999635599649851 | 0.000728800700297182 | 0.000364400350148591 |
| 24 | 0.999806669411848 | 0.000386661176304163 | 0.000193330588152082 |
| 25 | 0.999989570530018 | 2.08589399635177e-05 | 1.04294699817588e-05 |
| 26 | 0.999995961037524 | 8.07792495147865e-06 | 4.03896247573932e-06 |
| 27 | 0.999996426523418 | 7.14695316385924e-06 | 3.57347658192962e-06 |
| 28 | 0.99995450047985 | 9.09990402996152e-05 | 4.54995201498076e-05 |
| 29 | 0.999960619162688 | 7.8761674623162e-05 | 3.9380837311581e-05 |
| Meta Analysis of Goldfeld-Quandt test for Heteroskedasticity | |||
| Description | # significant tests | % significant tests | OK/NOK |
| 1% type I error level | 7 | 0.875 | NOK |
| 5% type I error level | 8 | 1 | NOK |
| 10% type I error level | 8 | 1 | NOK |