| Multiple Linear Regression - Estimated Regression Equation |
| BEL_20[t] = + 305.04884420521 -0.0879426162502108Nikkei[t] + 0.273261952991123DJ_Indust[t] + 0.166092429940536Goudprijs[t] -12.1581355295989Conjunct_Seizoenzuiver[t] + 4.00557381579969Cons_vertrouw[t] -120.445196382601Alg_consumptie_index_BE[t] + 176.262121934634Gem_rente_kasbon_1j[t] + 23.0984480449475M1[t] -0.344166273616615M2[t] -3.60816622271175M3[t] + 58.2622039406631M4[t] -80.4908785385934M5[t] -53.38569645481M6[t] + 22.6521134077669M7[t] + 18.2095822005571M8[t] + 39.156207113846M9[t] -25.2026804165444M10[t] + 39.8361573537659M11[t] -40.488723353944t + e[t] |
| Multiple Linear Regression - Ordinary Least Squares | |||||
| Variable | Parameter | S.D. | T-STAT H0: parameter = 0 | 2-tail p-value | 1-tail p-value |
| (Intercept) | 305.04884420521 | 498.910674 | 0.6114 | 0.545373 | 0.272687 |
| Nikkei | -0.0879426162502108 | 0.021636 | -4.0646 | 0.000305 | 0.000153 |
| DJ_Indust | 0.273261952991123 | 0.034297 | 7.9676 | 0 | 0 |
| Goudprijs | 0.166092429940536 | 0.049214 | 3.3749 | 0.002 | 0.001 |
| Conjunct_Seizoenzuiver | -12.1581355295989 | 8.737176 | -1.3915 | 0.173967 | 0.086984 |
| Cons_vertrouw | 4.00557381579969 | 5.914248 | 0.6773 | 0.503255 | 0.251627 |
| Alg_consumptie_index_BE | -120.445196382601 | 41.617129 | -2.8941 | 0.006903 | 0.003452 |
| Gem_rente_kasbon_1j | 176.262121934634 | 72.132874 | 2.4436 | 0.020433 | 0.010216 |
| M1 | 23.0984480449475 | 66.461407 | 0.3475 | 0.730529 | 0.365265 |
| M2 | -0.344166273616615 | 65.876174 | -0.0052 | 0.995865 | 0.497932 |
| M3 | -3.60816622271175 | 66.967874 | -0.0539 | 0.957377 | 0.478689 |
| M4 | 58.2622039406631 | 70.595709 | 0.8253 | 0.415511 | 0.207755 |
| M5 | -80.4908785385934 | 70.2419 | -1.1459 | 0.260602 | 0.130301 |
| M6 | -53.38569645481 | 69.225537 | -0.7712 | 0.446436 | 0.223218 |
| M7 | 22.6521134077669 | 72.085731 | 0.3142 | 0.755445 | 0.377722 |
| M8 | 18.2095822005571 | 70.31967 | 0.259 | 0.797382 | 0.398691 |
| M9 | 39.156207113846 | 68.598938 | 0.5708 | 0.572251 | 0.286125 |
| M10 | -25.2026804165444 | 72.76848 | -0.3463 | 0.731427 | 0.365713 |
| M11 | 39.8361573537659 | 67.906933 | 0.5866 | 0.561701 | 0.280851 |
| t | -40.488723353944 | 4.713977 | -8.5891 | 0 | 0 |
| Multiple Linear Regression - Regression Statistics | |
| Multiple R | 0.985248679887391 |
| R-squared | 0.970714961219847 |
| Adjusted R-squared | 0.952766066483625 |
| F-TEST (value) | 54.0821580094763 |
| F-TEST (DF numerator) | 19 |
| F-TEST (DF denominator) | 31 |
| p-value | 0 |
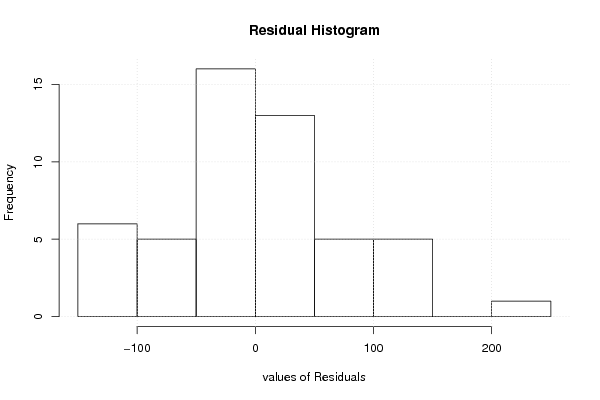
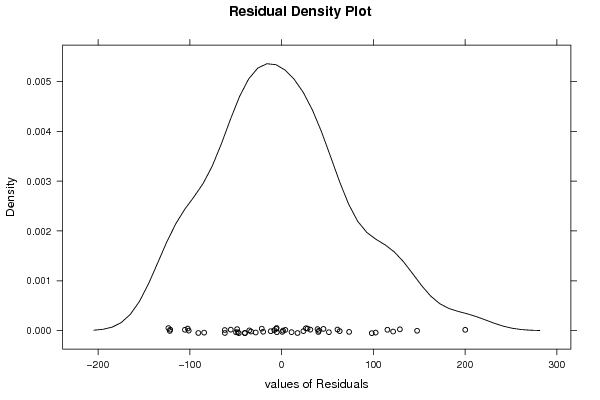
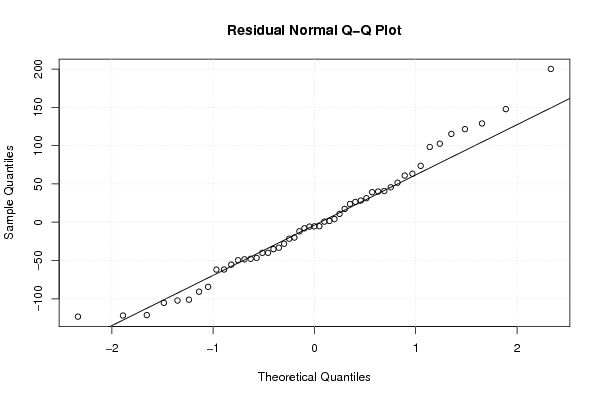
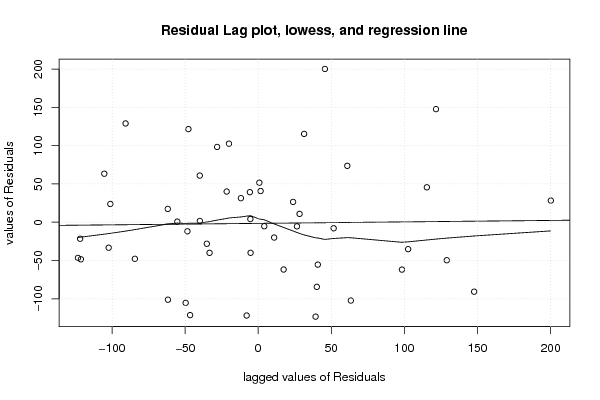
| Multiple Linear Regression - Residual Statistics | |
| Residual Standard Deviation | 93.7311522966766 |
| Sum Squared Residuals | 272351.396236746 |
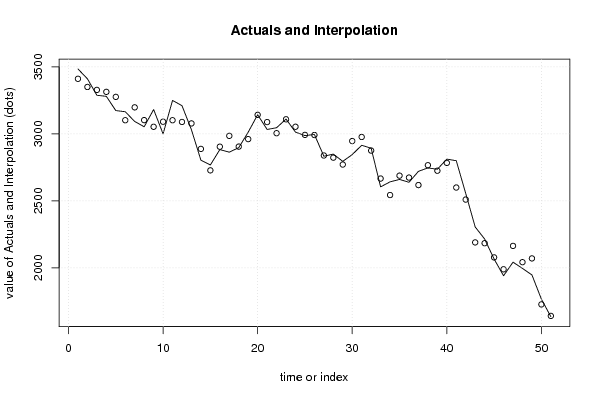
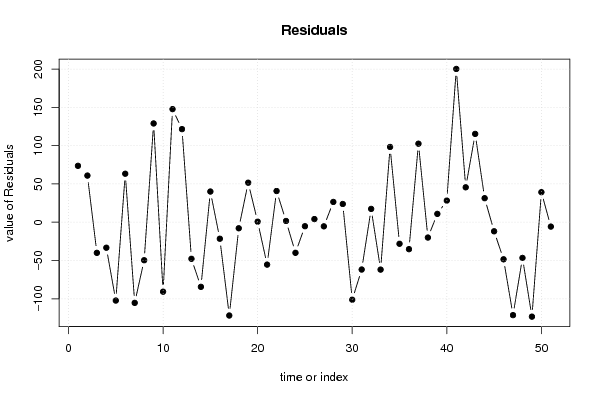
| Multiple Linear Regression - Actuals, Interpolation, and Residuals | |||
| Time or Index | Actuals | Interpolation Forecast | Residuals Prediction Error |
| 1 | 3484.74 | 3411.08530483539 | 73.6546951646108 |
| 2 | 3411.13 | 3350.18655295829 | 60.9434470417099 |
| 3 | 3288.18 | 3328.13620403934 | -39.9562040393389 |
| 4 | 3280.37 | 3313.65826589738 | -33.2882658973784 |
| 5 | 3173.95 | 3276.21163982841 | -102.261639828406 |
| 6 | 3165.26 | 3101.88718857318 | 63.372811426821 |
| 7 | 3092.71 | 3197.98333796861 | -105.273337968608 |
| 8 | 3053.05 | 3102.66451989766 | -49.6145198976608 |
| 9 | 3181.96 | 3052.95095077135 | 129.009049228647 |
| 10 | 2999.93 | 3090.62607476728 | -90.6960747672763 |
| 11 | 3249.57 | 3101.83676566391 | 147.733234336092 |
| 12 | 3210.52 | 3088.89717595945 | 121.622824040547 |
| 13 | 3030.29 | 3078.02623258245 | -47.7362325824522 |
| 14 | 2803.47 | 2887.8359606803 | -84.3659606803034 |
| 15 | 2767.63 | 2727.53322805853 | 40.0967719414666 |
| 16 | 2882.6 | 2904.14803695639 | -21.5480369563949 |
| 17 | 2863.36 | 2985.15762528836 | -121.79762528836 |
| 18 | 2897.06 | 2904.93779648363 | -7.8777964836316 |
| 19 | 3012.61 | 2960.97932907895 | 51.6306709210538 |
| 20 | 3142.95 | 3142.16553977054 | 0.784460229456097 |
| 21 | 3032.93 | 3088.267771848 | -55.3377718479959 |
| 22 | 3045.78 | 3004.99536031845 | 40.7846396815455 |
| 23 | 3110.52 | 3108.8503895602 | 1.66961043979904 |
| 24 | 3013.24 | 3053.14084719075 | -39.9008471907476 |
| 25 | 2987.1 | 2992.29622324266 | -5.19622324265982 |
| 26 | 2995.55 | 2991.40167168537 | 4.14832831463412 |
| 27 | 2833.18 | 2838.5395809222 | -5.35958092219993 |
| 28 | 2848.96 | 2822.43426508417 | 26.525734915829 |
| 29 | 2794.83 | 2770.96658376521 | 23.8634162347896 |
| 30 | 2845.26 | 2946.40903365762 | -101.149033657624 |
| 31 | 2915.02 | 2976.75646767886 | -61.7364676788609 |
| 32 | 2892.63 | 2875.21723519701 | 17.4127648029865 |
| 33 | 2604.42 | 2666.27251486875 | -61.8525148687522 |
| 34 | 2641.65 | 2543.32974539918 | 98.3202546008187 |
| 35 | 2659.81 | 2687.91873151619 | -28.108731516187 |
| 36 | 2638.53 | 2673.66675380822 | -35.1367538082208 |
| 37 | 2720.25 | 2617.68200215537 | 102.567997844628 |
| 38 | 2745.88 | 2765.8691425113 | -19.9891425113007 |
| 39 | 2735.7 | 2724.7809103895 | 10.9190896105037 |
| 40 | 2811.7 | 2783.38943206206 | 28.3105679379443 |
| 41 | 2799.43 | 2599.23415111802 | 200.195848881977 |
| 42 | 2555.28 | 2509.62598128557 | 45.6540187144348 |
| 43 | 2304.98 | 2189.60086527358 | 115.379134726415 |
| 44 | 2214.95 | 2183.53270513478 | 31.4172948652181 |
| 45 | 2065.81 | 2077.6287625119 | -11.818762511899 |
| 46 | 1940.49 | 1988.89881951509 | -48.4088195150879 |
| 47 | 2042 | 2163.2941132597 | -121.294113259704 |
| 48 | 1995.37 | 2041.95522304158 | -46.5852230415791 |
| 49 | 1946.81 | 2070.10023718413 | -123.290237184127 |
| 50 | 1765.9 | 1726.63667216474 | 39.2633278352601 |
| 51 | 1635.25 | 1640.95007659043 | -5.70007659043152 |
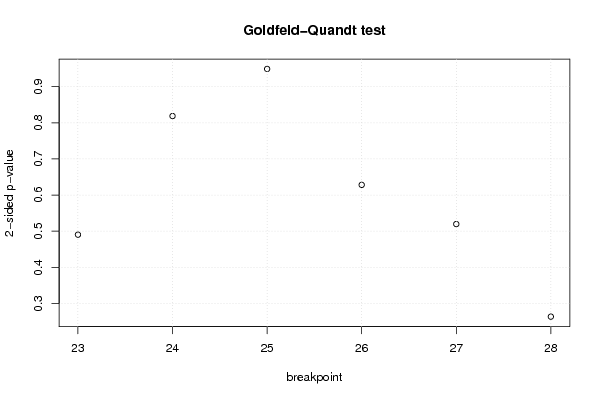
| Goldfeld-Quandt test for Heteroskedasticity | |||
| p-values | Alternative Hypothesis | ||
| breakpoint index | greater | 2-sided | less |
| 23 | 0.754872323045358 | 0.490255353909283 | 0.245127676954642 |
| 24 | 0.590697722545258 | 0.818604554909485 | 0.409302277454742 |
| 25 | 0.474495463648902 | 0.948990927297803 | 0.525504536351099 |
| 26 | 0.314079619135305 | 0.628159238270609 | 0.685920380864696 |
| 27 | 0.259779449936176 | 0.519558899872352 | 0.740220550063824 |
| 28 | 0.13168385812494 | 0.263367716249879 | 0.86831614187506 |
| Meta Analysis of Goldfeld-Quandt test for Heteroskedasticity | |||
| Description | # significant tests | % significant tests | OK/NOK |
| 1% type I error level | 0 | 0 | OK |
| 5% type I error level | 0 | 0 | OK |
| 10% type I error level | 0 | 0 | OK |