Free Statistics

of Irreproducible Research!

Author's title

Author*The author of this computation has been verified*
R Software Modulerwasp_multipleregression.wasp
Title produced by softwareMultiple Regression
Date of computationMon, 06 Dec 2010 14:50:28 +0000
Cite this page as followsStatistical Computations at FreeStatistics.org, Office for Research Development and Education, URL https://freestatistics.org/blog/index.php?v=date/2010/Dec/06/t1291646907tbo90r829b8w3z0.htm/, Retrieved Sun, 28 Apr 2024 23:07:46 +0000
Statistical Computations at FreeStatistics.org, Office for Research Development and Education, URL https://freestatistics.org/blog/index.php?pk=105627, Retrieved Sun, 28 Apr 2024 23:07:46 +0000
QR Codes:

Original text written by user:
IsPrivate?No (this computation is public)
User-defined keywords
Estimated Impact117
Family? (F = Feedback message, R = changed R code, M = changed R Module, P = changed Parameters, D = changed Data)
-       [Multiple Regression] [] [2010-12-06 14:50:28] [c474a97a96075919a678ad3d2290b00b] [Current]
Feedback Forum

Post a new message
Dataseries X:
3484.74	13830.14	9349.44	7977	-5.6	6	1	2.77
3411.13	14153.22	9327.78	8241	-6.2	3	1	2.76
3288.18	15418.03	9753.63	8444	-7.1	2	1.2	2.76
3280.37	16666.97	10443.5	8490	-1.4	2	1.2	2.46
3173.95	16505.21	10853.87	8388	-0.1	2	0.8	2.46
3165.26	17135.96	10704.02	8099	-0.9	-8	0.7	2.47
3092.71	18033.25	11052.23	7984	0	0	0.7	2.71
3053.05	17671	10935.47	7786	0.1	-2	0.9	2.8
3181.96	17544.22	10714.03	8086	2.6	3	1.2	2.89
2999.93	17677.9	10394.48	9315	6	5	1.3	3.36
3249.57	18470.97	10817.9	9113	6.4	8	1.5	3.31
3210.52	18409.96	11251.2	9023	8.6	8	1.9	3.5
3030.29	18941.6	11281.26	9026	6.4	9	1.8	3.51
2803.47	19685.53	10539.68	9787	7.7	11	1.9	3.71
2767.63	19834.71	10483.39	9536	9.2	13	2.2	3.71
2882.6	19598.93	10947.43	9490	8.6	12	2.1	3.71
2863.36	17039.97	10580.27	9736	7.4	13	2.2	4.21
2897.06	16969.28	10582.92	9694	8.6	15	2.7	4.21
3012.61	16973.38	10654.41	9647	6.2	13	2.8	4.21
3142.95	16329.89	11014.51	9753	6	16	2.9	4.5
3032.93	16153.34	10967.87	10070	6.6	10	3.4	4.51
3045.78	15311.7	10433.56	10137	5.1	14	3	4.51
3110.52	14760.87	10665.78	9984	4.7	14	3.1	4.51
3013.24	14452.93	10666.71	9732	5	15	2.5	4.32
2987.1	13720.95	10682.74	9103	3.6	13	2.2	4.02
2995.55	13266.27	10777.22	9155	1.9	8	2.3	4.02
2833.18	12708.47	10052.6	9308	-0.1	7	2.1	3.85
2848.96	13411.84	10213.97	9394	-5.7	3	2.8	3.84
2794.83	13975.55	10546.82	9948	-5.6	3	3.1	4.02
2845.26	12974.89	10767.2	10177	-6.4	4	2.9	3.82
2915.02	12151.11	10444.5	10002	-7.7	4	2.6	3.75
2892.63	11576.21	10314.68	9728	-8	0	2.7	3.74
2604.42	9996.83	9042.56	10002	-11.9	-4	2.3	3.14
2641.65	10438.9	9220.75	10063	-15.4	-14	2.3	2.91
2659.81	10511.22	9721.84	10018	-15.5	-18	2.1	2.84
2638.53	10496.2	9978.53	9960	-13.4	-8	2.2	2.85
2720.25	10300.79	9923.81	10236	-10.9	-1	2.9	2.85
2745.88	9981.65	9892.56	10893	-10.8	1	2.6	3.08
2735.7	11448.79	10500.98	10756	-7.3	2	2.7	3.3
2811.7	11384.49	10179.35	10940	-6.5	0	1.8	3.29
2799.43	11717.46	10080.48	10997	-5.1	1	1.3	3.26
2555.28	10965.88	9492.44	10827	-5.3	0	0.9	3.26
2304.98	10352.27	8616.49	10166	-6.8	-1	1.3	3.11
2214.95	9751.2	8685.4	10186	-8.4	-3	1.3	2.84
2065.81	9354.01	8160.67	10457	-8.4	-3	1.3	2.71
1940.49	8792.5	8048.1	10368	-9.7	-3	1.3	2.69
2042	8721.14	8641.21	10244	-8.8	-4	1.1	2.65
1995.37	8692.94	8526.63	10511	-9.6	-8	1.4	2.57
1946.81	8570.73	8474.21	10812	-11.5	-9	1.2	2.32
1765.9	8538.47	7916.13	10738	-11	-13	1.7	2.12
1635.25	8169.75	7977.64	10171	-14.9	-18	1.8	2.05


Summary of computational transaction
Raw Inputview raw input (R code)
Raw Outputview raw output of R engine
Computing time6 seconds
R Server'RServer@AstonUniversity' @ vre.aston.ac.uk

\begin{tabular}{lllllllll}
\hline
Summary of computational transaction \tabularnewline
Raw Input & view raw input (R code)  \tabularnewline
Raw Output & view raw output of R engine  \tabularnewline
Computing time & 6 seconds \tabularnewline
R Server & 'RServer@AstonUniversity' @ vre.aston.ac.uk \tabularnewline
\hline
\end{tabular}
%Source: https://freestatistics.org/blog/index.php?pk=105627&T=0

[TABLE]
[ROW][C]Summary of computational transaction[/C][/ROW]
[ROW][C]Raw Input[/C][C]view raw input (R code) [/C][/ROW]
[ROW][C]Raw Output[/C][C]view raw output of R engine [/C][/ROW]
[ROW][C]Computing time[/C][C]6 seconds[/C][/ROW]
[ROW][C]R Server[/C][C]'RServer@AstonUniversity' @ vre.aston.ac.uk[/C][/ROW]
[/TABLE]
Source: https://freestatistics.org/blog/index.php?pk=105627&T=0

Globally Unique Identifier (entire table): ba.freestatistics.org/blog/index.php?pk=105627&T=0

As an alternative you can also use a QR Code:  

The GUIDs for individual cells are displayed in the table below:

Summary of computational transaction
Raw Inputview raw input (R code)
Raw Outputview raw output of R engine
Computing time6 seconds
R Server'RServer@AstonUniversity' @ vre.aston.ac.uk


Multiple Linear Regression - Estimated Regression Equation
BEL_20[t] = + 305.04884420521 -0.0879426162502108Nikkei[t] + 0.273261952991123DJ_Indust[t] + 0.166092429940536Goudprijs[t] -12.1581355295989Conjunct_Seizoenzuiver[t] + 4.00557381579969Cons_vertrouw[t] -120.445196382601Alg_consumptie_index_BE[t] + 176.262121934634Gem_rente_kasbon_1j[t] + 23.0984480449475M1[t] -0.344166273616615M2[t] -3.60816622271175M3[t] + 58.2622039406631M4[t] -80.4908785385934M5[t] -53.38569645481M6[t] + 22.6521134077669M7[t] + 18.2095822005571M8[t] + 39.156207113846M9[t] -25.2026804165444M10[t] + 39.8361573537659M11[t] -40.488723353944t + e[t]

\begin{tabular}{lllllllll}
\hline
Multiple Linear Regression - Estimated Regression Equation \tabularnewline
BEL_20[t] =  +  305.04884420521 -0.0879426162502108Nikkei[t] +  0.273261952991123DJ_Indust[t] +  0.166092429940536Goudprijs[t] -12.1581355295989Conjunct_Seizoenzuiver[t] +  4.00557381579969Cons_vertrouw[t] -120.445196382601Alg_consumptie_index_BE[t] +  176.262121934634Gem_rente_kasbon_1j[t] +  23.0984480449475M1[t] -0.344166273616615M2[t] -3.60816622271175M3[t] +  58.2622039406631M4[t] -80.4908785385934M5[t] -53.38569645481M6[t] +  22.6521134077669M7[t] +  18.2095822005571M8[t] +  39.156207113846M9[t] -25.2026804165444M10[t] +  39.8361573537659M11[t] -40.488723353944t  + e[t] \tabularnewline
\hline
\end{tabular}
%Source: https://freestatistics.org/blog/index.php?pk=105627&T=1

[TABLE]
[ROW][C]Multiple Linear Regression - Estimated Regression Equation[/C][/ROW]
[ROW][C]BEL_20[t] =  +  305.04884420521 -0.0879426162502108Nikkei[t] +  0.273261952991123DJ_Indust[t] +  0.166092429940536Goudprijs[t] -12.1581355295989Conjunct_Seizoenzuiver[t] +  4.00557381579969Cons_vertrouw[t] -120.445196382601Alg_consumptie_index_BE[t] +  176.262121934634Gem_rente_kasbon_1j[t] +  23.0984480449475M1[t] -0.344166273616615M2[t] -3.60816622271175M3[t] +  58.2622039406631M4[t] -80.4908785385934M5[t] -53.38569645481M6[t] +  22.6521134077669M7[t] +  18.2095822005571M8[t] +  39.156207113846M9[t] -25.2026804165444M10[t] +  39.8361573537659M11[t] -40.488723353944t  + e[t][/C][/ROW]
[/TABLE]
Source: https://freestatistics.org/blog/index.php?pk=105627&T=1

Globally Unique Identifier (entire table): ba.freestatistics.org/blog/index.php?pk=105627&T=1

As an alternative you can also use a QR Code:  

The GUIDs for individual cells are displayed in the table below:

Multiple Linear Regression - Estimated Regression Equation
BEL_20[t] = + 305.04884420521 -0.0879426162502108Nikkei[t] + 0.273261952991123DJ_Indust[t] + 0.166092429940536Goudprijs[t] -12.1581355295989Conjunct_Seizoenzuiver[t] + 4.00557381579969Cons_vertrouw[t] -120.445196382601Alg_consumptie_index_BE[t] + 176.262121934634Gem_rente_kasbon_1j[t] + 23.0984480449475M1[t] -0.344166273616615M2[t] -3.60816622271175M3[t] + 58.2622039406631M4[t] -80.4908785385934M5[t] -53.38569645481M6[t] + 22.6521134077669M7[t] + 18.2095822005571M8[t] + 39.156207113846M9[t] -25.2026804165444M10[t] + 39.8361573537659M11[t] -40.488723353944t + e[t]


Multiple Linear Regression - Ordinary Least Squares
VariableParameterS.D.T-STATH0: parameter = 02-tail p-value1-tail p-value
(Intercept)305.04884420521498.9106740.61140.5453730.272687
Nikkei-0.08794261625021080.021636-4.06460.0003050.000153
DJ_Indust0.2732619529911230.0342977.967600
Goudprijs0.1660924299405360.0492143.37490.0020.001
Conjunct_Seizoenzuiver-12.15813552959898.737176-1.39150.1739670.086984
Cons_vertrouw4.005573815799695.9142480.67730.5032550.251627
Alg_consumptie_index_BE-120.44519638260141.617129-2.89410.0069030.003452
Gem_rente_kasbon_1j176.26212193463472.1328742.44360.0204330.010216
M123.098448044947566.4614070.34750.7305290.365265
M2-0.34416627361661565.876174-0.00520.9958650.497932
M3-3.6081662227117566.967874-0.05390.9573770.478689
M458.262203940663170.5957090.82530.4155110.207755
M5-80.490878538593470.2419-1.14590.2606020.130301
M6-53.3856964548169.225537-0.77120.4464360.223218
M722.652113407766972.0857310.31420.7554450.377722
M818.209582200557170.319670.2590.7973820.398691
M939.15620711384668.5989380.57080.5722510.286125
M10-25.202680416544472.76848-0.34630.7314270.365713
M1139.836157353765967.9069330.58660.5617010.280851
t-40.4887233539444.713977-8.589100

\begin{tabular}{lllllllll}
\hline
Multiple Linear Regression - Ordinary Least Squares \tabularnewline
Variable & Parameter & S.D. & T-STATH0: parameter = 0 & 2-tail p-value & 1-tail p-value \tabularnewline
(Intercept) & 305.04884420521 & 498.910674 & 0.6114 & 0.545373 & 0.272687 \tabularnewline
Nikkei & -0.0879426162502108 & 0.021636 & -4.0646 & 0.000305 & 0.000153 \tabularnewline
DJ_Indust & 0.273261952991123 & 0.034297 & 7.9676 & 0 & 0 \tabularnewline
Goudprijs & 0.166092429940536 & 0.049214 & 3.3749 & 0.002 & 0.001 \tabularnewline
Conjunct_Seizoenzuiver & -12.1581355295989 & 8.737176 & -1.3915 & 0.173967 & 0.086984 \tabularnewline
Cons_vertrouw & 4.00557381579969 & 5.914248 & 0.6773 & 0.503255 & 0.251627 \tabularnewline
Alg_consumptie_index_BE & -120.445196382601 & 41.617129 & -2.8941 & 0.006903 & 0.003452 \tabularnewline
Gem_rente_kasbon_1j & 176.262121934634 & 72.132874 & 2.4436 & 0.020433 & 0.010216 \tabularnewline
M1 & 23.0984480449475 & 66.461407 & 0.3475 & 0.730529 & 0.365265 \tabularnewline
M2 & -0.344166273616615 & 65.876174 & -0.0052 & 0.995865 & 0.497932 \tabularnewline
M3 & -3.60816622271175 & 66.967874 & -0.0539 & 0.957377 & 0.478689 \tabularnewline
M4 & 58.2622039406631 & 70.595709 & 0.8253 & 0.415511 & 0.207755 \tabularnewline
M5 & -80.4908785385934 & 70.2419 & -1.1459 & 0.260602 & 0.130301 \tabularnewline
M6 & -53.38569645481 & 69.225537 & -0.7712 & 0.446436 & 0.223218 \tabularnewline
M7 & 22.6521134077669 & 72.085731 & 0.3142 & 0.755445 & 0.377722 \tabularnewline
M8 & 18.2095822005571 & 70.31967 & 0.259 & 0.797382 & 0.398691 \tabularnewline
M9 & 39.156207113846 & 68.598938 & 0.5708 & 0.572251 & 0.286125 \tabularnewline
M10 & -25.2026804165444 & 72.76848 & -0.3463 & 0.731427 & 0.365713 \tabularnewline
M11 & 39.8361573537659 & 67.906933 & 0.5866 & 0.561701 & 0.280851 \tabularnewline
t & -40.488723353944 & 4.713977 & -8.5891 & 0 & 0 \tabularnewline
\hline
\end{tabular}
%Source: https://freestatistics.org/blog/index.php?pk=105627&T=2

[TABLE]
[ROW][C]Multiple Linear Regression - Ordinary Least Squares[/C][/ROW]
[ROW][C]Variable[/C][C]Parameter[/C][C]S.D.[/C][C]T-STATH0: parameter = 0[/C][C]2-tail p-value[/C][C]1-tail p-value[/C][/ROW]
[ROW][C](Intercept)[/C][C]305.04884420521[/C][C]498.910674[/C][C]0.6114[/C][C]0.545373[/C][C]0.272687[/C][/ROW]
[ROW][C]Nikkei[/C][C]-0.0879426162502108[/C][C]0.021636[/C][C]-4.0646[/C][C]0.000305[/C][C]0.000153[/C][/ROW]
[ROW][C]DJ_Indust[/C][C]0.273261952991123[/C][C]0.034297[/C][C]7.9676[/C][C]0[/C][C]0[/C][/ROW]
[ROW][C]Goudprijs[/C][C]0.166092429940536[/C][C]0.049214[/C][C]3.3749[/C][C]0.002[/C][C]0.001[/C][/ROW]
[ROW][C]Conjunct_Seizoenzuiver[/C][C]-12.1581355295989[/C][C]8.737176[/C][C]-1.3915[/C][C]0.173967[/C][C]0.086984[/C][/ROW]
[ROW][C]Cons_vertrouw[/C][C]4.00557381579969[/C][C]5.914248[/C][C]0.6773[/C][C]0.503255[/C][C]0.251627[/C][/ROW]
[ROW][C]Alg_consumptie_index_BE[/C][C]-120.445196382601[/C][C]41.617129[/C][C]-2.8941[/C][C]0.006903[/C][C]0.003452[/C][/ROW]
[ROW][C]Gem_rente_kasbon_1j[/C][C]176.262121934634[/C][C]72.132874[/C][C]2.4436[/C][C]0.020433[/C][C]0.010216[/C][/ROW]
[ROW][C]M1[/C][C]23.0984480449475[/C][C]66.461407[/C][C]0.3475[/C][C]0.730529[/C][C]0.365265[/C][/ROW]
[ROW][C]M2[/C][C]-0.344166273616615[/C][C]65.876174[/C][C]-0.0052[/C][C]0.995865[/C][C]0.497932[/C][/ROW]
[ROW][C]M3[/C][C]-3.60816622271175[/C][C]66.967874[/C][C]-0.0539[/C][C]0.957377[/C][C]0.478689[/C][/ROW]
[ROW][C]M4[/C][C]58.2622039406631[/C][C]70.595709[/C][C]0.8253[/C][C]0.415511[/C][C]0.207755[/C][/ROW]
[ROW][C]M5[/C][C]-80.4908785385934[/C][C]70.2419[/C][C]-1.1459[/C][C]0.260602[/C][C]0.130301[/C][/ROW]
[ROW][C]M6[/C][C]-53.38569645481[/C][C]69.225537[/C][C]-0.7712[/C][C]0.446436[/C][C]0.223218[/C][/ROW]
[ROW][C]M7[/C][C]22.6521134077669[/C][C]72.085731[/C][C]0.3142[/C][C]0.755445[/C][C]0.377722[/C][/ROW]
[ROW][C]M8[/C][C]18.2095822005571[/C][C]70.31967[/C][C]0.259[/C][C]0.797382[/C][C]0.398691[/C][/ROW]
[ROW][C]M9[/C][C]39.156207113846[/C][C]68.598938[/C][C]0.5708[/C][C]0.572251[/C][C]0.286125[/C][/ROW]
[ROW][C]M10[/C][C]-25.2026804165444[/C][C]72.76848[/C][C]-0.3463[/C][C]0.731427[/C][C]0.365713[/C][/ROW]
[ROW][C]M11[/C][C]39.8361573537659[/C][C]67.906933[/C][C]0.5866[/C][C]0.561701[/C][C]0.280851[/C][/ROW]
[ROW][C]t[/C][C]-40.488723353944[/C][C]4.713977[/C][C]-8.5891[/C][C]0[/C][C]0[/C][/ROW]
[/TABLE]
Source: https://freestatistics.org/blog/index.php?pk=105627&T=2

Globally Unique Identifier (entire table): ba.freestatistics.org/blog/index.php?pk=105627&T=2

As an alternative you can also use a QR Code:  

The GUIDs for individual cells are displayed in the table below:

Multiple Linear Regression - Ordinary Least Squares
VariableParameterS.D.T-STATH0: parameter = 02-tail p-value1-tail p-value
(Intercept)305.04884420521498.9106740.61140.5453730.272687
Nikkei-0.08794261625021080.021636-4.06460.0003050.000153
DJ_Indust0.2732619529911230.0342977.967600
Goudprijs0.1660924299405360.0492143.37490.0020.001
Conjunct_Seizoenzuiver-12.15813552959898.737176-1.39150.1739670.086984
Cons_vertrouw4.005573815799695.9142480.67730.5032550.251627
Alg_consumptie_index_BE-120.44519638260141.617129-2.89410.0069030.003452
Gem_rente_kasbon_1j176.26212193463472.1328742.44360.0204330.010216
M123.098448044947566.4614070.34750.7305290.365265
M2-0.34416627361661565.876174-0.00520.9958650.497932
M3-3.6081662227117566.967874-0.05390.9573770.478689
M458.262203940663170.5957090.82530.4155110.207755
M5-80.490878538593470.2419-1.14590.2606020.130301
M6-53.3856964548169.225537-0.77120.4464360.223218
M722.652113407766972.0857310.31420.7554450.377722
M818.209582200557170.319670.2590.7973820.398691
M939.15620711384668.5989380.57080.5722510.286125
M10-25.202680416544472.76848-0.34630.7314270.365713
M1139.836157353765967.9069330.58660.5617010.280851
t-40.4887233539444.713977-8.589100


Multiple Linear Regression - Regression Statistics
Multiple R0.985248679887391
R-squared0.970714961219847
Adjusted R-squared0.952766066483625
F-TEST (value)54.0821580094763
F-TEST (DF numerator)19
F-TEST (DF denominator)31
p-value0
Multiple Linear Regression - Residual Statistics
Residual Standard Deviation93.7311522966766
Sum Squared Residuals272351.396236746

\begin{tabular}{lllllllll}
\hline
Multiple Linear Regression - Regression Statistics \tabularnewline
Multiple R & 0.985248679887391 \tabularnewline
R-squared & 0.970714961219847 \tabularnewline
Adjusted R-squared & 0.952766066483625 \tabularnewline
F-TEST (value) & 54.0821580094763 \tabularnewline
F-TEST (DF numerator) & 19 \tabularnewline
F-TEST (DF denominator) & 31 \tabularnewline
p-value & 0 \tabularnewline
Multiple Linear Regression - Residual Statistics \tabularnewline
Residual Standard Deviation & 93.7311522966766 \tabularnewline
Sum Squared Residuals & 272351.396236746 \tabularnewline
\hline
\end{tabular}
%Source: https://freestatistics.org/blog/index.php?pk=105627&T=3

[TABLE]
[ROW][C]Multiple Linear Regression - Regression Statistics[/C][/ROW]
[ROW][C]Multiple R[/C][C]0.985248679887391[/C][/ROW]
[ROW][C]R-squared[/C][C]0.970714961219847[/C][/ROW]
[ROW][C]Adjusted R-squared[/C][C]0.952766066483625[/C][/ROW]
[ROW][C]F-TEST (value)[/C][C]54.0821580094763[/C][/ROW]
[ROW][C]F-TEST (DF numerator)[/C][C]19[/C][/ROW]
[ROW][C]F-TEST (DF denominator)[/C][C]31[/C][/ROW]
[ROW][C]p-value[/C][C]0[/C][/ROW]
[ROW][C]Multiple Linear Regression - Residual Statistics[/C][/ROW]
[ROW][C]Residual Standard Deviation[/C][C]93.7311522966766[/C][/ROW]
[ROW][C]Sum Squared Residuals[/C][C]272351.396236746[/C][/ROW]
[/TABLE]
Source: https://freestatistics.org/blog/index.php?pk=105627&T=3

Globally Unique Identifier (entire table): ba.freestatistics.org/blog/index.php?pk=105627&T=3

As an alternative you can also use a QR Code:  

The GUIDs for individual cells are displayed in the table below:

Multiple Linear Regression - Regression Statistics
Multiple R0.985248679887391
R-squared0.970714961219847
Adjusted R-squared0.952766066483625
F-TEST (value)54.0821580094763
F-TEST (DF numerator)19
F-TEST (DF denominator)31
p-value0
Multiple Linear Regression - Residual Statistics
Residual Standard Deviation93.7311522966766
Sum Squared Residuals272351.396236746


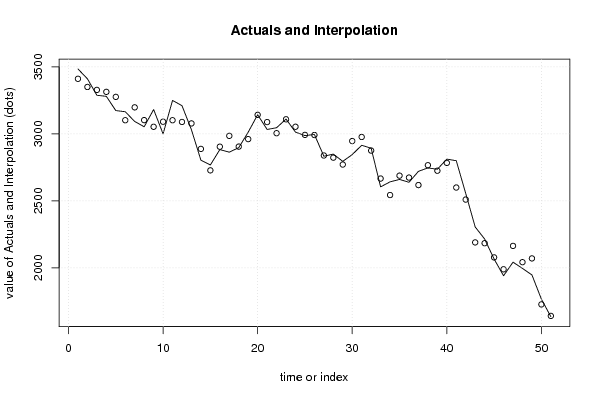
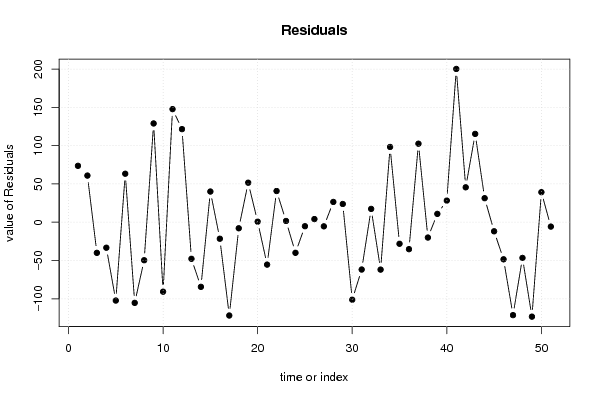
Multiple Linear Regression - Actuals, Interpolation, and Residuals
Time or IndexActualsInterpolationForecastResidualsPrediction Error
13484.743411.0853048353973.6546951646108
23411.133350.1865529582960.9434470417099
33288.183328.13620403934-39.9562040393389
43280.373313.65826589738-33.2882658973784
53173.953276.21163982841-102.261639828406
63165.263101.8871885731863.372811426821
73092.713197.98333796861-105.273337968608
83053.053102.66451989766-49.6145198976608
93181.963052.95095077135129.009049228647
102999.933090.62607476728-90.6960747672763
113249.573101.83676566391147.733234336092
123210.523088.89717595945121.622824040547
133030.293078.02623258245-47.7362325824522
142803.472887.8359606803-84.3659606803034
152767.632727.5332280585340.0967719414666
162882.62904.14803695639-21.5480369563949
172863.362985.15762528836-121.79762528836
182897.062904.93779648363-7.8777964836316
193012.612960.9793290789551.6306709210538
203142.953142.165539770540.784460229456097
213032.933088.267771848-55.3377718479959
223045.783004.9953603184540.7846396815455
233110.523108.85038956021.66961043979904
243013.243053.14084719075-39.9008471907476
252987.12992.29622324266-5.19622324265982
262995.552991.401671685374.14832831463412
272833.182838.5395809222-5.35958092219993
282848.962822.4342650841726.525734915829
292794.832770.9665837652123.8634162347896
302845.262946.40903365762-101.149033657624
312915.022976.75646767886-61.7364676788609
322892.632875.2172351970117.4127648029865
332604.422666.27251486875-61.8525148687522
342641.652543.3297453991898.3202546008187
352659.812687.91873151619-28.108731516187
362638.532673.66675380822-35.1367538082208
372720.252617.68200215537102.567997844628
382745.882765.8691425113-19.9891425113007
392735.72724.780910389510.9190896105037
402811.72783.3894320620628.3105679379443
412799.432599.23415111802200.195848881977
422555.282509.6259812855745.6540187144348
432304.982189.60086527358115.379134726415
442214.952183.5327051347831.4172948652181
452065.812077.6287625119-11.818762511899
461940.491988.89881951509-48.4088195150879
4720422163.2941132597-121.294113259704
481995.372041.95522304158-46.5852230415791
491946.812070.10023718413-123.290237184127
501765.91726.6366721647439.2633278352601
511635.251640.95007659043-5.70007659043152

\begin{tabular}{lllllllll}
\hline
Multiple Linear Regression - Actuals, Interpolation, and Residuals \tabularnewline
Time or Index & Actuals & InterpolationForecast & ResidualsPrediction Error \tabularnewline
1 & 3484.74 & 3411.08530483539 & 73.6546951646108 \tabularnewline
2 & 3411.13 & 3350.18655295829 & 60.9434470417099 \tabularnewline
3 & 3288.18 & 3328.13620403934 & -39.9562040393389 \tabularnewline
4 & 3280.37 & 3313.65826589738 & -33.2882658973784 \tabularnewline
5 & 3173.95 & 3276.21163982841 & -102.261639828406 \tabularnewline
6 & 3165.26 & 3101.88718857318 & 63.372811426821 \tabularnewline
7 & 3092.71 & 3197.98333796861 & -105.273337968608 \tabularnewline
8 & 3053.05 & 3102.66451989766 & -49.6145198976608 \tabularnewline
9 & 3181.96 & 3052.95095077135 & 129.009049228647 \tabularnewline
10 & 2999.93 & 3090.62607476728 & -90.6960747672763 \tabularnewline
11 & 3249.57 & 3101.83676566391 & 147.733234336092 \tabularnewline
12 & 3210.52 & 3088.89717595945 & 121.622824040547 \tabularnewline
13 & 3030.29 & 3078.02623258245 & -47.7362325824522 \tabularnewline
14 & 2803.47 & 2887.8359606803 & -84.3659606803034 \tabularnewline
15 & 2767.63 & 2727.53322805853 & 40.0967719414666 \tabularnewline
16 & 2882.6 & 2904.14803695639 & -21.5480369563949 \tabularnewline
17 & 2863.36 & 2985.15762528836 & -121.79762528836 \tabularnewline
18 & 2897.06 & 2904.93779648363 & -7.8777964836316 \tabularnewline
19 & 3012.61 & 2960.97932907895 & 51.6306709210538 \tabularnewline
20 & 3142.95 & 3142.16553977054 & 0.784460229456097 \tabularnewline
21 & 3032.93 & 3088.267771848 & -55.3377718479959 \tabularnewline
22 & 3045.78 & 3004.99536031845 & 40.7846396815455 \tabularnewline
23 & 3110.52 & 3108.8503895602 & 1.66961043979904 \tabularnewline
24 & 3013.24 & 3053.14084719075 & -39.9008471907476 \tabularnewline
25 & 2987.1 & 2992.29622324266 & -5.19622324265982 \tabularnewline
26 & 2995.55 & 2991.40167168537 & 4.14832831463412 \tabularnewline
27 & 2833.18 & 2838.5395809222 & -5.35958092219993 \tabularnewline
28 & 2848.96 & 2822.43426508417 & 26.525734915829 \tabularnewline
29 & 2794.83 & 2770.96658376521 & 23.8634162347896 \tabularnewline
30 & 2845.26 & 2946.40903365762 & -101.149033657624 \tabularnewline
31 & 2915.02 & 2976.75646767886 & -61.7364676788609 \tabularnewline
32 & 2892.63 & 2875.21723519701 & 17.4127648029865 \tabularnewline
33 & 2604.42 & 2666.27251486875 & -61.8525148687522 \tabularnewline
34 & 2641.65 & 2543.32974539918 & 98.3202546008187 \tabularnewline
35 & 2659.81 & 2687.91873151619 & -28.108731516187 \tabularnewline
36 & 2638.53 & 2673.66675380822 & -35.1367538082208 \tabularnewline
37 & 2720.25 & 2617.68200215537 & 102.567997844628 \tabularnewline
38 & 2745.88 & 2765.8691425113 & -19.9891425113007 \tabularnewline
39 & 2735.7 & 2724.7809103895 & 10.9190896105037 \tabularnewline
40 & 2811.7 & 2783.38943206206 & 28.3105679379443 \tabularnewline
41 & 2799.43 & 2599.23415111802 & 200.195848881977 \tabularnewline
42 & 2555.28 & 2509.62598128557 & 45.6540187144348 \tabularnewline
43 & 2304.98 & 2189.60086527358 & 115.379134726415 \tabularnewline
44 & 2214.95 & 2183.53270513478 & 31.4172948652181 \tabularnewline
45 & 2065.81 & 2077.6287625119 & -11.818762511899 \tabularnewline
46 & 1940.49 & 1988.89881951509 & -48.4088195150879 \tabularnewline
47 & 2042 & 2163.2941132597 & -121.294113259704 \tabularnewline
48 & 1995.37 & 2041.95522304158 & -46.5852230415791 \tabularnewline
49 & 1946.81 & 2070.10023718413 & -123.290237184127 \tabularnewline
50 & 1765.9 & 1726.63667216474 & 39.2633278352601 \tabularnewline
51 & 1635.25 & 1640.95007659043 & -5.70007659043152 \tabularnewline
\hline
\end{tabular}
%Source: https://freestatistics.org/blog/index.php?pk=105627&T=4

[TABLE]
[ROW][C]Multiple Linear Regression - Actuals, Interpolation, and Residuals[/C][/ROW]
[ROW][C]Time or Index[/C][C]Actuals[/C][C]InterpolationForecast[/C][C]ResidualsPrediction Error[/C][/ROW]
[ROW][C]1[/C][C]3484.74[/C][C]3411.08530483539[/C][C]73.6546951646108[/C][/ROW]
[ROW][C]2[/C][C]3411.13[/C][C]3350.18655295829[/C][C]60.9434470417099[/C][/ROW]
[ROW][C]3[/C][C]3288.18[/C][C]3328.13620403934[/C][C]-39.9562040393389[/C][/ROW]
[ROW][C]4[/C][C]3280.37[/C][C]3313.65826589738[/C][C]-33.2882658973784[/C][/ROW]
[ROW][C]5[/C][C]3173.95[/C][C]3276.21163982841[/C][C]-102.261639828406[/C][/ROW]
[ROW][C]6[/C][C]3165.26[/C][C]3101.88718857318[/C][C]63.372811426821[/C][/ROW]
[ROW][C]7[/C][C]3092.71[/C][C]3197.98333796861[/C][C]-105.273337968608[/C][/ROW]
[ROW][C]8[/C][C]3053.05[/C][C]3102.66451989766[/C][C]-49.6145198976608[/C][/ROW]
[ROW][C]9[/C][C]3181.96[/C][C]3052.95095077135[/C][C]129.009049228647[/C][/ROW]
[ROW][C]10[/C][C]2999.93[/C][C]3090.62607476728[/C][C]-90.6960747672763[/C][/ROW]
[ROW][C]11[/C][C]3249.57[/C][C]3101.83676566391[/C][C]147.733234336092[/C][/ROW]
[ROW][C]12[/C][C]3210.52[/C][C]3088.89717595945[/C][C]121.622824040547[/C][/ROW]
[ROW][C]13[/C][C]3030.29[/C][C]3078.02623258245[/C][C]-47.7362325824522[/C][/ROW]
[ROW][C]14[/C][C]2803.47[/C][C]2887.8359606803[/C][C]-84.3659606803034[/C][/ROW]
[ROW][C]15[/C][C]2767.63[/C][C]2727.53322805853[/C][C]40.0967719414666[/C][/ROW]
[ROW][C]16[/C][C]2882.6[/C][C]2904.14803695639[/C][C]-21.5480369563949[/C][/ROW]
[ROW][C]17[/C][C]2863.36[/C][C]2985.15762528836[/C][C]-121.79762528836[/C][/ROW]
[ROW][C]18[/C][C]2897.06[/C][C]2904.93779648363[/C][C]-7.8777964836316[/C][/ROW]
[ROW][C]19[/C][C]3012.61[/C][C]2960.97932907895[/C][C]51.6306709210538[/C][/ROW]
[ROW][C]20[/C][C]3142.95[/C][C]3142.16553977054[/C][C]0.784460229456097[/C][/ROW]
[ROW][C]21[/C][C]3032.93[/C][C]3088.267771848[/C][C]-55.3377718479959[/C][/ROW]
[ROW][C]22[/C][C]3045.78[/C][C]3004.99536031845[/C][C]40.7846396815455[/C][/ROW]
[ROW][C]23[/C][C]3110.52[/C][C]3108.8503895602[/C][C]1.66961043979904[/C][/ROW]
[ROW][C]24[/C][C]3013.24[/C][C]3053.14084719075[/C][C]-39.9008471907476[/C][/ROW]
[ROW][C]25[/C][C]2987.1[/C][C]2992.29622324266[/C][C]-5.19622324265982[/C][/ROW]
[ROW][C]26[/C][C]2995.55[/C][C]2991.40167168537[/C][C]4.14832831463412[/C][/ROW]
[ROW][C]27[/C][C]2833.18[/C][C]2838.5395809222[/C][C]-5.35958092219993[/C][/ROW]
[ROW][C]28[/C][C]2848.96[/C][C]2822.43426508417[/C][C]26.525734915829[/C][/ROW]
[ROW][C]29[/C][C]2794.83[/C][C]2770.96658376521[/C][C]23.8634162347896[/C][/ROW]
[ROW][C]30[/C][C]2845.26[/C][C]2946.40903365762[/C][C]-101.149033657624[/C][/ROW]
[ROW][C]31[/C][C]2915.02[/C][C]2976.75646767886[/C][C]-61.7364676788609[/C][/ROW]
[ROW][C]32[/C][C]2892.63[/C][C]2875.21723519701[/C][C]17.4127648029865[/C][/ROW]
[ROW][C]33[/C][C]2604.42[/C][C]2666.27251486875[/C][C]-61.8525148687522[/C][/ROW]
[ROW][C]34[/C][C]2641.65[/C][C]2543.32974539918[/C][C]98.3202546008187[/C][/ROW]
[ROW][C]35[/C][C]2659.81[/C][C]2687.91873151619[/C][C]-28.108731516187[/C][/ROW]
[ROW][C]36[/C][C]2638.53[/C][C]2673.66675380822[/C][C]-35.1367538082208[/C][/ROW]
[ROW][C]37[/C][C]2720.25[/C][C]2617.68200215537[/C][C]102.567997844628[/C][/ROW]
[ROW][C]38[/C][C]2745.88[/C][C]2765.8691425113[/C][C]-19.9891425113007[/C][/ROW]
[ROW][C]39[/C][C]2735.7[/C][C]2724.7809103895[/C][C]10.9190896105037[/C][/ROW]
[ROW][C]40[/C][C]2811.7[/C][C]2783.38943206206[/C][C]28.3105679379443[/C][/ROW]
[ROW][C]41[/C][C]2799.43[/C][C]2599.23415111802[/C][C]200.195848881977[/C][/ROW]
[ROW][C]42[/C][C]2555.28[/C][C]2509.62598128557[/C][C]45.6540187144348[/C][/ROW]
[ROW][C]43[/C][C]2304.98[/C][C]2189.60086527358[/C][C]115.379134726415[/C][/ROW]
[ROW][C]44[/C][C]2214.95[/C][C]2183.53270513478[/C][C]31.4172948652181[/C][/ROW]
[ROW][C]45[/C][C]2065.81[/C][C]2077.6287625119[/C][C]-11.818762511899[/C][/ROW]
[ROW][C]46[/C][C]1940.49[/C][C]1988.89881951509[/C][C]-48.4088195150879[/C][/ROW]
[ROW][C]47[/C][C]2042[/C][C]2163.2941132597[/C][C]-121.294113259704[/C][/ROW]
[ROW][C]48[/C][C]1995.37[/C][C]2041.95522304158[/C][C]-46.5852230415791[/C][/ROW]
[ROW][C]49[/C][C]1946.81[/C][C]2070.10023718413[/C][C]-123.290237184127[/C][/ROW]
[ROW][C]50[/C][C]1765.9[/C][C]1726.63667216474[/C][C]39.2633278352601[/C][/ROW]
[ROW][C]51[/C][C]1635.25[/C][C]1640.95007659043[/C][C]-5.70007659043152[/C][/ROW]
[/TABLE]
Source: https://freestatistics.org/blog/index.php?pk=105627&T=4

Globally Unique Identifier (entire table): ba.freestatistics.org/blog/index.php?pk=105627&T=4

As an alternative you can also use a QR Code:  

The GUIDs for individual cells are displayed in the table below:

Multiple Linear Regression - Actuals, Interpolation, and Residuals
Time or IndexActualsInterpolationForecastResidualsPrediction Error
13484.743411.0853048353973.6546951646108
23411.133350.1865529582960.9434470417099
33288.183328.13620403934-39.9562040393389
43280.373313.65826589738-33.2882658973784
53173.953276.21163982841-102.261639828406
63165.263101.8871885731863.372811426821
73092.713197.98333796861-105.273337968608
83053.053102.66451989766-49.6145198976608
93181.963052.95095077135129.009049228647
102999.933090.62607476728-90.6960747672763
113249.573101.83676566391147.733234336092
123210.523088.89717595945121.622824040547
133030.293078.02623258245-47.7362325824522
142803.472887.8359606803-84.3659606803034
152767.632727.5332280585340.0967719414666
162882.62904.14803695639-21.5480369563949
172863.362985.15762528836-121.79762528836
182897.062904.93779648363-7.8777964836316
193012.612960.9793290789551.6306709210538
203142.953142.165539770540.784460229456097
213032.933088.267771848-55.3377718479959
223045.783004.9953603184540.7846396815455
233110.523108.85038956021.66961043979904
243013.243053.14084719075-39.9008471907476
252987.12992.29622324266-5.19622324265982
262995.552991.401671685374.14832831463412
272833.182838.5395809222-5.35958092219993
282848.962822.4342650841726.525734915829
292794.832770.9665837652123.8634162347896
302845.262946.40903365762-101.149033657624
312915.022976.75646767886-61.7364676788609
322892.632875.2172351970117.4127648029865
332604.422666.27251486875-61.8525148687522
342641.652543.3297453991898.3202546008187
352659.812687.91873151619-28.108731516187
362638.532673.66675380822-35.1367538082208
372720.252617.68200215537102.567997844628
382745.882765.8691425113-19.9891425113007
392735.72724.780910389510.9190896105037
402811.72783.3894320620628.3105679379443
412799.432599.23415111802200.195848881977
422555.282509.6259812855745.6540187144348
432304.982189.60086527358115.379134726415
442214.952183.5327051347831.4172948652181
452065.812077.6287625119-11.818762511899
461940.491988.89881951509-48.4088195150879
4720422163.2941132597-121.294113259704
481995.372041.95522304158-46.5852230415791
491946.812070.10023718413-123.290237184127
501765.91726.6366721647439.2633278352601
511635.251640.95007659043-5.70007659043152


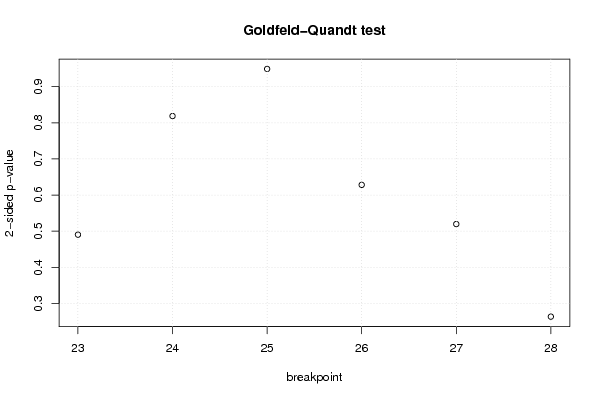
Goldfeld-Quandt test for Heteroskedasticity
p-valuesAlternative Hypothesis
breakpoint indexgreater2-sidedless
230.7548723230453580.4902553539092830.245127676954642
240.5906977225452580.8186045549094850.409302277454742
250.4744954636489020.9489909272978030.525504536351099
260.3140796191353050.6281592382706090.685920380864696
270.2597794499361760.5195588998723520.740220550063824
280.131683858124940.2633677162498790.86831614187506

\begin{tabular}{lllllllll}
\hline
Goldfeld-Quandt test for Heteroskedasticity \tabularnewline
p-values & Alternative Hypothesis \tabularnewline
breakpoint index & greater & 2-sided & less \tabularnewline
23 & 0.754872323045358 & 0.490255353909283 & 0.245127676954642 \tabularnewline
24 & 0.590697722545258 & 0.818604554909485 & 0.409302277454742 \tabularnewline
25 & 0.474495463648902 & 0.948990927297803 & 0.525504536351099 \tabularnewline
26 & 0.314079619135305 & 0.628159238270609 & 0.685920380864696 \tabularnewline
27 & 0.259779449936176 & 0.519558899872352 & 0.740220550063824 \tabularnewline
28 & 0.13168385812494 & 0.263367716249879 & 0.86831614187506 \tabularnewline
\hline
\end{tabular}
%Source: https://freestatistics.org/blog/index.php?pk=105627&T=5

[TABLE]
[ROW][C]Goldfeld-Quandt test for Heteroskedasticity[/C][/ROW]
[ROW][C]p-values[/C][C]Alternative Hypothesis[/C][/ROW]
[ROW][C]breakpoint index[/C][C]greater[/C][C]2-sided[/C][C]less[/C][/ROW]
[ROW][C]23[/C][C]0.754872323045358[/C][C]0.490255353909283[/C][C]0.245127676954642[/C][/ROW]
[ROW][C]24[/C][C]0.590697722545258[/C][C]0.818604554909485[/C][C]0.409302277454742[/C][/ROW]
[ROW][C]25[/C][C]0.474495463648902[/C][C]0.948990927297803[/C][C]0.525504536351099[/C][/ROW]
[ROW][C]26[/C][C]0.314079619135305[/C][C]0.628159238270609[/C][C]0.685920380864696[/C][/ROW]
[ROW][C]27[/C][C]0.259779449936176[/C][C]0.519558899872352[/C][C]0.740220550063824[/C][/ROW]
[ROW][C]28[/C][C]0.13168385812494[/C][C]0.263367716249879[/C][C]0.86831614187506[/C][/ROW]
[/TABLE]
Source: https://freestatistics.org/blog/index.php?pk=105627&T=5

Globally Unique Identifier (entire table): ba.freestatistics.org/blog/index.php?pk=105627&T=5

As an alternative you can also use a QR Code:  

The GUIDs for individual cells are displayed in the table below:

Goldfeld-Quandt test for Heteroskedasticity
p-valuesAlternative Hypothesis
breakpoint indexgreater2-sidedless
230.7548723230453580.4902553539092830.245127676954642
240.5906977225452580.8186045549094850.409302277454742
250.4744954636489020.9489909272978030.525504536351099
260.3140796191353050.6281592382706090.685920380864696
270.2597794499361760.5195588998723520.740220550063824
280.131683858124940.2633677162498790.86831614187506


Meta Analysis of Goldfeld-Quandt test for Heteroskedasticity
Description# significant tests% significant testsOK/NOK
1% type I error level00OK
5% type I error level00OK
10% type I error level00OK

\begin{tabular}{lllllllll}
\hline
Meta Analysis of Goldfeld-Quandt test for Heteroskedasticity \tabularnewline
Description & # significant tests & % significant tests & OK/NOK \tabularnewline
1% type I error level & 0 & 0 & OK \tabularnewline
5% type I error level & 0 & 0 & OK \tabularnewline
10% type I error level & 0 & 0 & OK \tabularnewline
\hline
\end{tabular}
%Source: https://freestatistics.org/blog/index.php?pk=105627&T=6

[TABLE]
[ROW][C]Meta Analysis of Goldfeld-Quandt test for Heteroskedasticity[/C][/ROW]
[ROW][C]Description[/C][C]# significant tests[/C][C]% significant tests[/C][C]OK/NOK[/C][/ROW]
[ROW][C]1% type I error level[/C][C]0[/C][C]0[/C][C]OK[/C][/ROW]
[ROW][C]5% type I error level[/C][C]0[/C][C]0[/C][C]OK[/C][/ROW]
[ROW][C]10% type I error level[/C][C]0[/C][C]0[/C][C]OK[/C][/ROW]
[/TABLE]
Source: https://freestatistics.org/blog/index.php?pk=105627&T=6

Globally Unique Identifier (entire table): ba.freestatistics.org/blog/index.php?pk=105627&T=6

As an alternative you can also use a QR Code:  

The GUIDs for individual cells are displayed in the table below:

Meta Analysis of Goldfeld-Quandt test for Heteroskedasticity
Description# significant tests% significant testsOK/NOK
1% type I error level00OK
5% type I error level00OK
10% type I error level00OK


Parameters (Session):
par1 = 1 ; par2 = Include Monthly Dummies ; par3 = Linear Trend ;
Parameters (R input):
par1 = 1 ; par2 = Include Monthly Dummies ; par3 = Linear Trend ;
R code (references can be found in the software module):
library(lattice)
library(lmtest)
n25 <- 25 #minimum number of obs. for Goldfeld-Quandt test
par1 <- as.numeric(par1)
x <- t(y)
k <- length(x[1,])
n <- length(x[,1])
x1 <- cbind(x[,par1], x[,1:k!=par1])
mycolnames <- c(colnames(x)[par1], colnames(x)[1:k!=par1])
colnames(x1) <- mycolnames #colnames(x)[par1]
x <- x1
if (par3 == 'First Differences'){
x2 <- array(0, dim=c(n-1,k), dimnames=list(1:(n-1), paste('(1-B)',colnames(x),sep='')))
for (i in 1:n-1) {
for (j in 1:k) {
x2[i,j] <- x[i+1,j] - x[i,j]
}
}
x <- x2
}
if (par2 == 'Include Monthly Dummies'){
x2 <- array(0, dim=c(n,11), dimnames=list(1:n, paste('M', seq(1:11), sep ='')))
for (i in 1:11){
x2[seq(i,n,12),i] <- 1
}
x <- cbind(x, x2)
}
if (par2 == 'Include Quarterly Dummies'){
x2 <- array(0, dim=c(n,3), dimnames=list(1:n, paste('Q', seq(1:3), sep ='')))
for (i in 1:3){
x2[seq(i,n,4),i] <- 1
}
x <- cbind(x, x2)
}
k <- length(x[1,])
if (par3 == 'Linear Trend'){
x <- cbind(x, c(1:n))
colnames(x)[k+1] <- 't'
}
x
k <- length(x[1,])
df <- as.data.frame(x)
(mylm <- lm(df))
(mysum <- summary(mylm))
if (n > n25) {
kp3 <- k + 3
nmkm3 <- n - k - 3
gqarr <- array(NA, dim=c(nmkm3-kp3+1,3))
numgqtests <- 0
numsignificant1 <- 0
numsignificant5 <- 0
numsignificant10 <- 0
for (mypoint in kp3:nmkm3) {
j <- 0
numgqtests <- numgqtests + 1
for (myalt in c('greater', 'two.sided', 'less')) {
j <- j + 1
gqarr[mypoint-kp3+1,j] <- gqtest(mylm, point=mypoint, alternative=myalt)$p.value
}
if (gqarr[mypoint-kp3+1,2] < 0.01) numsignificant1 <- numsignificant1 + 1
if (gqarr[mypoint-kp3+1,2] < 0.05) numsignificant5 <- numsignificant5 + 1
if (gqarr[mypoint-kp3+1,2] < 0.10) numsignificant10 <- numsignificant10 + 1
}
gqarr
}
bitmap(file='test0.png')
plot(x[,1], type='l', main='Actuals and Interpolation', ylab='value of Actuals and Interpolation (dots)', xlab='time or index')
points(x[,1]-mysum$resid)
grid()
dev.off()
bitmap(file='test1.png')
plot(mysum$resid, type='b', pch=19, main='Residuals', ylab='value of Residuals', xlab='time or index')
grid()
dev.off()
bitmap(file='test2.png')
hist(mysum$resid, main='Residual Histogram', xlab='values of Residuals')
grid()
dev.off()
bitmap(file='test3.png')
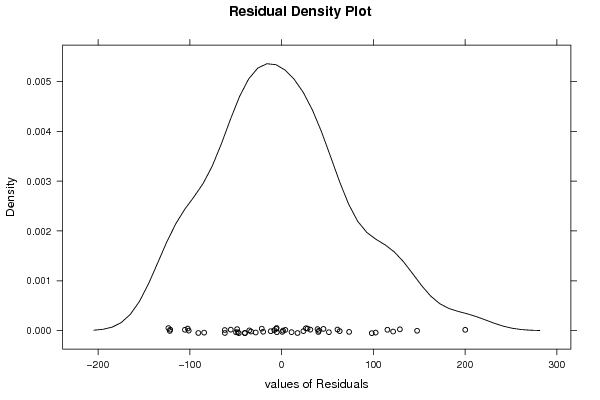
densityplot(~mysum$resid,col='black',main='Residual Density Plot', xlab='values of Residuals')
dev.off()
bitmap(file='test4.png')
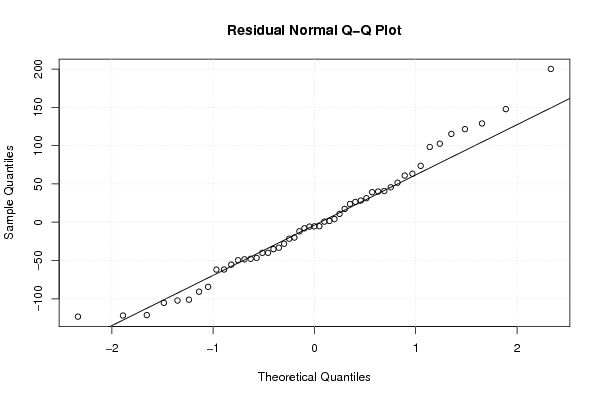
qqnorm(mysum$resid, main='Residual Normal Q-Q Plot')
qqline(mysum$resid)
grid()
dev.off()
(myerror <- as.ts(mysum$resid))
bitmap(file='test5.png')
dum <- cbind(lag(myerror,k=1),myerror)
dum
dum1 <- dum[2:length(myerror),]
dum1
z <- as.data.frame(dum1)
z
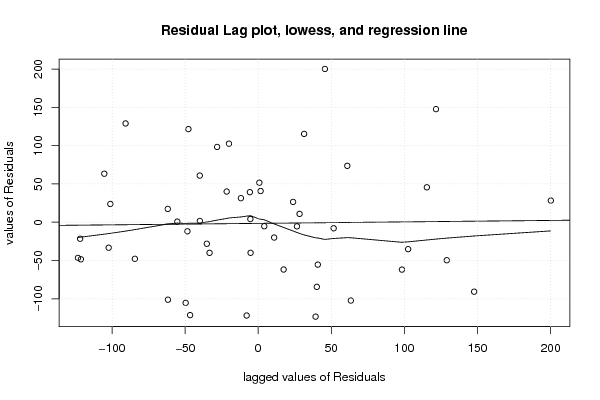
plot(z,main=paste('Residual Lag plot, lowess, and regression line'), ylab='values of Residuals', xlab='lagged values of Residuals')
lines(lowess(z))
abline(lm(z))
grid()
dev.off()
bitmap(file='test6.png')
acf(mysum$resid, lag.max=length(mysum$resid)/2, main='Residual Autocorrelation Function')
grid()
dev.off()
bitmap(file='test7.png')
pacf(mysum$resid, lag.max=length(mysum$resid)/2, main='Residual Partial Autocorrelation Function')
grid()
dev.off()
bitmap(file='test8.png')
opar <- par(mfrow = c(2,2), oma = c(0, 0, 1.1, 0))
plot(mylm, las = 1, sub='Residual Diagnostics')
par(opar)
dev.off()
if (n > n25) {
bitmap(file='test9.png')
plot(kp3:nmkm3,gqarr[,2], main='Goldfeld-Quandt test',ylab='2-sided p-value',xlab='breakpoint')
grid()
dev.off()
}
load(file='createtable')
a<-table.start()
a<-table.row.start(a)
a<-table.element(a, 'Multiple Linear Regression - Estimated Regression Equation', 1, TRUE)
a<-table.row.end(a)
myeq <- colnames(x)[1]
myeq <- paste(myeq, '[t] = ', sep='')
for (i in 1:k){
if (mysum$coefficients[i,1] > 0) myeq <- paste(myeq, '+', '')
myeq <- paste(myeq, mysum$coefficients[i,1], sep=' ')
if (rownames(mysum$coefficients)[i] != '(Intercept)') {
myeq <- paste(myeq, rownames(mysum$coefficients)[i], sep='')
if (rownames(mysum$coefficients)[i] != 't') myeq <- paste(myeq, '[t]', sep='')
}
}
myeq <- paste(myeq, ' + e[t]')
a<-table.row.start(a)
a<-table.element(a, myeq)
a<-table.row.end(a)
a<-table.end(a)
table.save(a,file='mytable1.tab')
a<-table.start()
a<-table.row.start(a)
a<-table.element(a,hyperlink('ols1.htm','Multiple Linear Regression - Ordinary Least Squares',''), 6, TRUE)
a<-table.row.end(a)
a<-table.row.start(a)
a<-table.element(a,'Variable',header=TRUE)
a<-table.element(a,'Parameter',header=TRUE)
a<-table.element(a,'S.D.',header=TRUE)
a<-table.element(a,'T-STAT
H0: parameter = 0',header=TRUE)
a<-table.element(a,'2-tail p-value',header=TRUE)
a<-table.element(a,'1-tail p-value',header=TRUE)
a<-table.row.end(a)
for (i in 1:k){
a<-table.row.start(a)
a<-table.element(a,rownames(mysum$coefficients)[i],header=TRUE)
a<-table.element(a,mysum$coefficients[i,1])
a<-table.element(a, round(mysum$coefficients[i,2],6))
a<-table.element(a, round(mysum$coefficients[i,3],4))
a<-table.element(a, round(mysum$coefficients[i,4],6))
a<-table.element(a, round(mysum$coefficients[i,4]/2,6))
a<-table.row.end(a)
}
a<-table.end(a)
table.save(a,file='mytable2.tab')
a<-table.start()
a<-table.row.start(a)
a<-table.element(a, 'Multiple Linear Regression - Regression Statistics', 2, TRUE)
a<-table.row.end(a)
a<-table.row.start(a)
a<-table.element(a, 'Multiple R',1,TRUE)
a<-table.element(a, sqrt(mysum$r.squared))
a<-table.row.end(a)
a<-table.row.start(a)
a<-table.element(a, 'R-squared',1,TRUE)
a<-table.element(a, mysum$r.squared)
a<-table.row.end(a)
a<-table.row.start(a)
a<-table.element(a, 'Adjusted R-squared',1,TRUE)
a<-table.element(a, mysum$adj.r.squared)
a<-table.row.end(a)
a<-table.row.start(a)
a<-table.element(a, 'F-TEST (value)',1,TRUE)
a<-table.element(a, mysum$fstatistic[1])
a<-table.row.end(a)
a<-table.row.start(a)
a<-table.element(a, 'F-TEST (DF numerator)',1,TRUE)
a<-table.element(a, mysum$fstatistic[2])
a<-table.row.end(a)
a<-table.row.start(a)
a<-table.element(a, 'F-TEST (DF denominator)',1,TRUE)
a<-table.element(a, mysum$fstatistic[3])
a<-table.row.end(a)
a<-table.row.start(a)
a<-table.element(a, 'p-value',1,TRUE)
a<-table.element(a, 1-pf(mysum$fstatistic[1],mysum$fstatistic[2],mysum$fstatistic[3]))
a<-table.row.end(a)
a<-table.row.start(a)
a<-table.element(a, 'Multiple Linear Regression - Residual Statistics', 2, TRUE)
a<-table.row.end(a)
a<-table.row.start(a)
a<-table.element(a, 'Residual Standard Deviation',1,TRUE)
a<-table.element(a, mysum$sigma)
a<-table.row.end(a)
a<-table.row.start(a)
a<-table.element(a, 'Sum Squared Residuals',1,TRUE)
a<-table.element(a, sum(myerror*myerror))
a<-table.row.end(a)
a<-table.end(a)
table.save(a,file='mytable3.tab')
a<-table.start()
a<-table.row.start(a)
a<-table.element(a, 'Multiple Linear Regression - Actuals, Interpolation, and Residuals', 4, TRUE)
a<-table.row.end(a)
a<-table.row.start(a)
a<-table.element(a, 'Time or Index', 1, TRUE)
a<-table.element(a, 'Actuals', 1, TRUE)
a<-table.element(a, 'Interpolation
Forecast', 1, TRUE)
a<-table.element(a, 'Residuals
Prediction Error', 1, TRUE)
a<-table.row.end(a)
for (i in 1:n) {
a<-table.row.start(a)
a<-table.element(a,i, 1, TRUE)
a<-table.element(a,x[i])
a<-table.element(a,x[i]-mysum$resid[i])
a<-table.element(a,mysum$resid[i])
a<-table.row.end(a)
}
a<-table.end(a)
table.save(a,file='mytable4.tab')
if (n > n25) {
a<-table.start()
a<-table.row.start(a)
a<-table.element(a,'Goldfeld-Quandt test for Heteroskedasticity',4,TRUE)
a<-table.row.end(a)
a<-table.row.start(a)
a<-table.element(a,'p-values',header=TRUE)
a<-table.element(a,'Alternative Hypothesis',3,header=TRUE)
a<-table.row.end(a)
a<-table.row.start(a)
a<-table.element(a,'breakpoint index',header=TRUE)
a<-table.element(a,'greater',header=TRUE)
a<-table.element(a,'2-sided',header=TRUE)
a<-table.element(a,'less',header=TRUE)
a<-table.row.end(a)
for (mypoint in kp3:nmkm3) {
a<-table.row.start(a)
a<-table.element(a,mypoint,header=TRUE)
a<-table.element(a,gqarr[mypoint-kp3+1,1])
a<-table.element(a,gqarr[mypoint-kp3+1,2])
a<-table.element(a,gqarr[mypoint-kp3+1,3])
a<-table.row.end(a)
}
a<-table.end(a)
table.save(a,file='mytable5.tab')
a<-table.start()
a<-table.row.start(a)
a<-table.element(a,'Meta Analysis of Goldfeld-Quandt test for Heteroskedasticity',4,TRUE)
a<-table.row.end(a)
a<-table.row.start(a)
a<-table.element(a,'Description',header=TRUE)
a<-table.element(a,'# significant tests',header=TRUE)
a<-table.element(a,'% significant tests',header=TRUE)
a<-table.element(a,'OK/NOK',header=TRUE)
a<-table.row.end(a)
a<-table.row.start(a)
a<-table.element(a,'1% type I error level',header=TRUE)
a<-table.element(a,numsignificant1)
a<-table.element(a,numsignificant1/numgqtests)
if (numsignificant1/numgqtests < 0.01) dum <- 'OK' else dum <- 'NOK'
a<-table.element(a,dum)
a<-table.row.end(a)
a<-table.row.start(a)
a<-table.element(a,'5% type I error level',header=TRUE)
a<-table.element(a,numsignificant5)
a<-table.element(a,numsignificant5/numgqtests)
if (numsignificant5/numgqtests < 0.05) dum <- 'OK' else dum <- 'NOK'
a<-table.element(a,dum)
a<-table.row.end(a)
a<-table.row.start(a)
a<-table.element(a,'10% type I error level',header=TRUE)
a<-table.element(a,numsignificant10)
a<-table.element(a,numsignificant10/numgqtests)
if (numsignificant10/numgqtests < 0.1) dum <- 'OK' else dum <- 'NOK'
a<-table.element(a,dum)
a<-table.row.end(a)
a<-table.end(a)
table.save(a,file='mytable6.tab')
}