Free Statistics

of Irreproducible Research!

Author's title

Author*The author of this computation has been verified*
R Software Modulerwasp_multipleregression.wasp
Title produced by softwareMultiple Regression
Date of computationMon, 06 Dec 2010 14:48:47 +0000
Cite this page as followsStatistical Computations at FreeStatistics.org, Office for Research Development and Education, URL https://freestatistics.org/blog/index.php?v=date/2010/Dec/06/t1291646802gwkx0tk9bv46dhf.htm/, Retrieved Sun, 28 Apr 2024 23:28:52 +0000
Statistical Computations at FreeStatistics.org, Office for Research Development and Education, URL https://freestatistics.org/blog/index.php?pk=105625, Retrieved Sun, 28 Apr 2024 23:28:52 +0000
QR Codes:

Original text written by user:
IsPrivate?No (this computation is public)
User-defined keywords
Estimated Impact187
Family? (F = Feedback message, R = changed R code, M = changed R Module, P = changed Parameters, D = changed Data)
-       [Multiple Regression] [] [2010-12-06 14:48:47] [c474a97a96075919a678ad3d2290b00b] [Current]
Feedback Forum

Post a new message
Dataseries X:
3484.74	13830.14	9349.44	7977	-5.6	6	1	2.77
3411.13	14153.22	9327.78	8241	-6.2	3	1	2.76
3288.18	15418.03	9753.63	8444	-7.1	2	1.2	2.76
3280.37	16666.97	10443.5	8490	-1.4	2	1.2	2.46
3173.95	16505.21	10853.87	8388	-0.1	2	0.8	2.46
3165.26	17135.96	10704.02	8099	-0.9	-8	0.7	2.47
3092.71	18033.25	11052.23	7984	0	0	0.7	2.71
3053.05	17671	10935.47	7786	0.1	-2	0.9	2.8
3181.96	17544.22	10714.03	8086	2.6	3	1.2	2.89
2999.93	17677.9	10394.48	9315	6	5	1.3	3.36
3249.57	18470.97	10817.9	9113	6.4	8	1.5	3.31
3210.52	18409.96	11251.2	9023	8.6	8	1.9	3.5
3030.29	18941.6	11281.26	9026	6.4	9	1.8	3.51
2803.47	19685.53	10539.68	9787	7.7	11	1.9	3.71
2767.63	19834.71	10483.39	9536	9.2	13	2.2	3.71
2882.6	19598.93	10947.43	9490	8.6	12	2.1	3.71
2863.36	17039.97	10580.27	9736	7.4	13	2.2	4.21
2897.06	16969.28	10582.92	9694	8.6	15	2.7	4.21
3012.61	16973.38	10654.41	9647	6.2	13	2.8	4.21
3142.95	16329.89	11014.51	9753	6	16	2.9	4.5
3032.93	16153.34	10967.87	10070	6.6	10	3.4	4.51
3045.78	15311.7	10433.56	10137	5.1	14	3	4.51
3110.52	14760.87	10665.78	9984	4.7	14	3.1	4.51
3013.24	14452.93	10666.71	9732	5	15	2.5	4.32
2987.1	13720.95	10682.74	9103	3.6	13	2.2	4.02
2995.55	13266.27	10777.22	9155	1.9	8	2.3	4.02
2833.18	12708.47	10052.6	9308	-0.1	7	2.1	3.85
2848.96	13411.84	10213.97	9394	-5.7	3	2.8	3.84
2794.83	13975.55	10546.82	9948	-5.6	3	3.1	4.02
2845.26	12974.89	10767.2	10177	-6.4	4	2.9	3.82
2915.02	12151.11	10444.5	10002	-7.7	4	2.6	3.75
2892.63	11576.21	10314.68	9728	-8	0	2.7	3.74
2604.42	9996.83	9042.56	10002	-11.9	-4	2.3	3.14
2641.65	10438.9	9220.75	10063	-15.4	-14	2.3	2.91
2659.81	10511.22	9721.84	10018	-15.5	-18	2.1	2.84
2638.53	10496.2	9978.53	9960	-13.4	-8	2.2	2.85
2720.25	10300.79	9923.81	10236	-10.9	-1	2.9	2.85
2745.88	9981.65	9892.56	10893	-10.8	1	2.6	3.08
2735.7	11448.79	10500.98	10756	-7.3	2	2.7	3.3
2811.7	11384.49	10179.35	10940	-6.5	0	1.8	3.29
2799.43	11717.46	10080.48	10997	-5.1	1	1.3	3.26
2555.28	10965.88	9492.44	10827	-5.3	0	0.9	3.26
2304.98	10352.27	8616.49	10166	-6.8	-1	1.3	3.11
2214.95	9751.2	8685.4	10186	-8.4	-3	1.3	2.84
2065.81	9354.01	8160.67	10457	-8.4	-3	1.3	2.71
1940.49	8792.5	8048.1	10368	-9.7	-3	1.3	2.69
2042	8721.14	8641.21	10244	-8.8	-4	1.1	2.65
1995.37	8692.94	8526.63	10511	-9.6	-8	1.4	2.57
1946.81	8570.73	8474.21	10812	-11.5	-9	1.2	2.32
1765.9	8538.47	7916.13	10738	-11	-13	1.7	2.12
1635.25	8169.75	7977.64	10171	-14.9	-18	1.8	2.05


Summary of computational transaction
Raw Inputview raw input (R code)
Raw Outputview raw output of R engine
Computing time7 seconds
R Server'George Udny Yule' @ 72.249.76.132

\begin{tabular}{lllllllll}
\hline
Summary of computational transaction \tabularnewline
Raw Input & view raw input (R code)  \tabularnewline
Raw Output & view raw output of R engine  \tabularnewline
Computing time & 7 seconds \tabularnewline
R Server & 'George Udny Yule' @ 72.249.76.132 \tabularnewline
\hline
\end{tabular}
%Source: https://freestatistics.org/blog/index.php?pk=105625&T=0

[TABLE]
[ROW][C]Summary of computational transaction[/C][/ROW]
[ROW][C]Raw Input[/C][C]view raw input (R code) [/C][/ROW]
[ROW][C]Raw Output[/C][C]view raw output of R engine [/C][/ROW]
[ROW][C]Computing time[/C][C]7 seconds[/C][/ROW]
[ROW][C]R Server[/C][C]'George Udny Yule' @ 72.249.76.132[/C][/ROW]
[/TABLE]
Source: https://freestatistics.org/blog/index.php?pk=105625&T=0

Globally Unique Identifier (entire table): ba.freestatistics.org/blog/index.php?pk=105625&T=0

As an alternative you can also use a QR Code:  

The GUIDs for individual cells are displayed in the table below:

Summary of computational transaction
Raw Inputview raw input (R code)
Raw Outputview raw output of R engine
Computing time7 seconds
R Server'George Udny Yule' @ 72.249.76.132


Multiple Linear Regression - Estimated Regression Equation
BEL_20[t] = + 623.189281438361 -0.0829840213057002Nikkei[t] + 0.265839363241114DJ_Indust[t] + 0.132169504408610Goudprijs[t] -13.1225855069165Conjunct_Seizoenzuiver[t] + 6.30504688723916Cons_vertrouw[t] -96.5668153338558Alg_consumptie_index_BE[t] + 146.912916190512Gem_rente_kasbon_1j[t] -38.0890581388965t + e[t]

\begin{tabular}{lllllllll}
\hline
Multiple Linear Regression - Estimated Regression Equation \tabularnewline
BEL_20[t] =  +  623.189281438361 -0.0829840213057002Nikkei[t] +  0.265839363241114DJ_Indust[t] +  0.132169504408610Goudprijs[t] -13.1225855069165Conjunct_Seizoenzuiver[t] +  6.30504688723916Cons_vertrouw[t] -96.5668153338558Alg_consumptie_index_BE[t] +  146.912916190512Gem_rente_kasbon_1j[t] -38.0890581388965t  + e[t] \tabularnewline
\hline
\end{tabular}
%Source: https://freestatistics.org/blog/index.php?pk=105625&T=1

[TABLE]
[ROW][C]Multiple Linear Regression - Estimated Regression Equation[/C][/ROW]
[ROW][C]BEL_20[t] =  +  623.189281438361 -0.0829840213057002Nikkei[t] +  0.265839363241114DJ_Indust[t] +  0.132169504408610Goudprijs[t] -13.1225855069165Conjunct_Seizoenzuiver[t] +  6.30504688723916Cons_vertrouw[t] -96.5668153338558Alg_consumptie_index_BE[t] +  146.912916190512Gem_rente_kasbon_1j[t] -38.0890581388965t  + e[t][/C][/ROW]
[/TABLE]
Source: https://freestatistics.org/blog/index.php?pk=105625&T=1

Globally Unique Identifier (entire table): ba.freestatistics.org/blog/index.php?pk=105625&T=1

As an alternative you can also use a QR Code:  

The GUIDs for individual cells are displayed in the table below:

Multiple Linear Regression - Estimated Regression Equation
BEL_20[t] = + 623.189281438361 -0.0829840213057002Nikkei[t] + 0.265839363241114DJ_Indust[t] + 0.132169504408610Goudprijs[t] -13.1225855069165Conjunct_Seizoenzuiver[t] + 6.30504688723916Cons_vertrouw[t] -96.5668153338558Alg_consumptie_index_BE[t] + 146.912916190512Gem_rente_kasbon_1j[t] -38.0890581388965t + e[t]


Multiple Linear Regression - Ordinary Least Squares
VariableParameterS.D.T-STATH0: parameter = 02-tail p-value1-tail p-value
(Intercept)623.189281438361412.1032041.51220.1379670.068984
Nikkei-0.08298402130570020.01802-4.6053.8e-051.9e-05
DJ_Indust0.2658393632411140.0290419.153800
Goudprijs0.1321695044086100.0393683.35730.0016810.000841
Conjunct_Seizoenzuiver-13.12258550691657.195252-1.82380.0753060.037653
Cons_vertrouw6.305046887239164.626491.36280.1802040.090102
Alg_consumptie_index_BE-96.566815333855834.504521-2.79870.0077160.003858
Gem_rente_kasbon_1j146.91291619051257.8951442.53760.0149630.007481
t-38.08905813889653.739189-10.186400

\begin{tabular}{lllllllll}
\hline
Multiple Linear Regression - Ordinary Least Squares \tabularnewline
Variable & Parameter & S.D. & T-STATH0: parameter = 0 & 2-tail p-value & 1-tail p-value \tabularnewline
(Intercept) & 623.189281438361 & 412.103204 & 1.5122 & 0.137967 & 0.068984 \tabularnewline
Nikkei & -0.0829840213057002 & 0.01802 & -4.605 & 3.8e-05 & 1.9e-05 \tabularnewline
DJ_Indust & 0.265839363241114 & 0.029041 & 9.1538 & 0 & 0 \tabularnewline
Goudprijs & 0.132169504408610 & 0.039368 & 3.3573 & 0.001681 & 0.000841 \tabularnewline
Conjunct_Seizoenzuiver & -13.1225855069165 & 7.195252 & -1.8238 & 0.075306 & 0.037653 \tabularnewline
Cons_vertrouw & 6.30504688723916 & 4.62649 & 1.3628 & 0.180204 & 0.090102 \tabularnewline
Alg_consumptie_index_BE & -96.5668153338558 & 34.504521 & -2.7987 & 0.007716 & 0.003858 \tabularnewline
Gem_rente_kasbon_1j & 146.912916190512 & 57.895144 & 2.5376 & 0.014963 & 0.007481 \tabularnewline
t & -38.0890581388965 & 3.739189 & -10.1864 & 0 & 0 \tabularnewline
\hline
\end{tabular}
%Source: https://freestatistics.org/blog/index.php?pk=105625&T=2

[TABLE]
[ROW][C]Multiple Linear Regression - Ordinary Least Squares[/C][/ROW]
[ROW][C]Variable[/C][C]Parameter[/C][C]S.D.[/C][C]T-STATH0: parameter = 0[/C][C]2-tail p-value[/C][C]1-tail p-value[/C][/ROW]
[ROW][C](Intercept)[/C][C]623.189281438361[/C][C]412.103204[/C][C]1.5122[/C][C]0.137967[/C][C]0.068984[/C][/ROW]
[ROW][C]Nikkei[/C][C]-0.0829840213057002[/C][C]0.01802[/C][C]-4.605[/C][C]3.8e-05[/C][C]1.9e-05[/C][/ROW]
[ROW][C]DJ_Indust[/C][C]0.265839363241114[/C][C]0.029041[/C][C]9.1538[/C][C]0[/C][C]0[/C][/ROW]
[ROW][C]Goudprijs[/C][C]0.132169504408610[/C][C]0.039368[/C][C]3.3573[/C][C]0.001681[/C][C]0.000841[/C][/ROW]
[ROW][C]Conjunct_Seizoenzuiver[/C][C]-13.1225855069165[/C][C]7.195252[/C][C]-1.8238[/C][C]0.075306[/C][C]0.037653[/C][/ROW]
[ROW][C]Cons_vertrouw[/C][C]6.30504688723916[/C][C]4.62649[/C][C]1.3628[/C][C]0.180204[/C][C]0.090102[/C][/ROW]
[ROW][C]Alg_consumptie_index_BE[/C][C]-96.5668153338558[/C][C]34.504521[/C][C]-2.7987[/C][C]0.007716[/C][C]0.003858[/C][/ROW]
[ROW][C]Gem_rente_kasbon_1j[/C][C]146.912916190512[/C][C]57.895144[/C][C]2.5376[/C][C]0.014963[/C][C]0.007481[/C][/ROW]
[ROW][C]t[/C][C]-38.0890581388965[/C][C]3.739189[/C][C]-10.1864[/C][C]0[/C][C]0[/C][/ROW]
[/TABLE]
Source: https://freestatistics.org/blog/index.php?pk=105625&T=2

Globally Unique Identifier (entire table): ba.freestatistics.org/blog/index.php?pk=105625&T=2

As an alternative you can also use a QR Code:  

The GUIDs for individual cells are displayed in the table below:

Multiple Linear Regression - Ordinary Least Squares
VariableParameterS.D.T-STATH0: parameter = 02-tail p-value1-tail p-value
(Intercept)623.189281438361412.1032041.51220.1379670.068984
Nikkei-0.08298402130570020.01802-4.6053.8e-051.9e-05
DJ_Indust0.2658393632411140.0290419.153800
Goudprijs0.1321695044086100.0393683.35730.0016810.000841
Conjunct_Seizoenzuiver-13.12258550691657.195252-1.82380.0753060.037653
Cons_vertrouw6.305046887239164.626491.36280.1802040.090102
Alg_consumptie_index_BE-96.566815333855834.504521-2.79870.0077160.003858
Gem_rente_kasbon_1j146.91291619051257.8951442.53760.0149630.007481
t-38.08905813889653.739189-10.186400


Multiple Linear Regression - Regression Statistics
Multiple R0.981850693082498
R-squared0.964030783506582
Adjusted R-squared0.957179504174502
F-TEST (value)140.708141761599
F-TEST (DF numerator)8
F-TEST (DF denominator)42
p-value0
Multiple Linear Regression - Residual Statistics
Residual Standard Deviation89.244763913917
Sum Squared Residuals334514.371214133

\begin{tabular}{lllllllll}
\hline
Multiple Linear Regression - Regression Statistics \tabularnewline
Multiple R & 0.981850693082498 \tabularnewline
R-squared & 0.964030783506582 \tabularnewline
Adjusted R-squared & 0.957179504174502 \tabularnewline
F-TEST (value) & 140.708141761599 \tabularnewline
F-TEST (DF numerator) & 8 \tabularnewline
F-TEST (DF denominator) & 42 \tabularnewline
p-value & 0 \tabularnewline
Multiple Linear Regression - Residual Statistics \tabularnewline
Residual Standard Deviation & 89.244763913917 \tabularnewline
Sum Squared Residuals & 334514.371214133 \tabularnewline
\hline
\end{tabular}
%Source: https://freestatistics.org/blog/index.php?pk=105625&T=3

[TABLE]
[ROW][C]Multiple Linear Regression - Regression Statistics[/C][/ROW]
[ROW][C]Multiple R[/C][C]0.981850693082498[/C][/ROW]
[ROW][C]R-squared[/C][C]0.964030783506582[/C][/ROW]
[ROW][C]Adjusted R-squared[/C][C]0.957179504174502[/C][/ROW]
[ROW][C]F-TEST (value)[/C][C]140.708141761599[/C][/ROW]
[ROW][C]F-TEST (DF numerator)[/C][C]8[/C][/ROW]
[ROW][C]F-TEST (DF denominator)[/C][C]42[/C][/ROW]
[ROW][C]p-value[/C][C]0[/C][/ROW]
[ROW][C]Multiple Linear Regression - Residual Statistics[/C][/ROW]
[ROW][C]Residual Standard Deviation[/C][C]89.244763913917[/C][/ROW]
[ROW][C]Sum Squared Residuals[/C][C]334514.371214133[/C][/ROW]
[/TABLE]
Source: https://freestatistics.org/blog/index.php?pk=105625&T=3

Globally Unique Identifier (entire table): ba.freestatistics.org/blog/index.php?pk=105625&T=3

As an alternative you can also use a QR Code:  

The GUIDs for individual cells are displayed in the table below:

Multiple Linear Regression - Regression Statistics
Multiple R0.981850693082498
R-squared0.964030783506582
Adjusted R-squared0.957179504174502
F-TEST (value)140.708141761599
F-TEST (DF numerator)8
F-TEST (DF denominator)42
p-value0
Multiple Linear Regression - Residual Statistics
Residual Standard Deviation89.244763913917
Sum Squared Residuals334514.371214133


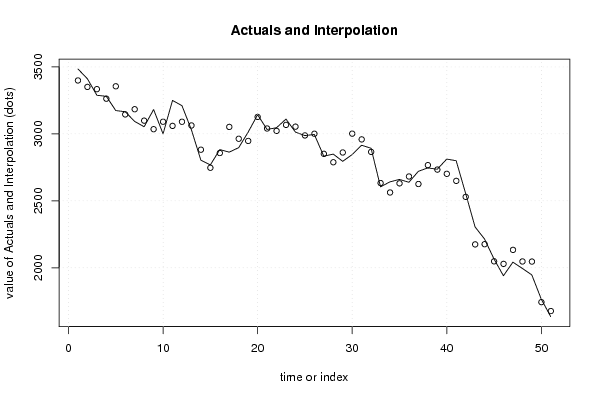
Multiple Linear Regression - Actuals, Interpolation, and Residuals
Time or IndexActualsInterpolationForecastResidualsPrediction Error
13484.743398.8836264831785.8563735168272
23411.133350.6080407774260.5219592225808
33288.183333.78998188425-45.609981884249
43280.373262.6606466511817.7093533488226
53173.953355.17365881682-181.223658816820
63165.263145.2828241120219.9771758879848
73092.713183.99061319034-91.2806131903363
83053.053098.7399979097-45.6899979096969
93181.963034.9259252443147.034074755697
102999.933090.61660765886-90.6866076588616
113249.573059.58597261872189.984027381280
123210.523090.26975014272120.250249857276
133030.293062.75125238686-32.4612523868644
142803.472881.64436346083-78.1743634608296
152767.632746.9932765740920.6367234259085
162882.62856.9756778445625.6243221554399
172863.363051.99945440042-188.639454400418
182897.062963.5094753543-66.4494753542997
193012.612947.1005020076965.5094979923125
203142.953126.637275834216.3127241658018
213032.933040.17992052018-7.24992052017943
223045.783022.2790526379023.5009473620975
233110.523067.0037183815443.5162816184595
243013.243053.80418161965-40.564181619646
252987.12988.24224979404-1.14224979404267
262995.553001.00016312287-5.45016312286636
272833.182851.06729829201-17.8872982920094
282848.962788.0752359068560.8847640931478
292794.832861.07581437834-66.2458143783382
302845.263001.61193750129-156.351937501293
312915.022958.71293227000-43.6929322700043
322892.632865.1964550436627.4335449563381
332604.422632.64244626349-28.2224462634878
342641.652562.3895074088479.260492591162
352659.812630.6823936123929.1276063876141
362638.532681.71771730455-43.1877173045495
372720.252625.5087137389194.7412862610935
382745.882766.48891100244-20.6089110024444
392735.72733.325596765842.37440323415940
402811.72701.7225280674109.977471932601
412799.432649.06185162075150.368148379246
422555.282529.4951256527125.7848743472864
432304.982174.81502799308130.164972006921
442214.952176.2871118146738.6628881853331
452065.812048.3838446146417.4261553853613
461940.492029.32362410187-88.8336241018684
4720422133.7607444843-91.7607444843025
481995.372047.39602214434-52.0260221443377
491946.812046.50916225015-99.6991622501483
501765.91743.5095222672922.3904777327094
511635.251677.14226607157-41.8922660715677

\begin{tabular}{lllllllll}
\hline
Multiple Linear Regression - Actuals, Interpolation, and Residuals \tabularnewline
Time or Index & Actuals & InterpolationForecast & ResidualsPrediction Error \tabularnewline
1 & 3484.74 & 3398.88362648317 & 85.8563735168272 \tabularnewline
2 & 3411.13 & 3350.60804077742 & 60.5219592225808 \tabularnewline
3 & 3288.18 & 3333.78998188425 & -45.609981884249 \tabularnewline
4 & 3280.37 & 3262.66064665118 & 17.7093533488226 \tabularnewline
5 & 3173.95 & 3355.17365881682 & -181.223658816820 \tabularnewline
6 & 3165.26 & 3145.28282411202 & 19.9771758879848 \tabularnewline
7 & 3092.71 & 3183.99061319034 & -91.2806131903363 \tabularnewline
8 & 3053.05 & 3098.7399979097 & -45.6899979096969 \tabularnewline
9 & 3181.96 & 3034.9259252443 & 147.034074755697 \tabularnewline
10 & 2999.93 & 3090.61660765886 & -90.6866076588616 \tabularnewline
11 & 3249.57 & 3059.58597261872 & 189.984027381280 \tabularnewline
12 & 3210.52 & 3090.26975014272 & 120.250249857276 \tabularnewline
13 & 3030.29 & 3062.75125238686 & -32.4612523868644 \tabularnewline
14 & 2803.47 & 2881.64436346083 & -78.1743634608296 \tabularnewline
15 & 2767.63 & 2746.99327657409 & 20.6367234259085 \tabularnewline
16 & 2882.6 & 2856.97567784456 & 25.6243221554399 \tabularnewline
17 & 2863.36 & 3051.99945440042 & -188.639454400418 \tabularnewline
18 & 2897.06 & 2963.5094753543 & -66.4494753542997 \tabularnewline
19 & 3012.61 & 2947.10050200769 & 65.5094979923125 \tabularnewline
20 & 3142.95 & 3126.6372758342 & 16.3127241658018 \tabularnewline
21 & 3032.93 & 3040.17992052018 & -7.24992052017943 \tabularnewline
22 & 3045.78 & 3022.27905263790 & 23.5009473620975 \tabularnewline
23 & 3110.52 & 3067.00371838154 & 43.5162816184595 \tabularnewline
24 & 3013.24 & 3053.80418161965 & -40.564181619646 \tabularnewline
25 & 2987.1 & 2988.24224979404 & -1.14224979404267 \tabularnewline
26 & 2995.55 & 3001.00016312287 & -5.45016312286636 \tabularnewline
27 & 2833.18 & 2851.06729829201 & -17.8872982920094 \tabularnewline
28 & 2848.96 & 2788.07523590685 & 60.8847640931478 \tabularnewline
29 & 2794.83 & 2861.07581437834 & -66.2458143783382 \tabularnewline
30 & 2845.26 & 3001.61193750129 & -156.351937501293 \tabularnewline
31 & 2915.02 & 2958.71293227000 & -43.6929322700043 \tabularnewline
32 & 2892.63 & 2865.19645504366 & 27.4335449563381 \tabularnewline
33 & 2604.42 & 2632.64244626349 & -28.2224462634878 \tabularnewline
34 & 2641.65 & 2562.38950740884 & 79.260492591162 \tabularnewline
35 & 2659.81 & 2630.68239361239 & 29.1276063876141 \tabularnewline
36 & 2638.53 & 2681.71771730455 & -43.1877173045495 \tabularnewline
37 & 2720.25 & 2625.50871373891 & 94.7412862610935 \tabularnewline
38 & 2745.88 & 2766.48891100244 & -20.6089110024444 \tabularnewline
39 & 2735.7 & 2733.32559676584 & 2.37440323415940 \tabularnewline
40 & 2811.7 & 2701.7225280674 & 109.977471932601 \tabularnewline
41 & 2799.43 & 2649.06185162075 & 150.368148379246 \tabularnewline
42 & 2555.28 & 2529.49512565271 & 25.7848743472864 \tabularnewline
43 & 2304.98 & 2174.81502799308 & 130.164972006921 \tabularnewline
44 & 2214.95 & 2176.28711181467 & 38.6628881853331 \tabularnewline
45 & 2065.81 & 2048.38384461464 & 17.4261553853613 \tabularnewline
46 & 1940.49 & 2029.32362410187 & -88.8336241018684 \tabularnewline
47 & 2042 & 2133.7607444843 & -91.7607444843025 \tabularnewline
48 & 1995.37 & 2047.39602214434 & -52.0260221443377 \tabularnewline
49 & 1946.81 & 2046.50916225015 & -99.6991622501483 \tabularnewline
50 & 1765.9 & 1743.50952226729 & 22.3904777327094 \tabularnewline
51 & 1635.25 & 1677.14226607157 & -41.8922660715677 \tabularnewline
\hline
\end{tabular}
%Source: https://freestatistics.org/blog/index.php?pk=105625&T=4

[TABLE]
[ROW][C]Multiple Linear Regression - Actuals, Interpolation, and Residuals[/C][/ROW]
[ROW][C]Time or Index[/C][C]Actuals[/C][C]InterpolationForecast[/C][C]ResidualsPrediction Error[/C][/ROW]
[ROW][C]1[/C][C]3484.74[/C][C]3398.88362648317[/C][C]85.8563735168272[/C][/ROW]
[ROW][C]2[/C][C]3411.13[/C][C]3350.60804077742[/C][C]60.5219592225808[/C][/ROW]
[ROW][C]3[/C][C]3288.18[/C][C]3333.78998188425[/C][C]-45.609981884249[/C][/ROW]
[ROW][C]4[/C][C]3280.37[/C][C]3262.66064665118[/C][C]17.7093533488226[/C][/ROW]
[ROW][C]5[/C][C]3173.95[/C][C]3355.17365881682[/C][C]-181.223658816820[/C][/ROW]
[ROW][C]6[/C][C]3165.26[/C][C]3145.28282411202[/C][C]19.9771758879848[/C][/ROW]
[ROW][C]7[/C][C]3092.71[/C][C]3183.99061319034[/C][C]-91.2806131903363[/C][/ROW]
[ROW][C]8[/C][C]3053.05[/C][C]3098.7399979097[/C][C]-45.6899979096969[/C][/ROW]
[ROW][C]9[/C][C]3181.96[/C][C]3034.9259252443[/C][C]147.034074755697[/C][/ROW]
[ROW][C]10[/C][C]2999.93[/C][C]3090.61660765886[/C][C]-90.6866076588616[/C][/ROW]
[ROW][C]11[/C][C]3249.57[/C][C]3059.58597261872[/C][C]189.984027381280[/C][/ROW]
[ROW][C]12[/C][C]3210.52[/C][C]3090.26975014272[/C][C]120.250249857276[/C][/ROW]
[ROW][C]13[/C][C]3030.29[/C][C]3062.75125238686[/C][C]-32.4612523868644[/C][/ROW]
[ROW][C]14[/C][C]2803.47[/C][C]2881.64436346083[/C][C]-78.1743634608296[/C][/ROW]
[ROW][C]15[/C][C]2767.63[/C][C]2746.99327657409[/C][C]20.6367234259085[/C][/ROW]
[ROW][C]16[/C][C]2882.6[/C][C]2856.97567784456[/C][C]25.6243221554399[/C][/ROW]
[ROW][C]17[/C][C]2863.36[/C][C]3051.99945440042[/C][C]-188.639454400418[/C][/ROW]
[ROW][C]18[/C][C]2897.06[/C][C]2963.5094753543[/C][C]-66.4494753542997[/C][/ROW]
[ROW][C]19[/C][C]3012.61[/C][C]2947.10050200769[/C][C]65.5094979923125[/C][/ROW]
[ROW][C]20[/C][C]3142.95[/C][C]3126.6372758342[/C][C]16.3127241658018[/C][/ROW]
[ROW][C]21[/C][C]3032.93[/C][C]3040.17992052018[/C][C]-7.24992052017943[/C][/ROW]
[ROW][C]22[/C][C]3045.78[/C][C]3022.27905263790[/C][C]23.5009473620975[/C][/ROW]
[ROW][C]23[/C][C]3110.52[/C][C]3067.00371838154[/C][C]43.5162816184595[/C][/ROW]
[ROW][C]24[/C][C]3013.24[/C][C]3053.80418161965[/C][C]-40.564181619646[/C][/ROW]
[ROW][C]25[/C][C]2987.1[/C][C]2988.24224979404[/C][C]-1.14224979404267[/C][/ROW]
[ROW][C]26[/C][C]2995.55[/C][C]3001.00016312287[/C][C]-5.45016312286636[/C][/ROW]
[ROW][C]27[/C][C]2833.18[/C][C]2851.06729829201[/C][C]-17.8872982920094[/C][/ROW]
[ROW][C]28[/C][C]2848.96[/C][C]2788.07523590685[/C][C]60.8847640931478[/C][/ROW]
[ROW][C]29[/C][C]2794.83[/C][C]2861.07581437834[/C][C]-66.2458143783382[/C][/ROW]
[ROW][C]30[/C][C]2845.26[/C][C]3001.61193750129[/C][C]-156.351937501293[/C][/ROW]
[ROW][C]31[/C][C]2915.02[/C][C]2958.71293227000[/C][C]-43.6929322700043[/C][/ROW]
[ROW][C]32[/C][C]2892.63[/C][C]2865.19645504366[/C][C]27.4335449563381[/C][/ROW]
[ROW][C]33[/C][C]2604.42[/C][C]2632.64244626349[/C][C]-28.2224462634878[/C][/ROW]
[ROW][C]34[/C][C]2641.65[/C][C]2562.38950740884[/C][C]79.260492591162[/C][/ROW]
[ROW][C]35[/C][C]2659.81[/C][C]2630.68239361239[/C][C]29.1276063876141[/C][/ROW]
[ROW][C]36[/C][C]2638.53[/C][C]2681.71771730455[/C][C]-43.1877173045495[/C][/ROW]
[ROW][C]37[/C][C]2720.25[/C][C]2625.50871373891[/C][C]94.7412862610935[/C][/ROW]
[ROW][C]38[/C][C]2745.88[/C][C]2766.48891100244[/C][C]-20.6089110024444[/C][/ROW]
[ROW][C]39[/C][C]2735.7[/C][C]2733.32559676584[/C][C]2.37440323415940[/C][/ROW]
[ROW][C]40[/C][C]2811.7[/C][C]2701.7225280674[/C][C]109.977471932601[/C][/ROW]
[ROW][C]41[/C][C]2799.43[/C][C]2649.06185162075[/C][C]150.368148379246[/C][/ROW]
[ROW][C]42[/C][C]2555.28[/C][C]2529.49512565271[/C][C]25.7848743472864[/C][/ROW]
[ROW][C]43[/C][C]2304.98[/C][C]2174.81502799308[/C][C]130.164972006921[/C][/ROW]
[ROW][C]44[/C][C]2214.95[/C][C]2176.28711181467[/C][C]38.6628881853331[/C][/ROW]
[ROW][C]45[/C][C]2065.81[/C][C]2048.38384461464[/C][C]17.4261553853613[/C][/ROW]
[ROW][C]46[/C][C]1940.49[/C][C]2029.32362410187[/C][C]-88.8336241018684[/C][/ROW]
[ROW][C]47[/C][C]2042[/C][C]2133.7607444843[/C][C]-91.7607444843025[/C][/ROW]
[ROW][C]48[/C][C]1995.37[/C][C]2047.39602214434[/C][C]-52.0260221443377[/C][/ROW]
[ROW][C]49[/C][C]1946.81[/C][C]2046.50916225015[/C][C]-99.6991622501483[/C][/ROW]
[ROW][C]50[/C][C]1765.9[/C][C]1743.50952226729[/C][C]22.3904777327094[/C][/ROW]
[ROW][C]51[/C][C]1635.25[/C][C]1677.14226607157[/C][C]-41.8922660715677[/C][/ROW]
[/TABLE]
Source: https://freestatistics.org/blog/index.php?pk=105625&T=4

Globally Unique Identifier (entire table): ba.freestatistics.org/blog/index.php?pk=105625&T=4

As an alternative you can also use a QR Code:  

The GUIDs for individual cells are displayed in the table below:

Multiple Linear Regression - Actuals, Interpolation, and Residuals
Time or IndexActualsInterpolationForecastResidualsPrediction Error
13484.743398.8836264831785.8563735168272
23411.133350.6080407774260.5219592225808
33288.183333.78998188425-45.609981884249
43280.373262.6606466511817.7093533488226
53173.953355.17365881682-181.223658816820
63165.263145.2828241120219.9771758879848
73092.713183.99061319034-91.2806131903363
83053.053098.7399979097-45.6899979096969
93181.963034.9259252443147.034074755697
102999.933090.61660765886-90.6866076588616
113249.573059.58597261872189.984027381280
123210.523090.26975014272120.250249857276
133030.293062.75125238686-32.4612523868644
142803.472881.64436346083-78.1743634608296
152767.632746.9932765740920.6367234259085
162882.62856.9756778445625.6243221554399
172863.363051.99945440042-188.639454400418
182897.062963.5094753543-66.4494753542997
193012.612947.1005020076965.5094979923125
203142.953126.637275834216.3127241658018
213032.933040.17992052018-7.24992052017943
223045.783022.2790526379023.5009473620975
233110.523067.0037183815443.5162816184595
243013.243053.80418161965-40.564181619646
252987.12988.24224979404-1.14224979404267
262995.553001.00016312287-5.45016312286636
272833.182851.06729829201-17.8872982920094
282848.962788.0752359068560.8847640931478
292794.832861.07581437834-66.2458143783382
302845.263001.61193750129-156.351937501293
312915.022958.71293227000-43.6929322700043
322892.632865.1964550436627.4335449563381
332604.422632.64244626349-28.2224462634878
342641.652562.3895074088479.260492591162
352659.812630.6823936123929.1276063876141
362638.532681.71771730455-43.1877173045495
372720.252625.5087137389194.7412862610935
382745.882766.48891100244-20.6089110024444
392735.72733.325596765842.37440323415940
402811.72701.7225280674109.977471932601
412799.432649.06185162075150.368148379246
422555.282529.4951256527125.7848743472864
432304.982174.81502799308130.164972006921
442214.952176.2871118146738.6628881853331
452065.812048.3838446146417.4261553853613
461940.492029.32362410187-88.8336241018684
4720422133.7607444843-91.7607444843025
481995.372047.39602214434-52.0260221443377
491946.812046.50916225015-99.6991622501483
501765.91743.5095222672922.3904777327094
511635.251677.14226607157-41.8922660715677


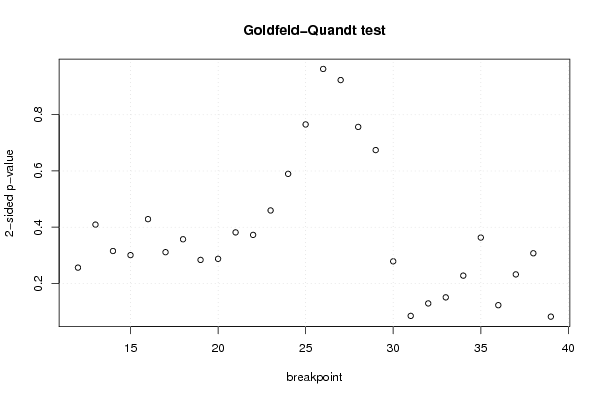
Goldfeld-Quandt test for Heteroskedasticity
p-valuesAlternative Hypothesis
breakpoint indexgreater2-sidedless
120.8718270400030080.2563459199939840.128172959996992
130.7953575442490610.4092849115018770.204642455750939
140.8422984204415980.3154031591168040.157701579558402
150.8496177418877230.3007645162245540.150382258112277
160.7856297679828040.4287404640343910.214370232017196
170.8443683939566620.3112632120866770.155631606043338
180.8213820808730250.3572358382539510.178617919126975
190.8581057726846010.2837884546307980.141894227315399
200.8561976138523050.287604772295390.143802386147695
210.8091777387428120.3816445225143760.190822261257188
220.8136477974001580.3727044051996840.186352202599842
230.7701667467301890.4596665065396220.229833253269811
240.70513872196870.58972255606260.2948612780313
250.6172830492642620.7654339014714750.382716950735738
260.5186626597282510.9626746805434980.481337340271749
270.4615734512837020.9231469025674050.538426548716298
280.3782688645888560.7565377291777120.621731135411144
290.3371190738683080.6742381477366160.662880926131692
300.8606062053197870.2787875893604250.139393794680213
310.9576100299644520.08477994007109620.0423899700355481
320.9354778201585750.1290443596828500.0645221798414249
330.9246704513240920.1506590973518150.0753295486759075
340.8860690007494220.2278619985011560.113930999250578
350.8183838655267910.3632322689464180.181616134473209
360.9386059819538970.1227880360922060.0613940180461028
370.8838604811628720.2322790376742560.116139518837128
380.8462974817799440.3074050364401120.153702518220056
390.9589741344601820.08205173107963690.0410258655398184

\begin{tabular}{lllllllll}
\hline
Goldfeld-Quandt test for Heteroskedasticity \tabularnewline
p-values & Alternative Hypothesis \tabularnewline
breakpoint index & greater & 2-sided & less \tabularnewline
12 & 0.871827040003008 & 0.256345919993984 & 0.128172959996992 \tabularnewline
13 & 0.795357544249061 & 0.409284911501877 & 0.204642455750939 \tabularnewline
14 & 0.842298420441598 & 0.315403159116804 & 0.157701579558402 \tabularnewline
15 & 0.849617741887723 & 0.300764516224554 & 0.150382258112277 \tabularnewline
16 & 0.785629767982804 & 0.428740464034391 & 0.214370232017196 \tabularnewline
17 & 0.844368393956662 & 0.311263212086677 & 0.155631606043338 \tabularnewline
18 & 0.821382080873025 & 0.357235838253951 & 0.178617919126975 \tabularnewline
19 & 0.858105772684601 & 0.283788454630798 & 0.141894227315399 \tabularnewline
20 & 0.856197613852305 & 0.28760477229539 & 0.143802386147695 \tabularnewline
21 & 0.809177738742812 & 0.381644522514376 & 0.190822261257188 \tabularnewline
22 & 0.813647797400158 & 0.372704405199684 & 0.186352202599842 \tabularnewline
23 & 0.770166746730189 & 0.459666506539622 & 0.229833253269811 \tabularnewline
24 & 0.7051387219687 & 0.5897225560626 & 0.2948612780313 \tabularnewline
25 & 0.617283049264262 & 0.765433901471475 & 0.382716950735738 \tabularnewline
26 & 0.518662659728251 & 0.962674680543498 & 0.481337340271749 \tabularnewline
27 & 0.461573451283702 & 0.923146902567405 & 0.538426548716298 \tabularnewline
28 & 0.378268864588856 & 0.756537729177712 & 0.621731135411144 \tabularnewline
29 & 0.337119073868308 & 0.674238147736616 & 0.662880926131692 \tabularnewline
30 & 0.860606205319787 & 0.278787589360425 & 0.139393794680213 \tabularnewline
31 & 0.957610029964452 & 0.0847799400710962 & 0.0423899700355481 \tabularnewline
32 & 0.935477820158575 & 0.129044359682850 & 0.0645221798414249 \tabularnewline
33 & 0.924670451324092 & 0.150659097351815 & 0.0753295486759075 \tabularnewline
34 & 0.886069000749422 & 0.227861998501156 & 0.113930999250578 \tabularnewline
35 & 0.818383865526791 & 0.363232268946418 & 0.181616134473209 \tabularnewline
36 & 0.938605981953897 & 0.122788036092206 & 0.0613940180461028 \tabularnewline
37 & 0.883860481162872 & 0.232279037674256 & 0.116139518837128 \tabularnewline
38 & 0.846297481779944 & 0.307405036440112 & 0.153702518220056 \tabularnewline
39 & 0.958974134460182 & 0.0820517310796369 & 0.0410258655398184 \tabularnewline
\hline
\end{tabular}
%Source: https://freestatistics.org/blog/index.php?pk=105625&T=5

[TABLE]
[ROW][C]Goldfeld-Quandt test for Heteroskedasticity[/C][/ROW]
[ROW][C]p-values[/C][C]Alternative Hypothesis[/C][/ROW]
[ROW][C]breakpoint index[/C][C]greater[/C][C]2-sided[/C][C]less[/C][/ROW]
[ROW][C]12[/C][C]0.871827040003008[/C][C]0.256345919993984[/C][C]0.128172959996992[/C][/ROW]
[ROW][C]13[/C][C]0.795357544249061[/C][C]0.409284911501877[/C][C]0.204642455750939[/C][/ROW]
[ROW][C]14[/C][C]0.842298420441598[/C][C]0.315403159116804[/C][C]0.157701579558402[/C][/ROW]
[ROW][C]15[/C][C]0.849617741887723[/C][C]0.300764516224554[/C][C]0.150382258112277[/C][/ROW]
[ROW][C]16[/C][C]0.785629767982804[/C][C]0.428740464034391[/C][C]0.214370232017196[/C][/ROW]
[ROW][C]17[/C][C]0.844368393956662[/C][C]0.311263212086677[/C][C]0.155631606043338[/C][/ROW]
[ROW][C]18[/C][C]0.821382080873025[/C][C]0.357235838253951[/C][C]0.178617919126975[/C][/ROW]
[ROW][C]19[/C][C]0.858105772684601[/C][C]0.283788454630798[/C][C]0.141894227315399[/C][/ROW]
[ROW][C]20[/C][C]0.856197613852305[/C][C]0.28760477229539[/C][C]0.143802386147695[/C][/ROW]
[ROW][C]21[/C][C]0.809177738742812[/C][C]0.381644522514376[/C][C]0.190822261257188[/C][/ROW]
[ROW][C]22[/C][C]0.813647797400158[/C][C]0.372704405199684[/C][C]0.186352202599842[/C][/ROW]
[ROW][C]23[/C][C]0.770166746730189[/C][C]0.459666506539622[/C][C]0.229833253269811[/C][/ROW]
[ROW][C]24[/C][C]0.7051387219687[/C][C]0.5897225560626[/C][C]0.2948612780313[/C][/ROW]
[ROW][C]25[/C][C]0.617283049264262[/C][C]0.765433901471475[/C][C]0.382716950735738[/C][/ROW]
[ROW][C]26[/C][C]0.518662659728251[/C][C]0.962674680543498[/C][C]0.481337340271749[/C][/ROW]
[ROW][C]27[/C][C]0.461573451283702[/C][C]0.923146902567405[/C][C]0.538426548716298[/C][/ROW]
[ROW][C]28[/C][C]0.378268864588856[/C][C]0.756537729177712[/C][C]0.621731135411144[/C][/ROW]
[ROW][C]29[/C][C]0.337119073868308[/C][C]0.674238147736616[/C][C]0.662880926131692[/C][/ROW]
[ROW][C]30[/C][C]0.860606205319787[/C][C]0.278787589360425[/C][C]0.139393794680213[/C][/ROW]
[ROW][C]31[/C][C]0.957610029964452[/C][C]0.0847799400710962[/C][C]0.0423899700355481[/C][/ROW]
[ROW][C]32[/C][C]0.935477820158575[/C][C]0.129044359682850[/C][C]0.0645221798414249[/C][/ROW]
[ROW][C]33[/C][C]0.924670451324092[/C][C]0.150659097351815[/C][C]0.0753295486759075[/C][/ROW]
[ROW][C]34[/C][C]0.886069000749422[/C][C]0.227861998501156[/C][C]0.113930999250578[/C][/ROW]
[ROW][C]35[/C][C]0.818383865526791[/C][C]0.363232268946418[/C][C]0.181616134473209[/C][/ROW]
[ROW][C]36[/C][C]0.938605981953897[/C][C]0.122788036092206[/C][C]0.0613940180461028[/C][/ROW]
[ROW][C]37[/C][C]0.883860481162872[/C][C]0.232279037674256[/C][C]0.116139518837128[/C][/ROW]
[ROW][C]38[/C][C]0.846297481779944[/C][C]0.307405036440112[/C][C]0.153702518220056[/C][/ROW]
[ROW][C]39[/C][C]0.958974134460182[/C][C]0.0820517310796369[/C][C]0.0410258655398184[/C][/ROW]
[/TABLE]
Source: https://freestatistics.org/blog/index.php?pk=105625&T=5

Globally Unique Identifier (entire table): ba.freestatistics.org/blog/index.php?pk=105625&T=5

As an alternative you can also use a QR Code:  

The GUIDs for individual cells are displayed in the table below:

Goldfeld-Quandt test for Heteroskedasticity
p-valuesAlternative Hypothesis
breakpoint indexgreater2-sidedless
120.8718270400030080.2563459199939840.128172959996992
130.7953575442490610.4092849115018770.204642455750939
140.8422984204415980.3154031591168040.157701579558402
150.8496177418877230.3007645162245540.150382258112277
160.7856297679828040.4287404640343910.214370232017196
170.8443683939566620.3112632120866770.155631606043338
180.8213820808730250.3572358382539510.178617919126975
190.8581057726846010.2837884546307980.141894227315399
200.8561976138523050.287604772295390.143802386147695
210.8091777387428120.3816445225143760.190822261257188
220.8136477974001580.3727044051996840.186352202599842
230.7701667467301890.4596665065396220.229833253269811
240.70513872196870.58972255606260.2948612780313
250.6172830492642620.7654339014714750.382716950735738
260.5186626597282510.9626746805434980.481337340271749
270.4615734512837020.9231469025674050.538426548716298
280.3782688645888560.7565377291777120.621731135411144
290.3371190738683080.6742381477366160.662880926131692
300.8606062053197870.2787875893604250.139393794680213
310.9576100299644520.08477994007109620.0423899700355481
320.9354778201585750.1290443596828500.0645221798414249
330.9246704513240920.1506590973518150.0753295486759075
340.8860690007494220.2278619985011560.113930999250578
350.8183838655267910.3632322689464180.181616134473209
360.9386059819538970.1227880360922060.0613940180461028
370.8838604811628720.2322790376742560.116139518837128
380.8462974817799440.3074050364401120.153702518220056
390.9589741344601820.08205173107963690.0410258655398184


Meta Analysis of Goldfeld-Quandt test for Heteroskedasticity
Description# significant tests% significant testsOK/NOK
1% type I error level00OK
5% type I error level00OK
10% type I error level20.0714285714285714OK

\begin{tabular}{lllllllll}
\hline
Meta Analysis of Goldfeld-Quandt test for Heteroskedasticity \tabularnewline
Description & # significant tests & % significant tests & OK/NOK \tabularnewline
1% type I error level & 0 & 0 & OK \tabularnewline
5% type I error level & 0 & 0 & OK \tabularnewline
10% type I error level & 2 & 0.0714285714285714 & OK \tabularnewline
\hline
\end{tabular}
%Source: https://freestatistics.org/blog/index.php?pk=105625&T=6

[TABLE]
[ROW][C]Meta Analysis of Goldfeld-Quandt test for Heteroskedasticity[/C][/ROW]
[ROW][C]Description[/C][C]# significant tests[/C][C]% significant tests[/C][C]OK/NOK[/C][/ROW]
[ROW][C]1% type I error level[/C][C]0[/C][C]0[/C][C]OK[/C][/ROW]
[ROW][C]5% type I error level[/C][C]0[/C][C]0[/C][C]OK[/C][/ROW]
[ROW][C]10% type I error level[/C][C]2[/C][C]0.0714285714285714[/C][C]OK[/C][/ROW]
[/TABLE]
Source: https://freestatistics.org/blog/index.php?pk=105625&T=6

Globally Unique Identifier (entire table): ba.freestatistics.org/blog/index.php?pk=105625&T=6

As an alternative you can also use a QR Code:  

The GUIDs for individual cells are displayed in the table below:

Meta Analysis of Goldfeld-Quandt test for Heteroskedasticity
Description# significant tests% significant testsOK/NOK
1% type I error level00OK
5% type I error level00OK
10% type I error level20.0714285714285714OK


Parameters (Session):
par1 = 1 ; par2 = Do not include Seasonal Dummies ; par3 = Linear Trend ;
Parameters (R input):
par1 = 1 ; par2 = Do not include Seasonal Dummies ; par3 = Linear Trend ;
R code (references can be found in the software module):
library(lattice)
library(lmtest)
n25 <- 25 #minimum number of obs. for Goldfeld-Quandt test
par1 <- as.numeric(par1)
x <- t(y)
k <- length(x[1,])
n <- length(x[,1])
x1 <- cbind(x[,par1], x[,1:k!=par1])
mycolnames <- c(colnames(x)[par1], colnames(x)[1:k!=par1])
colnames(x1) <- mycolnames #colnames(x)[par1]
x <- x1
if (par3 == 'First Differences'){
x2 <- array(0, dim=c(n-1,k), dimnames=list(1:(n-1), paste('(1-B)',colnames(x),sep='')))
for (i in 1:n-1) {
for (j in 1:k) {
x2[i,j] <- x[i+1,j] - x[i,j]
}
}
x <- x2
}
if (par2 == 'Include Monthly Dummies'){
x2 <- array(0, dim=c(n,11), dimnames=list(1:n, paste('M', seq(1:11), sep ='')))
for (i in 1:11){
x2[seq(i,n,12),i] <- 1
}
x <- cbind(x, x2)
}
if (par2 == 'Include Quarterly Dummies'){
x2 <- array(0, dim=c(n,3), dimnames=list(1:n, paste('Q', seq(1:3), sep ='')))
for (i in 1:3){
x2[seq(i,n,4),i] <- 1
}
x <- cbind(x, x2)
}
k <- length(x[1,])
if (par3 == 'Linear Trend'){
x <- cbind(x, c(1:n))
colnames(x)[k+1] <- 't'
}
x
k <- length(x[1,])
df <- as.data.frame(x)
(mylm <- lm(df))
(mysum <- summary(mylm))
if (n > n25) {
kp3 <- k + 3
nmkm3 <- n - k - 3
gqarr <- array(NA, dim=c(nmkm3-kp3+1,3))
numgqtests <- 0
numsignificant1 <- 0
numsignificant5 <- 0
numsignificant10 <- 0
for (mypoint in kp3:nmkm3) {
j <- 0
numgqtests <- numgqtests + 1
for (myalt in c('greater', 'two.sided', 'less')) {
j <- j + 1
gqarr[mypoint-kp3+1,j] <- gqtest(mylm, point=mypoint, alternative=myalt)$p.value
}
if (gqarr[mypoint-kp3+1,2] < 0.01) numsignificant1 <- numsignificant1 + 1
if (gqarr[mypoint-kp3+1,2] < 0.05) numsignificant5 <- numsignificant5 + 1
if (gqarr[mypoint-kp3+1,2] < 0.10) numsignificant10 <- numsignificant10 + 1
}
gqarr
}
bitmap(file='test0.png')
plot(x[,1], type='l', main='Actuals and Interpolation', ylab='value of Actuals and Interpolation (dots)', xlab='time or index')
points(x[,1]-mysum$resid)
grid()
dev.off()
bitmap(file='test1.png')
plot(mysum$resid, type='b', pch=19, main='Residuals', ylab='value of Residuals', xlab='time or index')
grid()
dev.off()
bitmap(file='test2.png')
hist(mysum$resid, main='Residual Histogram', xlab='values of Residuals')
grid()
dev.off()
bitmap(file='test3.png')
densityplot(~mysum$resid,col='black',main='Residual Density Plot', xlab='values of Residuals')
dev.off()
bitmap(file='test4.png')
qqnorm(mysum$resid, main='Residual Normal Q-Q Plot')
qqline(mysum$resid)
grid()
dev.off()
(myerror <- as.ts(mysum$resid))
bitmap(file='test5.png')
dum <- cbind(lag(myerror,k=1),myerror)
dum
dum1 <- dum[2:length(myerror),]
dum1
z <- as.data.frame(dum1)
z
plot(z,main=paste('Residual Lag plot, lowess, and regression line'), ylab='values of Residuals', xlab='lagged values of Residuals')
lines(lowess(z))
abline(lm(z))
grid()
dev.off()
bitmap(file='test6.png')
acf(mysum$resid, lag.max=length(mysum$resid)/2, main='Residual Autocorrelation Function')
grid()
dev.off()
bitmap(file='test7.png')
pacf(mysum$resid, lag.max=length(mysum$resid)/2, main='Residual Partial Autocorrelation Function')
grid()
dev.off()
bitmap(file='test8.png')
opar <- par(mfrow = c(2,2), oma = c(0, 0, 1.1, 0))
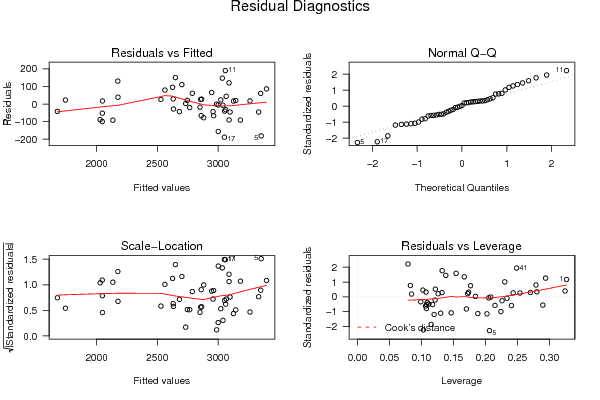
plot(mylm, las = 1, sub='Residual Diagnostics')
par(opar)
dev.off()
if (n > n25) {
bitmap(file='test9.png')
plot(kp3:nmkm3,gqarr[,2], main='Goldfeld-Quandt test',ylab='2-sided p-value',xlab='breakpoint')
grid()
dev.off()
}
load(file='createtable')
a<-table.start()
a<-table.row.start(a)
a<-table.element(a, 'Multiple Linear Regression - Estimated Regression Equation', 1, TRUE)
a<-table.row.end(a)
myeq <- colnames(x)[1]
myeq <- paste(myeq, '[t] = ', sep='')
for (i in 1:k){
if (mysum$coefficients[i,1] > 0) myeq <- paste(myeq, '+', '')
myeq <- paste(myeq, mysum$coefficients[i,1], sep=' ')
if (rownames(mysum$coefficients)[i] != '(Intercept)') {
myeq <- paste(myeq, rownames(mysum$coefficients)[i], sep='')
if (rownames(mysum$coefficients)[i] != 't') myeq <- paste(myeq, '[t]', sep='')
}
}
myeq <- paste(myeq, ' + e[t]')
a<-table.row.start(a)
a<-table.element(a, myeq)
a<-table.row.end(a)
a<-table.end(a)
table.save(a,file='mytable1.tab')
a<-table.start()
a<-table.row.start(a)
a<-table.element(a,hyperlink('ols1.htm','Multiple Linear Regression - Ordinary Least Squares',''), 6, TRUE)
a<-table.row.end(a)
a<-table.row.start(a)
a<-table.element(a,'Variable',header=TRUE)
a<-table.element(a,'Parameter',header=TRUE)
a<-table.element(a,'S.D.',header=TRUE)
a<-table.element(a,'T-STAT
H0: parameter = 0',header=TRUE)
a<-table.element(a,'2-tail p-value',header=TRUE)
a<-table.element(a,'1-tail p-value',header=TRUE)
a<-table.row.end(a)
for (i in 1:k){
a<-table.row.start(a)
a<-table.element(a,rownames(mysum$coefficients)[i],header=TRUE)
a<-table.element(a,mysum$coefficients[i,1])
a<-table.element(a, round(mysum$coefficients[i,2],6))
a<-table.element(a, round(mysum$coefficients[i,3],4))
a<-table.element(a, round(mysum$coefficients[i,4],6))
a<-table.element(a, round(mysum$coefficients[i,4]/2,6))
a<-table.row.end(a)
}
a<-table.end(a)
table.save(a,file='mytable2.tab')
a<-table.start()
a<-table.row.start(a)
a<-table.element(a, 'Multiple Linear Regression - Regression Statistics', 2, TRUE)
a<-table.row.end(a)
a<-table.row.start(a)
a<-table.element(a, 'Multiple R',1,TRUE)
a<-table.element(a, sqrt(mysum$r.squared))
a<-table.row.end(a)
a<-table.row.start(a)
a<-table.element(a, 'R-squared',1,TRUE)
a<-table.element(a, mysum$r.squared)
a<-table.row.end(a)
a<-table.row.start(a)
a<-table.element(a, 'Adjusted R-squared',1,TRUE)
a<-table.element(a, mysum$adj.r.squared)
a<-table.row.end(a)
a<-table.row.start(a)
a<-table.element(a, 'F-TEST (value)',1,TRUE)
a<-table.element(a, mysum$fstatistic[1])
a<-table.row.end(a)
a<-table.row.start(a)
a<-table.element(a, 'F-TEST (DF numerator)',1,TRUE)
a<-table.element(a, mysum$fstatistic[2])
a<-table.row.end(a)
a<-table.row.start(a)
a<-table.element(a, 'F-TEST (DF denominator)',1,TRUE)
a<-table.element(a, mysum$fstatistic[3])
a<-table.row.end(a)
a<-table.row.start(a)
a<-table.element(a, 'p-value',1,TRUE)
a<-table.element(a, 1-pf(mysum$fstatistic[1],mysum$fstatistic[2],mysum$fstatistic[3]))
a<-table.row.end(a)
a<-table.row.start(a)
a<-table.element(a, 'Multiple Linear Regression - Residual Statistics', 2, TRUE)
a<-table.row.end(a)
a<-table.row.start(a)
a<-table.element(a, 'Residual Standard Deviation',1,TRUE)
a<-table.element(a, mysum$sigma)
a<-table.row.end(a)
a<-table.row.start(a)
a<-table.element(a, 'Sum Squared Residuals',1,TRUE)
a<-table.element(a, sum(myerror*myerror))
a<-table.row.end(a)
a<-table.end(a)
table.save(a,file='mytable3.tab')
a<-table.start()
a<-table.row.start(a)
a<-table.element(a, 'Multiple Linear Regression - Actuals, Interpolation, and Residuals', 4, TRUE)
a<-table.row.end(a)
a<-table.row.start(a)
a<-table.element(a, 'Time or Index', 1, TRUE)
a<-table.element(a, 'Actuals', 1, TRUE)
a<-table.element(a, 'Interpolation
Forecast', 1, TRUE)
a<-table.element(a, 'Residuals
Prediction Error', 1, TRUE)
a<-table.row.end(a)
for (i in 1:n) {
a<-table.row.start(a)
a<-table.element(a,i, 1, TRUE)
a<-table.element(a,x[i])
a<-table.element(a,x[i]-mysum$resid[i])
a<-table.element(a,mysum$resid[i])
a<-table.row.end(a)
}
a<-table.end(a)
table.save(a,file='mytable4.tab')
if (n > n25) {
a<-table.start()
a<-table.row.start(a)
a<-table.element(a,'Goldfeld-Quandt test for Heteroskedasticity',4,TRUE)
a<-table.row.end(a)
a<-table.row.start(a)
a<-table.element(a,'p-values',header=TRUE)
a<-table.element(a,'Alternative Hypothesis',3,header=TRUE)
a<-table.row.end(a)
a<-table.row.start(a)
a<-table.element(a,'breakpoint index',header=TRUE)
a<-table.element(a,'greater',header=TRUE)
a<-table.element(a,'2-sided',header=TRUE)
a<-table.element(a,'less',header=TRUE)
a<-table.row.end(a)
for (mypoint in kp3:nmkm3) {
a<-table.row.start(a)
a<-table.element(a,mypoint,header=TRUE)
a<-table.element(a,gqarr[mypoint-kp3+1,1])
a<-table.element(a,gqarr[mypoint-kp3+1,2])
a<-table.element(a,gqarr[mypoint-kp3+1,3])
a<-table.row.end(a)
}
a<-table.end(a)
table.save(a,file='mytable5.tab')
a<-table.start()
a<-table.row.start(a)
a<-table.element(a,'Meta Analysis of Goldfeld-Quandt test for Heteroskedasticity',4,TRUE)
a<-table.row.end(a)
a<-table.row.start(a)
a<-table.element(a,'Description',header=TRUE)
a<-table.element(a,'# significant tests',header=TRUE)
a<-table.element(a,'% significant tests',header=TRUE)
a<-table.element(a,'OK/NOK',header=TRUE)
a<-table.row.end(a)
a<-table.row.start(a)
a<-table.element(a,'1% type I error level',header=TRUE)
a<-table.element(a,numsignificant1)
a<-table.element(a,numsignificant1/numgqtests)
if (numsignificant1/numgqtests < 0.01) dum <- 'OK' else dum <- 'NOK'
a<-table.element(a,dum)
a<-table.row.end(a)
a<-table.row.start(a)
a<-table.element(a,'5% type I error level',header=TRUE)
a<-table.element(a,numsignificant5)
a<-table.element(a,numsignificant5/numgqtests)
if (numsignificant5/numgqtests < 0.05) dum <- 'OK' else dum <- 'NOK'
a<-table.element(a,dum)
a<-table.row.end(a)
a<-table.row.start(a)
a<-table.element(a,'10% type I error level',header=TRUE)
a<-table.element(a,numsignificant10)
a<-table.element(a,numsignificant10/numgqtests)
if (numsignificant10/numgqtests < 0.1) dum <- 'OK' else dum <- 'NOK'
a<-table.element(a,dum)
a<-table.row.end(a)
a<-table.end(a)
table.save(a,file='mytable6.tab')
}