| Multiple Linear Regression - Estimated Regression Equation |
| BEL_20[t] = + 688.098795765917 + 0.0462179954610761Nikkei[t] + 0.278030419928214DJ_Indust[t] -0.178777803993867Goudprijs[t] -57.5548412693366Conjunct_Seizoenzuiver[t] + 33.6760247240671Cons_vertrouw[t] -131.109005569773Alg_consumptie_index_BE[t] + 131.838648549116Gem_rente_kasbon_1j[t] -34.4247599390837M1[t] + 56.988069043629M2[t] -72.544498687564M3[t] -24.1245880172990M4[t] -68.2147043679782M5[t] -14.5616582959767M6[t] -131.285788333769M7[t] -116.524230423104M8[t] + 65.1267127103127M9[t] + 96.69510720441M10[t] + 87.6952746740044M11[t] + e[t] |
| Multiple Linear Regression - Ordinary Least Squares | |||||
| Variable | Parameter | S.D. | T-STAT H0: parameter = 0 | 2-tail p-value | 1-tail p-value |
| (Intercept) | 688.098795765917 | 899.143352 | 0.7653 | 0.449711 | 0.224855 |
| Nikkei | 0.0462179954610761 | 0.02709 | 1.7061 | 0.097682 | 0.048841 |
| DJ_Indust | 0.278030419928214 | 0.06205 | 4.4808 | 8.9e-05 | 4.5e-05 |
| Goudprijs | -0.178777803993867 | 0.051491 | -3.472 | 0.001502 | 0.000751 |
| Conjunct_Seizoenzuiver | -57.5548412693366 | 12.588776 | -4.5719 | 6.9e-05 | 3.4e-05 |
| Cons_vertrouw | 33.6760247240671 | 8.686369 | 3.8769 | 0.000494 | 0.000247 |
| Alg_consumptie_index_BE | -131.109005569773 | 75.27088 | -1.7418 | 0.091145 | 0.045572 |
| Gem_rente_kasbon_1j | 131.838648549116 | 130.185368 | 1.0127 | 0.3188 | 0.1594 |
| M1 | -34.4247599390837 | 119.646909 | -0.2877 | 0.775417 | 0.387708 |
| M2 | 56.988069043629 | 118.586593 | 0.4806 | 0.634098 | 0.317049 |
| M3 | -72.544498687564 | 120.302055 | -0.603 | 0.550746 | 0.275373 |
| M4 | -24.1245880172990 | 126.555262 | -0.1906 | 0.850024 | 0.425012 |
| M5 | -68.2147043679782 | 127.073369 | -0.5368 | 0.595109 | 0.297555 |
| M6 | -14.5616582959767 | 124.993304 | -0.1165 | 0.907985 | 0.453992 |
| M7 | -131.285788333769 | 126.340208 | -1.0391 | 0.306526 | 0.153263 |
| M8 | -116.524230423104 | 124.034076 | -0.9395 | 0.354536 | 0.177268 |
| M9 | 65.1267127103127 | 124.006179 | 0.5252 | 0.603072 | 0.301536 |
| M10 | 96.69510720441 | 129.142918 | 0.7487 | 0.459479 | 0.22974 |
| M11 | 87.6952746740044 | 122.460306 | 0.7161 | 0.479116 | 0.239558 |
| Multiple Linear Regression - Regression Statistics | |
| Multiple R | 0.94922276490454 |
| R-squared | 0.901023857413022 |
| Adjusted R-squared | 0.845349777207846 |
| F-TEST (value) | 16.1839019898036 |
| F-TEST (DF numerator) | 18 |
| F-TEST (DF denominator) | 32 |
| p-value | 2.85611534422969e-11 |
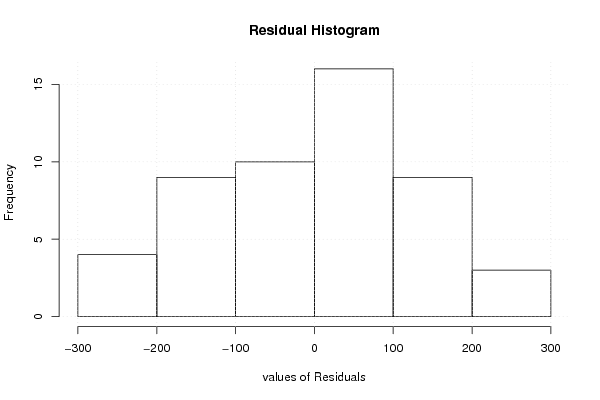
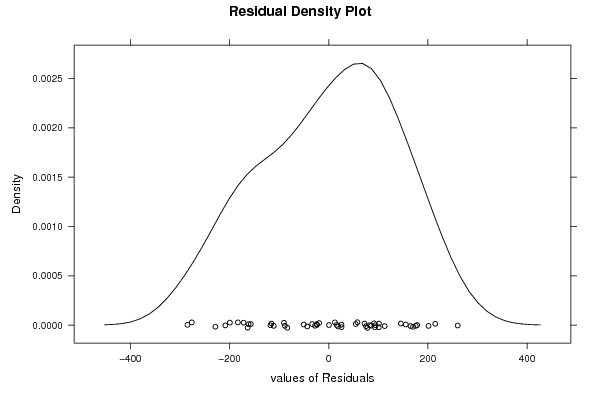
| Multiple Linear Regression - Residual Statistics | |
| Residual Standard Deviation | 169.602470518423 |
| Sum Squared Residuals | 920479.936190486 |
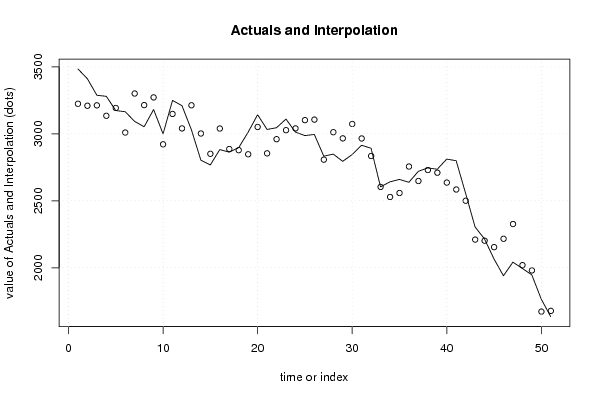
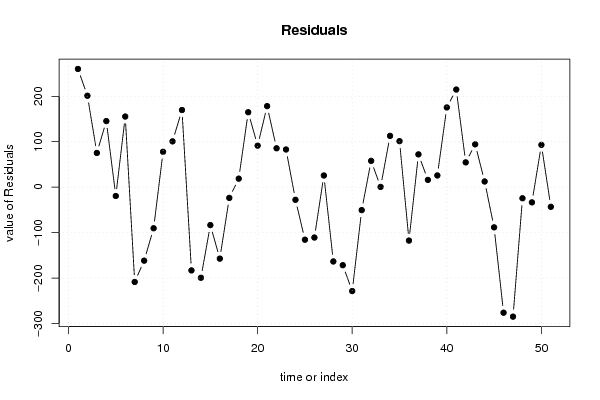
| Multiple Linear Regression - Actuals, Interpolation, and Residuals | |||
| Time or Index | Actuals | Interpolation Forecast | Residuals Prediction Error |
| 1 | 3484.74 | 3224.64088077143 | 260.099119228574 |
| 2 | 3411.13 | 3209.95278468158 | 201.177215318422 |
| 3 | 3288.18 | 3212.88609120956 | 75.2939087904361 |
| 4 | 3280.37 | 3134.99638214319 | 145.373617856807 |
| 5 | 3173.95 | 3193.38303085782 | -19.4330308578158 |
| 6 | 3165.26 | 3009.90491731214 | 155.355082687857 |
| 7 | 3092.71 | 3301.27426870604 | -208.564268706039 |
| 8 | 3053.05 | 3214.76467480129 | -161.714674801295 |
| 9 | 3181.96 | 3272.38150022858 | -90.4215002285755 |
| 10 | 2999.93 | 2922.08462795288 | 77.8453720471175 |
| 11 | 3249.57 | 3148.76806201861 | 100.801937981386 |
| 12 | 3210.52 | 3040.79870095976 | 169.721299040245 |
| 13 | 3030.29 | 3213.49249969773 | -183.202499697735 |
| 14 | 2803.47 | 3002.84415934495 | -199.374159344950 |
| 15 | 2767.63 | 2851.11637451454 | -83.4863745145386 |
| 16 | 2882.6 | 3039.84780185671 | -157.247801856710 |
| 17 | 2863.36 | 2886.97695304247 | -23.6169530424729 |
| 18 | 2897.06 | 2878.34003453593 | 18.7199654640731 |
| 19 | 3012.61 | 2847.7530188292 | 164.856981170799 |
| 20 | 3142.95 | 3051.60341578175 | 91.3465842182463 |
| 21 | 3032.93 | 2854.62949975961 | 178.300500240390 |
| 22 | 3045.78 | 2960.24639704260 | 85.5336029574046 |
| 23 | 3110.52 | 3027.61657014991 | 82.903429850085 |
| 24 | 3013.24 | 3041.02513331141 | -27.7851333114125 |
| 25 | 2987.1 | 3102.68362683346 | -115.583626833456 |
| 26 | 2995.55 | 3106.40613188762 | -110.856131887622 |
| 27 | 2833.18 | 2807.51664806401 | 25.6633519359916 |
| 28 | 2848.96 | 3012.44410974976 | -163.484109749757 |
| 29 | 2794.83 | 2966.54983242192 | -171.719832421920 |
| 30 | 2845.26 | 3073.86057512869 | -228.600575128694 |
| 31 | 2915.02 | 2965.5539739007 | -50.5339739006996 |
| 32 | 2892.63 | 2834.76908184210 | 57.8609181579048 |
| 33 | 2604.42 | 2603.85126636338 | 0.568733636618269 |
| 34 | 2641.65 | 2528.84685263005 | 112.80314736995 |
| 35 | 2659.81 | 2558.59725077912 | 101.212749220876 |
| 36 | 2638.53 | 2756.04708943989 | -117.517089439890 |
| 37 | 2720.25 | 2648.10313852327 | 72.1468614767347 |
| 38 | 2745.88 | 2729.87264474623 | 16.0073552537680 |
| 39 | 2735.7 | 2709.92785652090 | 25.7721434790966 |
| 40 | 2811.7 | 2636.34170625034 | 175.35829374966 |
| 41 | 2799.43 | 2584.66018367779 | 214.769816322209 |
| 42 | 2555.28 | 2500.75447302324 | 54.5255269767635 |
| 43 | 2304.98 | 2210.73873856406 | 94.2412614359392 |
| 44 | 2214.95 | 2202.44282757486 | 12.5071724251435 |
| 45 | 2065.81 | 2154.25773364843 | -88.4477336484332 |
| 46 | 1940.49 | 2216.67212237447 | -276.182122374472 |
| 47 | 2042 | 2326.91811705235 | -284.918117052346 |
| 48 | 1995.37 | 2019.78907628894 | -24.4190762889422 |
| 49 | 1946.81 | 1980.26985417412 | -33.4598541741173 |
| 50 | 1765.9 | 1672.85427933962 | 93.0457206603824 |
| 51 | 1635.25 | 1678.49302969099 | -43.2430296909856 |
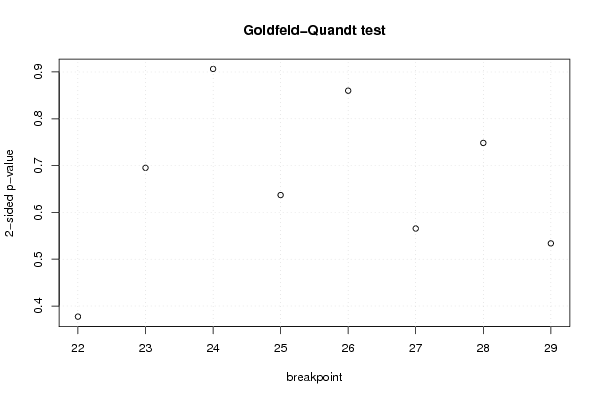
| Goldfeld-Quandt test for Heteroskedasticity | |||
| p-values | Alternative Hypothesis | ||
| breakpoint index | greater | 2-sided | less |
| 22 | 0.188679558931162 | 0.377359117862323 | 0.811320441068838 |
| 23 | 0.347628123017332 | 0.695256246034664 | 0.652371876982668 |
| 24 | 0.453208207933719 | 0.906416415867437 | 0.546791792066281 |
| 25 | 0.318510749893035 | 0.637021499786071 | 0.681489250106965 |
| 26 | 0.429994572970301 | 0.859989145940602 | 0.570005427029699 |
| 27 | 0.282788979948318 | 0.565577959896637 | 0.717211020051681 |
| 28 | 0.374212634431992 | 0.748425268863984 | 0.625787365568008 |
| 29 | 0.266928233483421 | 0.533856466966843 | 0.733071766516578 |
| Meta Analysis of Goldfeld-Quandt test for Heteroskedasticity | |||
| Description | # significant tests | % significant tests | OK/NOK |
| 1% type I error level | 0 | 0 | OK |
| 5% type I error level | 0 | 0 | OK |
| 10% type I error level | 0 | 0 | OK |