| Multiple Linear Regression - Estimated Regression Equation |
| BEL_20[t] = -437.150130487514 + 0.0822460593228443Nikkei[t] + 0.157632205011041DJ_Indust[t] -0.0356323334275397Goudprijs[t] -4.97051484989923Conjunct_Seizoenzuiver[t] -0.505827584503886Cons_vertrouw[t] + 55.8217095027264Alg_consumptie_index_BE[t] -32.8367316002704Gem_rente_kasbon_5j[t] + 0.273525857881991Y1[t] -0.0033510421496098Y2[t] + 0.118967771142002Y3[t] + 0.141804980701454Y4[t] -53.7213924732792M1[t] -40.1662586828167M2[t] -26.8055842768575M3[t] + 53.3258062955028M4[t] + 59.9822935133613M5[t] + 49.9516938387192M6[t] + 76.3109196672503M7[t] -6.06146549961345M8[t] -77.0522153153102M9[t] -18.0618843132753M10[t] + 17.6333117110356M11[t] -9.75190391682969t + e[t] |
| Multiple Linear Regression - Ordinary Least Squares | |||||
| Variable | Parameter | S.D. | T-STAT H0: parameter = 0 | 2-tail p-value | 1-tail p-value |
| (Intercept) | -437.150130487514 | 557.507462 | -0.7841 | 0.437174 | 0.218587 |
| Nikkei | 0.0822460593228443 | 0.012405 | 6.6303 | 0 | 0 |
| DJ_Indust | 0.157632205011041 | 0.024363 | 6.4701 | 0 | 0 |
| Goudprijs | -0.0356323334275397 | 0.015009 | -2.374 | 0.022026 | 0.011013 |
| Conjunct_Seizoenzuiver | -4.97051484989923 | 5.318399 | -0.9346 | 0.355101 | 0.177551 |
| Cons_vertrouw | -0.505827584503886 | 5.08118 | -0.0995 | 0.921154 | 0.460577 |
| Alg_consumptie_index_BE | 55.8217095027264 | 11.957079 | 4.6685 | 2.9e-05 | 1.4e-05 |
| Gem_rente_kasbon_5j | -32.8367316002704 | 44.625418 | -0.7358 | 0.465739 | 0.232869 |
| Y1 | 0.273525857881991 | 0.105941 | 2.5819 | 0.013233 | 0.006617 |
| Y2 | -0.0033510421496098 | 0.109178 | -0.0307 | 0.975653 | 0.487826 |
| Y3 | 0.118967771142002 | 0.108408 | 1.0974 | 0.278432 | 0.139216 |
| Y4 | 0.141804980701454 | 0.078859 | 1.7982 | 0.079008 | 0.039504 |
| M1 | -53.7213924732792 | 50.379829 | -1.0663 | 0.292092 | 0.146046 |
| M2 | -40.1662586828167 | 51.427424 | -0.781 | 0.438968 | 0.219484 |
| M3 | -26.8055842768575 | 50.167432 | -0.5343 | 0.595808 | 0.297904 |
| M4 | 53.3258062955028 | 51.579688 | 1.0339 | 0.306854 | 0.153427 |
| M5 | 59.9822935133613 | 56.411156 | 1.0633 | 0.293444 | 0.146722 |
| M6 | 49.9516938387192 | 59.75632 | 0.8359 | 0.407715 | 0.203857 |
| M7 | 76.3109196672503 | 61.056007 | 1.2499 | 0.217961 | 0.108981 |
| M8 | -6.06146549961345 | 55.750862 | -0.1087 | 0.913916 | 0.456958 |
| M9 | -77.0522153153102 | 54.904333 | -1.4034 | 0.167519 | 0.083759 |
| M10 | -18.0618843132753 | 53.197752 | -0.3395 | 0.735831 | 0.367915 |
| M11 | 17.6333117110356 | 52.060199 | 0.3387 | 0.736439 | 0.36822 |
| t | -9.75190391682969 | 3.70872 | -2.6295 | 0.011738 | 0.005869 |
| Multiple Linear Regression - Regression Statistics | |
| Multiple R | 0.99701564320794 |
| R-squared | 0.99404019280134 |
| Adjusted R-squared | 0.990924839038406 |
| F-TEST (value) | 319.077789696899 |
| F-TEST (DF numerator) | 23 |
| F-TEST (DF denominator) | 44 |
| p-value | 0 |
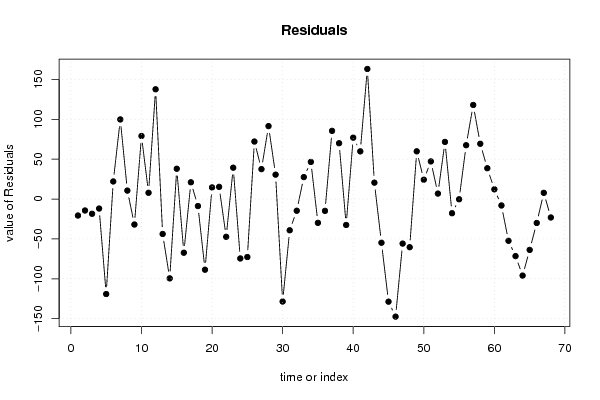
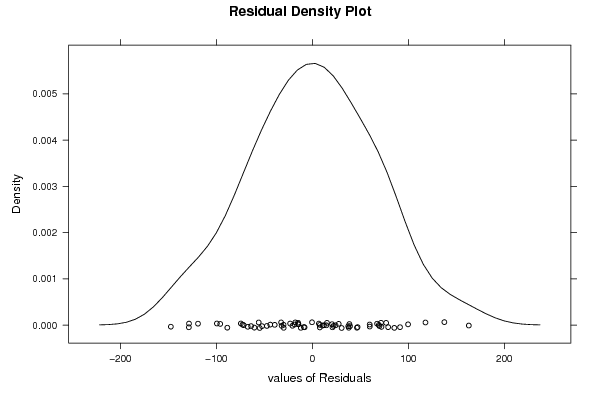
| Multiple Linear Regression - Residual Statistics | |
| Residual Standard Deviation | 81.0167551044207 |
| Sum Squared Residuals | 288803.442736586 |
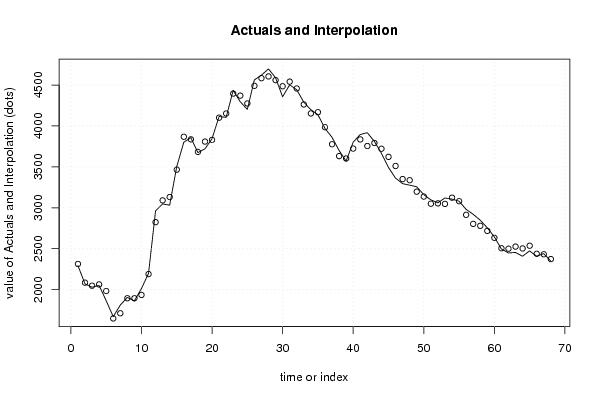
| Multiple Linear Regression - Actuals, Interpolation, and Residuals | |||
| Time or Index | Actuals | Interpolation Forecast | Residuals Prediction Error |
| 1 | 2293.41 | 2314.09027639276 | -20.6802763927601 |
| 2 | 2070.83 | 2085.23326404422 | -14.4032640442217 |
| 3 | 2029.6 | 2048.08337850274 | -18.4833785027381 |
| 4 | 2052.02 | 2063.95680329801 | -11.93680329801 |
| 5 | 1864.44 | 1983.55904105403 | -119.119041054026 |
| 6 | 1670.07 | 1648.03985626003 | 22.0301437399714 |
| 7 | 1810.99 | 1711.21561063193 | 99.7743893680729 |
| 8 | 1905.41 | 1894.81915954437 | 10.5908404556259 |
| 9 | 1862.83 | 1894.79700019651 | -31.9670001965138 |
| 10 | 2014.45 | 1935.42142567879 | 79.0285743212066 |
| 11 | 2197.82 | 2189.97920747076 | 7.84079252923915 |
| 12 | 2962.34 | 2824.76477178693 | 137.575228213071 |
| 13 | 3047.03 | 3090.84076132081 | -43.8107613208125 |
| 14 | 3032.6 | 3132.07592685282 | -99.4759268528232 |
| 15 | 3504.37 | 3466.41063947719 | 37.9593605228114 |
| 16 | 3801.06 | 3868.33603465777 | -67.2760346577655 |
| 17 | 3857.62 | 3836.63330600387 | 20.9866939961319 |
| 18 | 3674.4 | 3683.21063167134 | -8.8106316713421 |
| 19 | 3720.98 | 3809.57240307486 | -88.5924030748574 |
| 20 | 3844.49 | 3829.93495684367 | 14.5550431563330 |
| 21 | 4116.68 | 4101.43541855698 | 15.2445814430163 |
| 22 | 4105.18 | 4152.54896983023 | -47.3689698302346 |
| 23 | 4435.23 | 4395.93709879218 | 39.2929012078197 |
| 24 | 4296.49 | 4370.98878675174 | -74.4987867517418 |
| 25 | 4202.52 | 4275.23017188377 | -72.7101718837678 |
| 26 | 4562.84 | 4490.78660709373 | 72.053392906266 |
| 27 | 4621.4 | 4583.9328213805 | 37.4671786194967 |
| 28 | 4696.96 | 4605.55072738551 | 91.4092726144865 |
| 29 | 4591.27 | 4560.71301511583 | 30.5569848841681 |
| 30 | 4356.98 | 4485.4887378022 | -128.508737802202 |
| 31 | 4502.64 | 4541.83228975478 | -39.1922897547817 |
| 32 | 4443.91 | 4458.58791416613 | -14.6779141661265 |
| 33 | 4290.89 | 4263.40487479395 | 27.4851252060536 |
| 34 | 4199.75 | 4153.25287704426 | 46.4971229557413 |
| 35 | 4138.52 | 4168.38511977971 | -29.8651197797128 |
| 36 | 3970.1 | 3984.96386458212 | -14.8638645821219 |
| 37 | 3862.27 | 3776.81578443947 | 85.454215560534 |
| 38 | 3701.61 | 3631.65691836561 | 69.9530816343925 |
| 39 | 3570.12 | 3602.64067283117 | -32.5206728311659 |
| 40 | 3801.06 | 3724.12533691505 | 76.9346630849504 |
| 41 | 3895.51 | 3835.74763512091 | 59.7623648790891 |
| 42 | 3917.96 | 3754.89279280640 | 163.067207193605 |
| 43 | 3813.06 | 3792.51070697236 | 20.5492930276419 |
| 44 | 3667.03 | 3721.84149336537 | -54.8114933653671 |
| 45 | 3494.17 | 3622.83850288249 | -128.668502882494 |
| 46 | 3363.99 | 3511.43696877591 | -147.446968775907 |
| 47 | 3295.32 | 3351.18397292840 | -55.8639729283959 |
| 48 | 3277.01 | 3337.38421243919 | -60.3742124391898 |
| 49 | 3257.16 | 3197.34548997678 | 59.8145100232234 |
| 50 | 3161.69 | 3137.46089563491 | 24.2291043650907 |
| 51 | 3097.31 | 3050.16374039400 | 47.1462596059962 |
| 52 | 3061.26 | 3054.43318788269 | 6.82681211730801 |
| 53 | 3119.31 | 3047.72306145014 | 71.5869385498575 |
| 54 | 3106.22 | 3124.00432994056 | -17.7843299405627 |
| 55 | 3080.58 | 3080.90717831594 | -0.327178315941167 |
| 56 | 2981.85 | 2914.38942102375 | 67.4605789762528 |
| 57 | 2921.44 | 2803.53420357006 | 117.905796429938 |
| 58 | 2849.27 | 2779.97975867081 | 69.2902413291934 |
| 59 | 2756.76 | 2718.16460102895 | 38.59539897105 |
| 60 | 2645.64 | 2633.47836444002 | 12.1616355599831 |
| 61 | 2497.84 | 2505.90751598642 | -8.06751598641694 |
| 62 | 2448.05 | 2500.40638800870 | -52.3563880087043 |
| 63 | 2454.62 | 2526.1887474144 | -71.5687474144003 |
| 64 | 2407.6 | 2503.55790986097 | -95.9579098609695 |
| 65 | 2472.81 | 2536.58394125522 | -63.7739412552211 |
| 66 | 2408.64 | 2438.63365151947 | -29.9936515194696 |
| 67 | 2440.25 | 2432.46181125013 | 7.78818874986562 |
| 68 | 2350.44 | 2373.55705505672 | -23.1170550567181 |
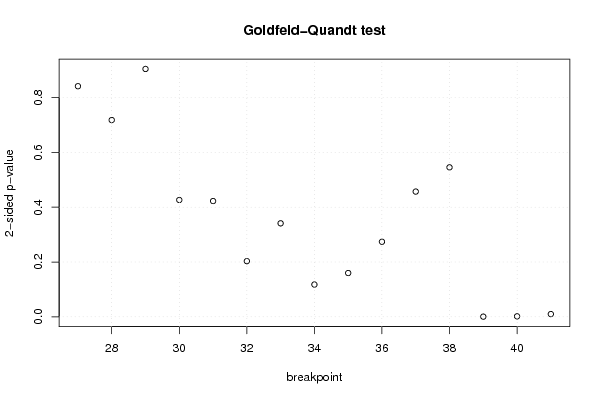
| Goldfeld-Quandt test for Heteroskedasticity | |||
| p-values | Alternative Hypothesis | ||
| breakpoint index | greater | 2-sided | less |
| 27 | 0.579031705810466 | 0.841936588379067 | 0.420968294189534 |
| 28 | 0.640851157887756 | 0.718297684224487 | 0.359148842112243 |
| 29 | 0.547541079611132 | 0.904917840777737 | 0.452458920388868 |
| 30 | 0.786752471714185 | 0.426495056571629 | 0.213247528285815 |
| 31 | 0.788720322638737 | 0.422559354722525 | 0.211279677361263 |
| 32 | 0.898398722019614 | 0.203202555960773 | 0.101601277980386 |
| 33 | 0.829363501748993 | 0.341272996502013 | 0.170636498251007 |
| 34 | 0.941147504321899 | 0.117704991356203 | 0.0588524956781013 |
| 35 | 0.92013078446536 | 0.159738431069281 | 0.0798692155346404 |
| 36 | 0.863024121448724 | 0.273951757102552 | 0.136975878551276 |
| 37 | 0.771430370508041 | 0.457139258983918 | 0.228569629491959 |
| 38 | 0.727168768219835 | 0.545662463560329 | 0.272831231780165 |
| 39 | 0.999765463589532 | 0.000469072820935074 | 0.000234536410467537 |
| 40 | 0.999179773345739 | 0.00164045330852254 | 0.000820226654261268 |
| 41 | 0.995038238006583 | 0.00992352398683306 | 0.00496176199341653 |
| Meta Analysis of Goldfeld-Quandt test for Heteroskedasticity | |||
| Description | # significant tests | % significant tests | OK/NOK |
| 1% type I error level | 3 | 0.2 | NOK |
| 5% type I error level | 3 | 0.2 | NOK |
| 10% type I error level | 3 | 0.2 | NOK |