Free Statistics
of Irreproducible Research!
Description of Statistical Computation | ||||||||||||||||||||||||||||||
|---|---|---|---|---|---|---|---|---|---|---|---|---|---|---|---|---|---|---|---|---|---|---|---|---|---|---|---|---|---|---|
| Author's title | ||||||||||||||||||||||||||||||
| Author | *Unverified author* | |||||||||||||||||||||||||||||
| R Software Module | Ian.Hollidayrwasp_Reddy-Moores DAta.wasp | |||||||||||||||||||||||||||||
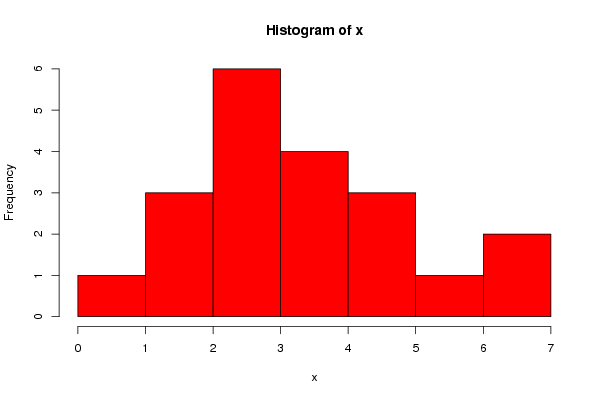
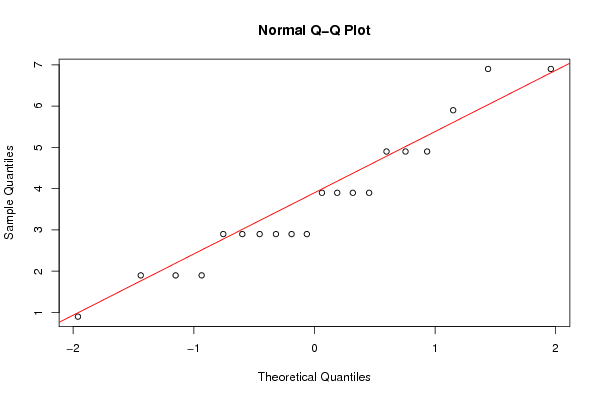
| Title produced by software | Histogram and QQPlot (Reddy-Moores Data) | |||||||||||||||||||||||||||||
| Date of computation | Sun, 05 Dec 2010 19:02:59 +0000 | |||||||||||||||||||||||||||||
| Cite this page as follows | Statistical Computations at FreeStatistics.org, Office for Research Development and Education, URL https://freestatistics.org/blog/index.php?v=date/2010/Dec/05/t1291575668kq31i23rdxmin86.htm/, Retrieved Wed, 01 May 2024 23:05:31 +0000 | |||||||||||||||||||||||||||||
| Statistical Computations at FreeStatistics.org, Office for Research Development and Education, URL https://freestatistics.org/blog/index.php?pk=105471, Retrieved Wed, 01 May 2024 23:05:31 +0000 | ||||||||||||||||||||||||||||||
| QR Codes: | ||||||||||||||||||||||||||||||
|
| ||||||||||||||||||||||||||||||
| Original text written by user: | ||||||||||||||||||||||||||||||
| IsPrivate? | No (this computation is public) | |||||||||||||||||||||||||||||
| User-defined keywords | ||||||||||||||||||||||||||||||
| Estimated Impact | 165 | |||||||||||||||||||||||||||||
Tree of Dependent Computations | ||||||||||||||||||||||||||||||
| Family? (F = Feedback message, R = changed R code, M = changed R Module, P = changed Parameters, D = changed Data) | ||||||||||||||||||||||||||||||
| - [Histogram and QQplot] [PY2224 Aston Work...] [2009-10-06 09:57:09] [98fd0e87c3eb04e0cc2efde01dbafab6] - P [Histogram and QQplot] [olivia friday] [2009-10-09 12:41:21] [3fdd735c61ad38cbc9b3393dc997cdb7] - RMPD [Histogram and QQplot] [Reddy Moores Hist...] [2009-10-09 13:23:16] [98fd0e87c3eb04e0cc2efde01dbafab6] - D [Histogram and QQPlot] [Histogram and QQ ...] [2009-12-16 15:50:52] [3fdd735c61ad38cbc9b3393dc997cdb7] - [Histogram and QQPlot (Reddy-Moores Data)] [Histogram & QQPlo...] [2010-12-05 18:15:34] [a213e16b9aee3f49d2cb9e790c69a2a0] - PD [Histogram and QQPlot (Reddy-Moores Data)] [SMK Mild] [2010-12-05 19:02:59] [3ea9f8c2b2d9956aa1d12a9e52402de5] [Current] - R D [Histogram and QQPlot (Reddy-Moores Data)] [RAD score - histo...] [2011-05-27 11:40:10] [f15c1d3d71c6e2d29ae45c04b0ae6886] - D [Histogram and QQPlot (Reddy-Moores Data)] [BPVT scores] [2011-05-27 11:45:49] [f15c1d3d71c6e2d29ae45c04b0ae6886] - [Histogram and QQPlot (Reddy-Moores Data)] [Histograms and QQ...] [2011-05-31 09:46:49] [f15c1d3d71c6e2d29ae45c04b0ae6886] - D [Histogram and QQPlot (Reddy-Moores Data)] [Female scores RAD] [2011-05-31 09:51:22] [f15c1d3d71c6e2d29ae45c04b0ae6886] - D [Histogram and QQPlot (Reddy-Moores Data)] [Boys scores RAD] [2011-05-31 09:52:34] [f15c1d3d71c6e2d29ae45c04b0ae6886] - PD [Histogram and QQPlot (Reddy-Moores Data)] [Outlier removed B...] [2011-05-31 10:04:57] [f15c1d3d71c6e2d29ae45c04b0ae6886] | ||||||||||||||||||||||||||||||
| Feedback Forum | ||||||||||||||||||||||||||||||
Post a new message | ||||||||||||||||||||||||||||||
Dataset | ||||||||||||||||||||||||||||||
| Dataseries X: | ||||||||||||||||||||||||||||||
2.9 4.9 3.9 1.9 6.9 0.9 3.9 3.9 6.9 3.9 2.9 2.9 2.9 2.9 1.9 4.9 4.9 2.9 5.9 1.9 | ||||||||||||||||||||||||||||||
Tables (Output of Computation) | ||||||||||||||||||||||||||||||
| ||||||||||||||||||||||||||||||
Figures (Output of Computation) | ||||||||||||||||||||||||||||||
Input Parameters & R Code | ||||||||||||||||||||||||||||||
| Parameters (Session): | ||||||||||||||||||||||||||||||
| par1 = 5 ; | ||||||||||||||||||||||||||||||
| Parameters (R input): | ||||||||||||||||||||||||||||||
| par1 = 5 ; | ||||||||||||||||||||||||||||||
| R code (references can be found in the software module): | ||||||||||||||||||||||||||||||
bitmap(file='test1.png') | ||||||||||||||||||||||||||||||