Free Statistics

of Irreproducible Research!

Author's title

Author*The author of this computation has been verified*
R Software Modulerwasp_autocorrelation.wasp
Title produced by software(Partial) Autocorrelation Function
Date of computationSun, 05 Dec 2010 16:02:56 +0000
Cite this page as followsStatistical Computations at FreeStatistics.org, Office for Research Development and Education, URL https://freestatistics.org/blog/index.php?v=date/2010/Dec/05/t12915648528qpk90newdz9b52.htm/, Retrieved Wed, 01 May 2024 22:26:21 +0000
Statistical Computations at FreeStatistics.org, Office for Research Development and Education, URL https://freestatistics.org/blog/index.php?pk=105436, Retrieved Wed, 01 May 2024 22:26:21 +0000
QR Codes:

Original text written by user:
IsPrivate?No (this computation is public)
User-defined keywords
Estimated Impact110
Family? (F = Feedback message, R = changed R code, M = changed R Module, P = changed Parameters, D = changed Data)
-     [Univariate Data Series] [data set] [2008-12-01 19:54:57] [b98453cac15ba1066b407e146608df68]
- RMP   [(Partial) Autocorrelation Function] [Unemployment] [2010-11-29 09:05:21] [b98453cac15ba1066b407e146608df68]
-   PD    [(Partial) Autocorrelation Function] [WS9 stationarity ...] [2010-12-03 13:43:54] [49c7a512c56172bc46ae7e93e5b58c1c]
-   P       [(Partial) Autocorrelation Function] [WS9 stationarity D=1] [2010-12-03 13:51:12] [49c7a512c56172bc46ae7e93e5b58c1c]
F               [(Partial) Autocorrelation Function] [WS9 stationarity D=1] [2010-12-05 16:02:56] [b4ba846736d082ffaee409a197f454c7] [Current]
Feedback Forum
2010-12-13 17:53:45 [Stefanie Van Esbroeck] [reply
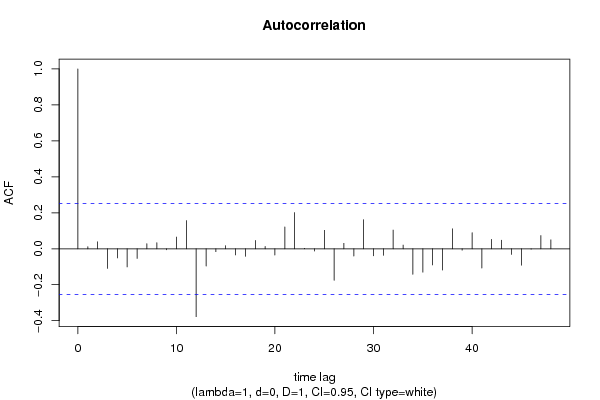
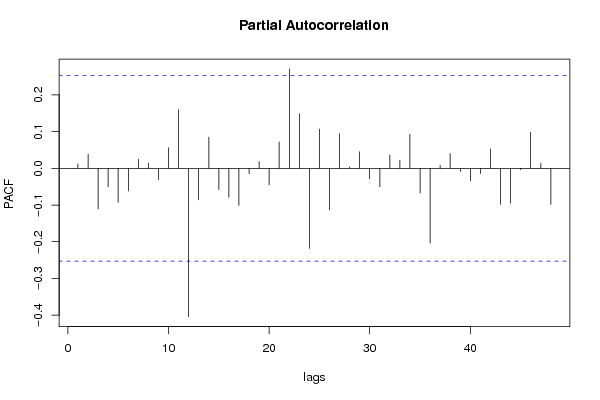
Je maakte ook hier een correcte berekening. Je interpretatie is naar de korte kant maar is wel volledig correct. Je had ook hier kunnen zeggen dat je weer naar de time lags 12,24,36 en 48 hebt gekeken. Een lange termijntrend valt ook op als je in de eerste 10 time lags een dalend verloop te zien is, wat hier duidelijk niet het geval is. Verder is de seizoenaliteit inderdaad verdwenen we zien geen duidelijk terugkerende structuur. Goed uitgewerkt model.

Post a new message
Dataseries X:
46
62
66
59
58
61
41
27
58
70
49
59
44
36
72
45
56
54
53
35
61
52
47
51
52
63
74
45
51
64
36
30
55
64
39
40
63
45
59
55
40
64
27
28
45
57
45
69
60
56
58
50
51
53
37
22
55
70
62
58
39
49
58
47
42
62
39
40
72
70
54
65


Summary of computational transaction
Raw Inputview raw input (R code)
Raw Outputview raw output of R engine
Computing time1 seconds
R Server'Gwilym Jenkins' @ 72.249.127.135

\begin{tabular}{lllllllll}
\hline
Summary of computational transaction \tabularnewline
Raw Input & view raw input (R code)  \tabularnewline
Raw Output & view raw output of R engine  \tabularnewline
Computing time & 1 seconds \tabularnewline
R Server & 'Gwilym Jenkins' @ 72.249.127.135 \tabularnewline
\hline
\end{tabular}
%Source: https://freestatistics.org/blog/index.php?pk=105436&T=0

[TABLE]
[ROW][C]Summary of computational transaction[/C][/ROW]
[ROW][C]Raw Input[/C][C]view raw input (R code) [/C][/ROW]
[ROW][C]Raw Output[/C][C]view raw output of R engine [/C][/ROW]
[ROW][C]Computing time[/C][C]1 seconds[/C][/ROW]
[ROW][C]R Server[/C][C]'Gwilym Jenkins' @ 72.249.127.135[/C][/ROW]
[/TABLE]
Source: https://freestatistics.org/blog/index.php?pk=105436&T=0

Globally Unique Identifier (entire table): ba.freestatistics.org/blog/index.php?pk=105436&T=0

As an alternative you can also use a QR Code:  

The GUIDs for individual cells are displayed in the table below:

Summary of computational transaction
Raw Inputview raw input (R code)
Raw Outputview raw output of R engine
Computing time1 seconds
R Server'Gwilym Jenkins' @ 72.249.127.135


Autocorrelation Function
Time lag kACF(k)T-STATP-value
10.0118710.0920.46352
20.0388380.30080.382289
3-0.109458-0.84790.199943
4-0.051329-0.39760.34617
5-0.100997-0.78230.218551
6-0.053604-0.41520.339734
70.0281010.21770.414214
80.033530.25970.397983
9-0.006097-0.04720.481245
100.0649770.50330.308294
110.1569071.21540.114488
12-0.377489-2.9240.002435
13-0.09635-0.74630.229193
14-0.016226-0.12570.450201
150.0168480.13050.448301
16-0.034247-0.26530.395853
17-0.041658-0.32270.37403
180.0465180.36030.359933
190.0130480.10110.459917
20-0.034798-0.26950.394217
210.1215210.94130.175162
220.2013181.55940.06208
230.0024690.01910.492404
24-0.012794-0.09910.460694
250.1028630.79680.214362
26-0.175247-1.35750.08986
270.0306530.23740.406564
28-0.040357-0.31260.377833
290.1617031.25250.107615
30-0.038844-0.30090.382273
31-0.036432-0.28220.38938
320.1044060.80870.210933
330.0205350.15910.437077
34-0.141926-1.09940.138002
35-0.130004-1.0070.158988
36-0.089845-0.69590.244578
37-0.118484-0.91780.181206
380.1110920.86050.196465
39-0.007568-0.05860.476723
400.0894590.69290.245509
41-0.107584-0.83330.203979
420.0522580.40480.343536
430.0474430.36750.357272
44-0.03135-0.24280.40448
45-0.091577-0.70940.240426
46-0.002297-0.01780.49293
470.0737110.5710.285078
480.0497690.38550.350612

\begin{tabular}{lllllllll}
\hline
Autocorrelation Function \tabularnewline
Time lag k & ACF(k) & T-STAT & P-value \tabularnewline
1 & 0.011871 & 0.092 & 0.46352 \tabularnewline
2 & 0.038838 & 0.3008 & 0.382289 \tabularnewline
3 & -0.109458 & -0.8479 & 0.199943 \tabularnewline
4 & -0.051329 & -0.3976 & 0.34617 \tabularnewline
5 & -0.100997 & -0.7823 & 0.218551 \tabularnewline
6 & -0.053604 & -0.4152 & 0.339734 \tabularnewline
7 & 0.028101 & 0.2177 & 0.414214 \tabularnewline
8 & 0.03353 & 0.2597 & 0.397983 \tabularnewline
9 & -0.006097 & -0.0472 & 0.481245 \tabularnewline
10 & 0.064977 & 0.5033 & 0.308294 \tabularnewline
11 & 0.156907 & 1.2154 & 0.114488 \tabularnewline
12 & -0.377489 & -2.924 & 0.002435 \tabularnewline
13 & -0.09635 & -0.7463 & 0.229193 \tabularnewline
14 & -0.016226 & -0.1257 & 0.450201 \tabularnewline
15 & 0.016848 & 0.1305 & 0.448301 \tabularnewline
16 & -0.034247 & -0.2653 & 0.395853 \tabularnewline
17 & -0.041658 & -0.3227 & 0.37403 \tabularnewline
18 & 0.046518 & 0.3603 & 0.359933 \tabularnewline
19 & 0.013048 & 0.1011 & 0.459917 \tabularnewline
20 & -0.034798 & -0.2695 & 0.394217 \tabularnewline
21 & 0.121521 & 0.9413 & 0.175162 \tabularnewline
22 & 0.201318 & 1.5594 & 0.06208 \tabularnewline
23 & 0.002469 & 0.0191 & 0.492404 \tabularnewline
24 & -0.012794 & -0.0991 & 0.460694 \tabularnewline
25 & 0.102863 & 0.7968 & 0.214362 \tabularnewline
26 & -0.175247 & -1.3575 & 0.08986 \tabularnewline
27 & 0.030653 & 0.2374 & 0.406564 \tabularnewline
28 & -0.040357 & -0.3126 & 0.377833 \tabularnewline
29 & 0.161703 & 1.2525 & 0.107615 \tabularnewline
30 & -0.038844 & -0.3009 & 0.382273 \tabularnewline
31 & -0.036432 & -0.2822 & 0.38938 \tabularnewline
32 & 0.104406 & 0.8087 & 0.210933 \tabularnewline
33 & 0.020535 & 0.1591 & 0.437077 \tabularnewline
34 & -0.141926 & -1.0994 & 0.138002 \tabularnewline
35 & -0.130004 & -1.007 & 0.158988 \tabularnewline
36 & -0.089845 & -0.6959 & 0.244578 \tabularnewline
37 & -0.118484 & -0.9178 & 0.181206 \tabularnewline
38 & 0.111092 & 0.8605 & 0.196465 \tabularnewline
39 & -0.007568 & -0.0586 & 0.476723 \tabularnewline
40 & 0.089459 & 0.6929 & 0.245509 \tabularnewline
41 & -0.107584 & -0.8333 & 0.203979 \tabularnewline
42 & 0.052258 & 0.4048 & 0.343536 \tabularnewline
43 & 0.047443 & 0.3675 & 0.357272 \tabularnewline
44 & -0.03135 & -0.2428 & 0.40448 \tabularnewline
45 & -0.091577 & -0.7094 & 0.240426 \tabularnewline
46 & -0.002297 & -0.0178 & 0.49293 \tabularnewline
47 & 0.073711 & 0.571 & 0.285078 \tabularnewline
48 & 0.049769 & 0.3855 & 0.350612 \tabularnewline
\hline
\end{tabular}
%Source: https://freestatistics.org/blog/index.php?pk=105436&T=1

[TABLE]
[ROW][C]Autocorrelation Function[/C][/ROW]
[ROW][C]Time lag k[/C][C]ACF(k)[/C][C]T-STAT[/C][C]P-value[/C][/ROW]
[ROW][C]1[/C][C]0.011871[/C][C]0.092[/C][C]0.46352[/C][/ROW]
[ROW][C]2[/C][C]0.038838[/C][C]0.3008[/C][C]0.382289[/C][/ROW]
[ROW][C]3[/C][C]-0.109458[/C][C]-0.8479[/C][C]0.199943[/C][/ROW]
[ROW][C]4[/C][C]-0.051329[/C][C]-0.3976[/C][C]0.34617[/C][/ROW]
[ROW][C]5[/C][C]-0.100997[/C][C]-0.7823[/C][C]0.218551[/C][/ROW]
[ROW][C]6[/C][C]-0.053604[/C][C]-0.4152[/C][C]0.339734[/C][/ROW]
[ROW][C]7[/C][C]0.028101[/C][C]0.2177[/C][C]0.414214[/C][/ROW]
[ROW][C]8[/C][C]0.03353[/C][C]0.2597[/C][C]0.397983[/C][/ROW]
[ROW][C]9[/C][C]-0.006097[/C][C]-0.0472[/C][C]0.481245[/C][/ROW]
[ROW][C]10[/C][C]0.064977[/C][C]0.5033[/C][C]0.308294[/C][/ROW]
[ROW][C]11[/C][C]0.156907[/C][C]1.2154[/C][C]0.114488[/C][/ROW]
[ROW][C]12[/C][C]-0.377489[/C][C]-2.924[/C][C]0.002435[/C][/ROW]
[ROW][C]13[/C][C]-0.09635[/C][C]-0.7463[/C][C]0.229193[/C][/ROW]
[ROW][C]14[/C][C]-0.016226[/C][C]-0.1257[/C][C]0.450201[/C][/ROW]
[ROW][C]15[/C][C]0.016848[/C][C]0.1305[/C][C]0.448301[/C][/ROW]
[ROW][C]16[/C][C]-0.034247[/C][C]-0.2653[/C][C]0.395853[/C][/ROW]
[ROW][C]17[/C][C]-0.041658[/C][C]-0.3227[/C][C]0.37403[/C][/ROW]
[ROW][C]18[/C][C]0.046518[/C][C]0.3603[/C][C]0.359933[/C][/ROW]
[ROW][C]19[/C][C]0.013048[/C][C]0.1011[/C][C]0.459917[/C][/ROW]
[ROW][C]20[/C][C]-0.034798[/C][C]-0.2695[/C][C]0.394217[/C][/ROW]
[ROW][C]21[/C][C]0.121521[/C][C]0.9413[/C][C]0.175162[/C][/ROW]
[ROW][C]22[/C][C]0.201318[/C][C]1.5594[/C][C]0.06208[/C][/ROW]
[ROW][C]23[/C][C]0.002469[/C][C]0.0191[/C][C]0.492404[/C][/ROW]
[ROW][C]24[/C][C]-0.012794[/C][C]-0.0991[/C][C]0.460694[/C][/ROW]
[ROW][C]25[/C][C]0.102863[/C][C]0.7968[/C][C]0.214362[/C][/ROW]
[ROW][C]26[/C][C]-0.175247[/C][C]-1.3575[/C][C]0.08986[/C][/ROW]
[ROW][C]27[/C][C]0.030653[/C][C]0.2374[/C][C]0.406564[/C][/ROW]
[ROW][C]28[/C][C]-0.040357[/C][C]-0.3126[/C][C]0.377833[/C][/ROW]
[ROW][C]29[/C][C]0.161703[/C][C]1.2525[/C][C]0.107615[/C][/ROW]
[ROW][C]30[/C][C]-0.038844[/C][C]-0.3009[/C][C]0.382273[/C][/ROW]
[ROW][C]31[/C][C]-0.036432[/C][C]-0.2822[/C][C]0.38938[/C][/ROW]
[ROW][C]32[/C][C]0.104406[/C][C]0.8087[/C][C]0.210933[/C][/ROW]
[ROW][C]33[/C][C]0.020535[/C][C]0.1591[/C][C]0.437077[/C][/ROW]
[ROW][C]34[/C][C]-0.141926[/C][C]-1.0994[/C][C]0.138002[/C][/ROW]
[ROW][C]35[/C][C]-0.130004[/C][C]-1.007[/C][C]0.158988[/C][/ROW]
[ROW][C]36[/C][C]-0.089845[/C][C]-0.6959[/C][C]0.244578[/C][/ROW]
[ROW][C]37[/C][C]-0.118484[/C][C]-0.9178[/C][C]0.181206[/C][/ROW]
[ROW][C]38[/C][C]0.111092[/C][C]0.8605[/C][C]0.196465[/C][/ROW]
[ROW][C]39[/C][C]-0.007568[/C][C]-0.0586[/C][C]0.476723[/C][/ROW]
[ROW][C]40[/C][C]0.089459[/C][C]0.6929[/C][C]0.245509[/C][/ROW]
[ROW][C]41[/C][C]-0.107584[/C][C]-0.8333[/C][C]0.203979[/C][/ROW]
[ROW][C]42[/C][C]0.052258[/C][C]0.4048[/C][C]0.343536[/C][/ROW]
[ROW][C]43[/C][C]0.047443[/C][C]0.3675[/C][C]0.357272[/C][/ROW]
[ROW][C]44[/C][C]-0.03135[/C][C]-0.2428[/C][C]0.40448[/C][/ROW]
[ROW][C]45[/C][C]-0.091577[/C][C]-0.7094[/C][C]0.240426[/C][/ROW]
[ROW][C]46[/C][C]-0.002297[/C][C]-0.0178[/C][C]0.49293[/C][/ROW]
[ROW][C]47[/C][C]0.073711[/C][C]0.571[/C][C]0.285078[/C][/ROW]
[ROW][C]48[/C][C]0.049769[/C][C]0.3855[/C][C]0.350612[/C][/ROW]
[/TABLE]
Source: https://freestatistics.org/blog/index.php?pk=105436&T=1

Globally Unique Identifier (entire table): ba.freestatistics.org/blog/index.php?pk=105436&T=1

As an alternative you can also use a QR Code:  

The GUIDs for individual cells are displayed in the table below:

Autocorrelation Function
Time lag kACF(k)T-STATP-value
10.0118710.0920.46352
20.0388380.30080.382289
3-0.109458-0.84790.199943
4-0.051329-0.39760.34617
5-0.100997-0.78230.218551
6-0.053604-0.41520.339734
70.0281010.21770.414214
80.033530.25970.397983
9-0.006097-0.04720.481245
100.0649770.50330.308294
110.1569071.21540.114488
12-0.377489-2.9240.002435
13-0.09635-0.74630.229193
14-0.016226-0.12570.450201
150.0168480.13050.448301
16-0.034247-0.26530.395853
17-0.041658-0.32270.37403
180.0465180.36030.359933
190.0130480.10110.459917
20-0.034798-0.26950.394217
210.1215210.94130.175162
220.2013181.55940.06208
230.0024690.01910.492404
24-0.012794-0.09910.460694
250.1028630.79680.214362
26-0.175247-1.35750.08986
270.0306530.23740.406564
28-0.040357-0.31260.377833
290.1617031.25250.107615
30-0.038844-0.30090.382273
31-0.036432-0.28220.38938
320.1044060.80870.210933
330.0205350.15910.437077
34-0.141926-1.09940.138002
35-0.130004-1.0070.158988
36-0.089845-0.69590.244578
37-0.118484-0.91780.181206
380.1110920.86050.196465
39-0.007568-0.05860.476723
400.0894590.69290.245509
41-0.107584-0.83330.203979
420.0522580.40480.343536
430.0474430.36750.357272
44-0.03135-0.24280.40448
45-0.091577-0.70940.240426
46-0.002297-0.01780.49293
470.0737110.5710.285078
480.0497690.38550.350612


Partial Autocorrelation Function
Time lag kPACF(k)T-STATP-value
10.0118710.0920.46352
20.0387030.29980.382687
3-0.110542-0.85630.197632
4-0.050551-0.39160.348382
5-0.092534-0.71680.238149
6-0.061508-0.47640.317745
70.0250320.19390.423457
80.0139560.10810.457137
9-0.030892-0.23930.405848
100.0561540.4350.332573
110.1597281.23720.110408
12-0.404385-3.13240.00134
13-0.085833-0.66490.254343
140.0852240.66010.255844
15-0.058001-0.44930.327428
16-0.078982-0.61180.271493
17-0.101249-0.78430.217984
18-0.014741-0.11420.454737
190.0186150.14420.442918
20-0.044979-0.34840.364376
210.0715690.55440.290692
220.2709462.09870.020028
230.1488741.15320.126707
24-0.218469-1.69230.047892
250.1068920.8280.20548
26-0.112728-0.87320.193021
270.095170.73720.231942
280.003770.02920.488399
290.0449510.34820.364458
30-0.028402-0.220.413309
31-0.050087-0.3880.349705
320.0364450.28230.389341
330.0220790.1710.432389
340.0927040.71810.237748
35-0.06715-0.52010.30244
36-0.203944-1.57970.059712
370.0081320.0630.47499
380.0403830.31280.377756
39-0.008698-0.06740.473255
40-0.033694-0.2610.397496
41-0.014272-0.11060.456171
420.0524120.4060.343101
43-0.09859-0.76370.224028
44-0.09507-0.73640.232176
45-0.004163-0.03220.487192
460.0981840.76050.224959
470.014080.10910.456759
48-0.098513-0.76310.224203

\begin{tabular}{lllllllll}
\hline
Partial Autocorrelation Function \tabularnewline
Time lag k & PACF(k) & T-STAT & P-value \tabularnewline
1 & 0.011871 & 0.092 & 0.46352 \tabularnewline
2 & 0.038703 & 0.2998 & 0.382687 \tabularnewline
3 & -0.110542 & -0.8563 & 0.197632 \tabularnewline
4 & -0.050551 & -0.3916 & 0.348382 \tabularnewline
5 & -0.092534 & -0.7168 & 0.238149 \tabularnewline
6 & -0.061508 & -0.4764 & 0.317745 \tabularnewline
7 & 0.025032 & 0.1939 & 0.423457 \tabularnewline
8 & 0.013956 & 0.1081 & 0.457137 \tabularnewline
9 & -0.030892 & -0.2393 & 0.405848 \tabularnewline
10 & 0.056154 & 0.435 & 0.332573 \tabularnewline
11 & 0.159728 & 1.2372 & 0.110408 \tabularnewline
12 & -0.404385 & -3.1324 & 0.00134 \tabularnewline
13 & -0.085833 & -0.6649 & 0.254343 \tabularnewline
14 & 0.085224 & 0.6601 & 0.255844 \tabularnewline
15 & -0.058001 & -0.4493 & 0.327428 \tabularnewline
16 & -0.078982 & -0.6118 & 0.271493 \tabularnewline
17 & -0.101249 & -0.7843 & 0.217984 \tabularnewline
18 & -0.014741 & -0.1142 & 0.454737 \tabularnewline
19 & 0.018615 & 0.1442 & 0.442918 \tabularnewline
20 & -0.044979 & -0.3484 & 0.364376 \tabularnewline
21 & 0.071569 & 0.5544 & 0.290692 \tabularnewline
22 & 0.270946 & 2.0987 & 0.020028 \tabularnewline
23 & 0.148874 & 1.1532 & 0.126707 \tabularnewline
24 & -0.218469 & -1.6923 & 0.047892 \tabularnewline
25 & 0.106892 & 0.828 & 0.20548 \tabularnewline
26 & -0.112728 & -0.8732 & 0.193021 \tabularnewline
27 & 0.09517 & 0.7372 & 0.231942 \tabularnewline
28 & 0.00377 & 0.0292 & 0.488399 \tabularnewline
29 & 0.044951 & 0.3482 & 0.364458 \tabularnewline
30 & -0.028402 & -0.22 & 0.413309 \tabularnewline
31 & -0.050087 & -0.388 & 0.349705 \tabularnewline
32 & 0.036445 & 0.2823 & 0.389341 \tabularnewline
33 & 0.022079 & 0.171 & 0.432389 \tabularnewline
34 & 0.092704 & 0.7181 & 0.237748 \tabularnewline
35 & -0.06715 & -0.5201 & 0.30244 \tabularnewline
36 & -0.203944 & -1.5797 & 0.059712 \tabularnewline
37 & 0.008132 & 0.063 & 0.47499 \tabularnewline
38 & 0.040383 & 0.3128 & 0.377756 \tabularnewline
39 & -0.008698 & -0.0674 & 0.473255 \tabularnewline
40 & -0.033694 & -0.261 & 0.397496 \tabularnewline
41 & -0.014272 & -0.1106 & 0.456171 \tabularnewline
42 & 0.052412 & 0.406 & 0.343101 \tabularnewline
43 & -0.09859 & -0.7637 & 0.224028 \tabularnewline
44 & -0.09507 & -0.7364 & 0.232176 \tabularnewline
45 & -0.004163 & -0.0322 & 0.487192 \tabularnewline
46 & 0.098184 & 0.7605 & 0.224959 \tabularnewline
47 & 0.01408 & 0.1091 & 0.456759 \tabularnewline
48 & -0.098513 & -0.7631 & 0.224203 \tabularnewline
\hline
\end{tabular}
%Source: https://freestatistics.org/blog/index.php?pk=105436&T=2

[TABLE]
[ROW][C]Partial Autocorrelation Function[/C][/ROW]
[ROW][C]Time lag k[/C][C]PACF(k)[/C][C]T-STAT[/C][C]P-value[/C][/ROW]
[ROW][C]1[/C][C]0.011871[/C][C]0.092[/C][C]0.46352[/C][/ROW]
[ROW][C]2[/C][C]0.038703[/C][C]0.2998[/C][C]0.382687[/C][/ROW]
[ROW][C]3[/C][C]-0.110542[/C][C]-0.8563[/C][C]0.197632[/C][/ROW]
[ROW][C]4[/C][C]-0.050551[/C][C]-0.3916[/C][C]0.348382[/C][/ROW]
[ROW][C]5[/C][C]-0.092534[/C][C]-0.7168[/C][C]0.238149[/C][/ROW]
[ROW][C]6[/C][C]-0.061508[/C][C]-0.4764[/C][C]0.317745[/C][/ROW]
[ROW][C]7[/C][C]0.025032[/C][C]0.1939[/C][C]0.423457[/C][/ROW]
[ROW][C]8[/C][C]0.013956[/C][C]0.1081[/C][C]0.457137[/C][/ROW]
[ROW][C]9[/C][C]-0.030892[/C][C]-0.2393[/C][C]0.405848[/C][/ROW]
[ROW][C]10[/C][C]0.056154[/C][C]0.435[/C][C]0.332573[/C][/ROW]
[ROW][C]11[/C][C]0.159728[/C][C]1.2372[/C][C]0.110408[/C][/ROW]
[ROW][C]12[/C][C]-0.404385[/C][C]-3.1324[/C][C]0.00134[/C][/ROW]
[ROW][C]13[/C][C]-0.085833[/C][C]-0.6649[/C][C]0.254343[/C][/ROW]
[ROW][C]14[/C][C]0.085224[/C][C]0.6601[/C][C]0.255844[/C][/ROW]
[ROW][C]15[/C][C]-0.058001[/C][C]-0.4493[/C][C]0.327428[/C][/ROW]
[ROW][C]16[/C][C]-0.078982[/C][C]-0.6118[/C][C]0.271493[/C][/ROW]
[ROW][C]17[/C][C]-0.101249[/C][C]-0.7843[/C][C]0.217984[/C][/ROW]
[ROW][C]18[/C][C]-0.014741[/C][C]-0.1142[/C][C]0.454737[/C][/ROW]
[ROW][C]19[/C][C]0.018615[/C][C]0.1442[/C][C]0.442918[/C][/ROW]
[ROW][C]20[/C][C]-0.044979[/C][C]-0.3484[/C][C]0.364376[/C][/ROW]
[ROW][C]21[/C][C]0.071569[/C][C]0.5544[/C][C]0.290692[/C][/ROW]
[ROW][C]22[/C][C]0.270946[/C][C]2.0987[/C][C]0.020028[/C][/ROW]
[ROW][C]23[/C][C]0.148874[/C][C]1.1532[/C][C]0.126707[/C][/ROW]
[ROW][C]24[/C][C]-0.218469[/C][C]-1.6923[/C][C]0.047892[/C][/ROW]
[ROW][C]25[/C][C]0.106892[/C][C]0.828[/C][C]0.20548[/C][/ROW]
[ROW][C]26[/C][C]-0.112728[/C][C]-0.8732[/C][C]0.193021[/C][/ROW]
[ROW][C]27[/C][C]0.09517[/C][C]0.7372[/C][C]0.231942[/C][/ROW]
[ROW][C]28[/C][C]0.00377[/C][C]0.0292[/C][C]0.488399[/C][/ROW]
[ROW][C]29[/C][C]0.044951[/C][C]0.3482[/C][C]0.364458[/C][/ROW]
[ROW][C]30[/C][C]-0.028402[/C][C]-0.22[/C][C]0.413309[/C][/ROW]
[ROW][C]31[/C][C]-0.050087[/C][C]-0.388[/C][C]0.349705[/C][/ROW]
[ROW][C]32[/C][C]0.036445[/C][C]0.2823[/C][C]0.389341[/C][/ROW]
[ROW][C]33[/C][C]0.022079[/C][C]0.171[/C][C]0.432389[/C][/ROW]
[ROW][C]34[/C][C]0.092704[/C][C]0.7181[/C][C]0.237748[/C][/ROW]
[ROW][C]35[/C][C]-0.06715[/C][C]-0.5201[/C][C]0.30244[/C][/ROW]
[ROW][C]36[/C][C]-0.203944[/C][C]-1.5797[/C][C]0.059712[/C][/ROW]
[ROW][C]37[/C][C]0.008132[/C][C]0.063[/C][C]0.47499[/C][/ROW]
[ROW][C]38[/C][C]0.040383[/C][C]0.3128[/C][C]0.377756[/C][/ROW]
[ROW][C]39[/C][C]-0.008698[/C][C]-0.0674[/C][C]0.473255[/C][/ROW]
[ROW][C]40[/C][C]-0.033694[/C][C]-0.261[/C][C]0.397496[/C][/ROW]
[ROW][C]41[/C][C]-0.014272[/C][C]-0.1106[/C][C]0.456171[/C][/ROW]
[ROW][C]42[/C][C]0.052412[/C][C]0.406[/C][C]0.343101[/C][/ROW]
[ROW][C]43[/C][C]-0.09859[/C][C]-0.7637[/C][C]0.224028[/C][/ROW]
[ROW][C]44[/C][C]-0.09507[/C][C]-0.7364[/C][C]0.232176[/C][/ROW]
[ROW][C]45[/C][C]-0.004163[/C][C]-0.0322[/C][C]0.487192[/C][/ROW]
[ROW][C]46[/C][C]0.098184[/C][C]0.7605[/C][C]0.224959[/C][/ROW]
[ROW][C]47[/C][C]0.01408[/C][C]0.1091[/C][C]0.456759[/C][/ROW]
[ROW][C]48[/C][C]-0.098513[/C][C]-0.7631[/C][C]0.224203[/C][/ROW]
[/TABLE]
Source: https://freestatistics.org/blog/index.php?pk=105436&T=2

Globally Unique Identifier (entire table): ba.freestatistics.org/blog/index.php?pk=105436&T=2

As an alternative you can also use a QR Code:  

The GUIDs for individual cells are displayed in the table below:

Partial Autocorrelation Function
Time lag kPACF(k)T-STATP-value
10.0118710.0920.46352
20.0387030.29980.382687
3-0.110542-0.85630.197632
4-0.050551-0.39160.348382
5-0.092534-0.71680.238149
6-0.061508-0.47640.317745
70.0250320.19390.423457
80.0139560.10810.457137
9-0.030892-0.23930.405848
100.0561540.4350.332573
110.1597281.23720.110408
12-0.404385-3.13240.00134
13-0.085833-0.66490.254343
140.0852240.66010.255844
15-0.058001-0.44930.327428
16-0.078982-0.61180.271493
17-0.101249-0.78430.217984
18-0.014741-0.11420.454737
190.0186150.14420.442918
20-0.044979-0.34840.364376
210.0715690.55440.290692
220.2709462.09870.020028
230.1488741.15320.126707
24-0.218469-1.69230.047892
250.1068920.8280.20548
26-0.112728-0.87320.193021
270.095170.73720.231942
280.003770.02920.488399
290.0449510.34820.364458
30-0.028402-0.220.413309
31-0.050087-0.3880.349705
320.0364450.28230.389341
330.0220790.1710.432389
340.0927040.71810.237748
35-0.06715-0.52010.30244
36-0.203944-1.57970.059712
370.0081320.0630.47499
380.0403830.31280.377756
39-0.008698-0.06740.473255
40-0.033694-0.2610.397496
41-0.014272-0.11060.456171
420.0524120.4060.343101
43-0.09859-0.76370.224028
44-0.09507-0.73640.232176
45-0.004163-0.03220.487192
460.0981840.76050.224959
470.014080.10910.456759
48-0.098513-0.76310.224203


Parameters (Session):
par1 = 48 ; par2 = 1 ; par3 = 0 ; par4 = 1 ; par5 = 12 ; par6 = White Noise ; par7 = 0.95 ;
Parameters (R input):
par1 = 48 ; par2 = 1 ; par3 = 0 ; par4 = 1 ; par5 = 12 ; par6 = White Noise ; par7 = 0.95 ;
R code (references can be found in the software module):
if (par1 == 'Default') {
par1 = 10*log10(length(x))
} else {
par1 <- as.numeric(par1)
}
par2 <- as.numeric(par2)
par3 <- as.numeric(par3)
par4 <- as.numeric(par4)
par5 <- as.numeric(par5)
if (par6 == 'White Noise') par6 <- 'white' else par6 <- 'ma'
par7 <- as.numeric(par7)
if (par2 == 0) {
x <- log(x)
} else {
x <- (x ^ par2 - 1) / par2
}
if (par3 > 0) x <- diff(x,lag=1,difference=par3)
if (par4 > 0) x <- diff(x,lag=par5,difference=par4)
bitmap(file='pic1.png')
racf <- acf(x, par1, main='Autocorrelation', xlab='time lag', ylab='ACF', ci.type=par6, ci=par7, sub=paste('(lambda=',par2,', d=',par3,', D=',par4,', CI=', par7, ', CI type=',par6,')',sep=''))
dev.off()
bitmap(file='pic2.png')
rpacf <- pacf(x,par1,main='Partial Autocorrelation',xlab='lags',ylab='PACF')
dev.off()
(myacf <- c(racf$acf))
(mypacf <- c(rpacf$acf))
lengthx <- length(x)
sqrtn <- sqrt(lengthx)
load(file='createtable')
a<-table.start()
a<-table.row.start(a)
a<-table.element(a,'Autocorrelation Function',4,TRUE)
a<-table.row.end(a)
a<-table.row.start(a)
a<-table.element(a,'Time lag k',header=TRUE)
a<-table.element(a,hyperlink('basics.htm','ACF(k)','click here for more information about the Autocorrelation Function'),header=TRUE)
a<-table.element(a,'T-STAT',header=TRUE)
a<-table.element(a,'P-value',header=TRUE)
a<-table.row.end(a)
for (i in 2:(par1+1)) {
a<-table.row.start(a)
a<-table.element(a,i-1,header=TRUE)
a<-table.element(a,round(myacf[i],6))
mytstat <- myacf[i]*sqrtn
a<-table.element(a,round(mytstat,4))
a<-table.element(a,round(1-pt(abs(mytstat),lengthx),6))
a<-table.row.end(a)
}
a<-table.end(a)
table.save(a,file='mytable.tab')
a<-table.start()
a<-table.row.start(a)
a<-table.element(a,'Partial Autocorrelation Function',4,TRUE)
a<-table.row.end(a)
a<-table.row.start(a)
a<-table.element(a,'Time lag k',header=TRUE)
a<-table.element(a,hyperlink('basics.htm','PACF(k)','click here for more information about the Partial Autocorrelation Function'),header=TRUE)
a<-table.element(a,'T-STAT',header=TRUE)
a<-table.element(a,'P-value',header=TRUE)
a<-table.row.end(a)
for (i in 1:par1) {
a<-table.row.start(a)
a<-table.element(a,i,header=TRUE)
a<-table.element(a,round(mypacf[i],6))
mytstat <- mypacf[i]*sqrtn
a<-table.element(a,round(mytstat,4))
a<-table.element(a,round(1-pt(abs(mytstat),lengthx),6))
a<-table.row.end(a)
}
a<-table.end(a)
table.save(a,file='mytable1.tab')