Free Statistics

of Irreproducible Research!

Author's title

Author*The author of this computation has been verified*
R Software Modulerwasp_autocorrelation.wasp
Title produced by software(Partial) Autocorrelation Function
Date of computationSun, 05 Dec 2010 16:00:48 +0000
Cite this page as followsStatistical Computations at FreeStatistics.org, Office for Research Development and Education, URL https://freestatistics.org/blog/index.php?v=date/2010/Dec/05/t1291564743cbc1myujmtzwtgm.htm/, Retrieved Wed, 01 May 2024 22:34:45 +0000
Statistical Computations at FreeStatistics.org, Office for Research Development and Education, URL https://freestatistics.org/blog/index.php?pk=105435, Retrieved Wed, 01 May 2024 22:34:45 +0000
QR Codes:

Original text written by user:
IsPrivate?No (this computation is public)
User-defined keywords
Estimated Impact114
Family? (F = Feedback message, R = changed R code, M = changed R Module, P = changed Parameters, D = changed Data)
-     [Univariate Data Series] [data set] [2008-12-01 19:54:57] [b98453cac15ba1066b407e146608df68]
- RMP   [(Partial) Autocorrelation Function] [Unemployment] [2010-11-29 09:05:21] [b98453cac15ba1066b407e146608df68]
-   PD    [(Partial) Autocorrelation Function] [WS9 stationarity ...] [2010-12-03 13:43:54] [49c7a512c56172bc46ae7e93e5b58c1c]
F             [(Partial) Autocorrelation Function] [WS9 stationarity ...] [2010-12-05 16:00:48] [b4ba846736d082ffaee409a197f454c7] [Current]
Feedback Forum
2010-12-13 17:49:41 [Stefanie Van Esbroeck] [reply
Je maakte hier een correcte berekening en je paste bovendien alle parameters correct aan. Je hebt goed opgemerkt dat je de time lags op 48 moest zetten om zo een duidelijk beeld te kunnen verkrijgen op de autocorrelatiefunctie en om zo ook samenhangend een goed onderbouwde en correcte interpretatie te kunnen geven aan de output. Dit is dus zeker een goed uitgewerkt model. Goed gedaan.

Post a new message
Dataseries X:
46
62
66
59
58
61
41
27
58
70
49
59
44
36
72
45
56
54
53
35
61
52
47
51
52
63
74
45
51
64
36
30
55
64
39
40
63
45
59
55
40
64
27
28
45
57
45
69
60
56
58
50
51
53
37
22
55
70
62
58
39
49
58
47
42
62
39
40
72
70
54
65


Summary of computational transaction
Raw Inputview raw input (R code)
Raw Outputview raw output of R engine
Computing time4 seconds
R Server'Sir Ronald Aylmer Fisher' @ 193.190.124.24

\begin{tabular}{lllllllll}
\hline
Summary of computational transaction \tabularnewline
Raw Input & view raw input (R code)  \tabularnewline
Raw Output & view raw output of R engine  \tabularnewline
Computing time & 4 seconds \tabularnewline
R Server & 'Sir Ronald Aylmer Fisher' @ 193.190.124.24 \tabularnewline
\hline
\end{tabular}
%Source: https://freestatistics.org/blog/index.php?pk=105435&T=0

[TABLE]
[ROW][C]Summary of computational transaction[/C][/ROW]
[ROW][C]Raw Input[/C][C]view raw input (R code) [/C][/ROW]
[ROW][C]Raw Output[/C][C]view raw output of R engine [/C][/ROW]
[ROW][C]Computing time[/C][C]4 seconds[/C][/ROW]
[ROW][C]R Server[/C][C]'Sir Ronald Aylmer Fisher' @ 193.190.124.24[/C][/ROW]
[/TABLE]
Source: https://freestatistics.org/blog/index.php?pk=105435&T=0

Globally Unique Identifier (entire table): ba.freestatistics.org/blog/index.php?pk=105435&T=0

As an alternative you can also use a QR Code:  

The GUIDs for individual cells are displayed in the table below:

Summary of computational transaction
Raw Inputview raw input (R code)
Raw Outputview raw output of R engine
Computing time4 seconds
R Server'Sir Ronald Aylmer Fisher' @ 193.190.124.24


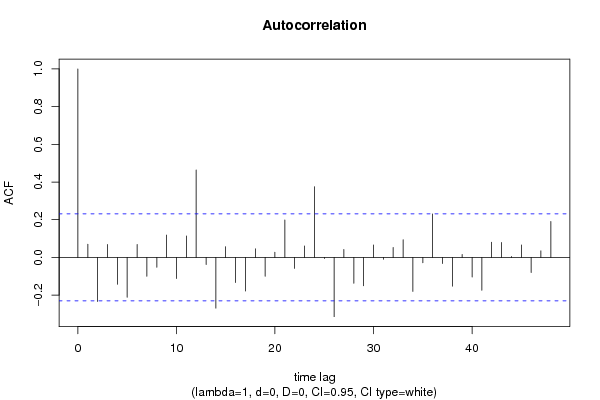
Autocorrelation Function
Time lag kACF(k)T-STATP-value
10.0703190.59670.276298
2-0.233976-1.98540.025457
30.0681120.57790.282551
4-0.142495-1.20910.115287
5-0.211961-1.79850.038141
60.0689130.58470.280274
7-0.1007-0.85450.19784
8-0.052042-0.44160.330054
90.1182471.00340.159524
10-0.112644-0.95580.171181
110.1140180.96750.168272
120.463813.93569.5e-05
13-0.037397-0.31730.375959
14-0.269423-2.28610.012595
150.0568020.4820.31564
16-0.133191-1.13020.131079
17-0.178608-1.51550.067008
180.0454740.38590.35037
19-0.100472-0.85250.198372
200.0273680.23220.408511
210.1988891.68760.047905
22-0.058314-0.49480.311119
230.0607590.51560.303871
240.3752223.18390.001074
25-0.006121-0.05190.47936
26-0.314443-2.66810.004708
270.0421740.35790.360748
28-0.137051-1.16290.124352
29-0.150481-1.27690.102875
300.0655780.55650.289814
31-0.009984-0.08470.466361
320.0529740.44950.327212
330.0935410.79370.214982
34-0.180338-1.53020.065172
35-0.028908-0.24530.403465
360.2302081.95340.02733
37-0.032572-0.27640.391522
38-0.152625-1.29510.099718
390.0152720.12960.448628
40-0.104499-0.88670.189096
41-0.174528-1.48090.071495
420.0807340.68510.247756
430.0793360.67320.25149
440.0046320.03930.484379
450.0656730.55720.289543
46-0.079988-0.67870.249746
470.0348130.29540.384269
480.1904441.6160.055237

\begin{tabular}{lllllllll}
\hline
Autocorrelation Function \tabularnewline
Time lag k & ACF(k) & T-STAT & P-value \tabularnewline
1 & 0.070319 & 0.5967 & 0.276298 \tabularnewline
2 & -0.233976 & -1.9854 & 0.025457 \tabularnewline
3 & 0.068112 & 0.5779 & 0.282551 \tabularnewline
4 & -0.142495 & -1.2091 & 0.115287 \tabularnewline
5 & -0.211961 & -1.7985 & 0.038141 \tabularnewline
6 & 0.068913 & 0.5847 & 0.280274 \tabularnewline
7 & -0.1007 & -0.8545 & 0.19784 \tabularnewline
8 & -0.052042 & -0.4416 & 0.330054 \tabularnewline
9 & 0.118247 & 1.0034 & 0.159524 \tabularnewline
10 & -0.112644 & -0.9558 & 0.171181 \tabularnewline
11 & 0.114018 & 0.9675 & 0.168272 \tabularnewline
12 & 0.46381 & 3.9356 & 9.5e-05 \tabularnewline
13 & -0.037397 & -0.3173 & 0.375959 \tabularnewline
14 & -0.269423 & -2.2861 & 0.012595 \tabularnewline
15 & 0.056802 & 0.482 & 0.31564 \tabularnewline
16 & -0.133191 & -1.1302 & 0.131079 \tabularnewline
17 & -0.178608 & -1.5155 & 0.067008 \tabularnewline
18 & 0.045474 & 0.3859 & 0.35037 \tabularnewline
19 & -0.100472 & -0.8525 & 0.198372 \tabularnewline
20 & 0.027368 & 0.2322 & 0.408511 \tabularnewline
21 & 0.198889 & 1.6876 & 0.047905 \tabularnewline
22 & -0.058314 & -0.4948 & 0.311119 \tabularnewline
23 & 0.060759 & 0.5156 & 0.303871 \tabularnewline
24 & 0.375222 & 3.1839 & 0.001074 \tabularnewline
25 & -0.006121 & -0.0519 & 0.47936 \tabularnewline
26 & -0.314443 & -2.6681 & 0.004708 \tabularnewline
27 & 0.042174 & 0.3579 & 0.360748 \tabularnewline
28 & -0.137051 & -1.1629 & 0.124352 \tabularnewline
29 & -0.150481 & -1.2769 & 0.102875 \tabularnewline
30 & 0.065578 & 0.5565 & 0.289814 \tabularnewline
31 & -0.009984 & -0.0847 & 0.466361 \tabularnewline
32 & 0.052974 & 0.4495 & 0.327212 \tabularnewline
33 & 0.093541 & 0.7937 & 0.214982 \tabularnewline
34 & -0.180338 & -1.5302 & 0.065172 \tabularnewline
35 & -0.028908 & -0.2453 & 0.403465 \tabularnewline
36 & 0.230208 & 1.9534 & 0.02733 \tabularnewline
37 & -0.032572 & -0.2764 & 0.391522 \tabularnewline
38 & -0.152625 & -1.2951 & 0.099718 \tabularnewline
39 & 0.015272 & 0.1296 & 0.448628 \tabularnewline
40 & -0.104499 & -0.8867 & 0.189096 \tabularnewline
41 & -0.174528 & -1.4809 & 0.071495 \tabularnewline
42 & 0.080734 & 0.6851 & 0.247756 \tabularnewline
43 & 0.079336 & 0.6732 & 0.25149 \tabularnewline
44 & 0.004632 & 0.0393 & 0.484379 \tabularnewline
45 & 0.065673 & 0.5572 & 0.289543 \tabularnewline
46 & -0.079988 & -0.6787 & 0.249746 \tabularnewline
47 & 0.034813 & 0.2954 & 0.384269 \tabularnewline
48 & 0.190444 & 1.616 & 0.055237 \tabularnewline
\hline
\end{tabular}
%Source: https://freestatistics.org/blog/index.php?pk=105435&T=1

[TABLE]
[ROW][C]Autocorrelation Function[/C][/ROW]
[ROW][C]Time lag k[/C][C]ACF(k)[/C][C]T-STAT[/C][C]P-value[/C][/ROW]
[ROW][C]1[/C][C]0.070319[/C][C]0.5967[/C][C]0.276298[/C][/ROW]
[ROW][C]2[/C][C]-0.233976[/C][C]-1.9854[/C][C]0.025457[/C][/ROW]
[ROW][C]3[/C][C]0.068112[/C][C]0.5779[/C][C]0.282551[/C][/ROW]
[ROW][C]4[/C][C]-0.142495[/C][C]-1.2091[/C][C]0.115287[/C][/ROW]
[ROW][C]5[/C][C]-0.211961[/C][C]-1.7985[/C][C]0.038141[/C][/ROW]
[ROW][C]6[/C][C]0.068913[/C][C]0.5847[/C][C]0.280274[/C][/ROW]
[ROW][C]7[/C][C]-0.1007[/C][C]-0.8545[/C][C]0.19784[/C][/ROW]
[ROW][C]8[/C][C]-0.052042[/C][C]-0.4416[/C][C]0.330054[/C][/ROW]
[ROW][C]9[/C][C]0.118247[/C][C]1.0034[/C][C]0.159524[/C][/ROW]
[ROW][C]10[/C][C]-0.112644[/C][C]-0.9558[/C][C]0.171181[/C][/ROW]
[ROW][C]11[/C][C]0.114018[/C][C]0.9675[/C][C]0.168272[/C][/ROW]
[ROW][C]12[/C][C]0.46381[/C][C]3.9356[/C][C]9.5e-05[/C][/ROW]
[ROW][C]13[/C][C]-0.037397[/C][C]-0.3173[/C][C]0.375959[/C][/ROW]
[ROW][C]14[/C][C]-0.269423[/C][C]-2.2861[/C][C]0.012595[/C][/ROW]
[ROW][C]15[/C][C]0.056802[/C][C]0.482[/C][C]0.31564[/C][/ROW]
[ROW][C]16[/C][C]-0.133191[/C][C]-1.1302[/C][C]0.131079[/C][/ROW]
[ROW][C]17[/C][C]-0.178608[/C][C]-1.5155[/C][C]0.067008[/C][/ROW]
[ROW][C]18[/C][C]0.045474[/C][C]0.3859[/C][C]0.35037[/C][/ROW]
[ROW][C]19[/C][C]-0.100472[/C][C]-0.8525[/C][C]0.198372[/C][/ROW]
[ROW][C]20[/C][C]0.027368[/C][C]0.2322[/C][C]0.408511[/C][/ROW]
[ROW][C]21[/C][C]0.198889[/C][C]1.6876[/C][C]0.047905[/C][/ROW]
[ROW][C]22[/C][C]-0.058314[/C][C]-0.4948[/C][C]0.311119[/C][/ROW]
[ROW][C]23[/C][C]0.060759[/C][C]0.5156[/C][C]0.303871[/C][/ROW]
[ROW][C]24[/C][C]0.375222[/C][C]3.1839[/C][C]0.001074[/C][/ROW]
[ROW][C]25[/C][C]-0.006121[/C][C]-0.0519[/C][C]0.47936[/C][/ROW]
[ROW][C]26[/C][C]-0.314443[/C][C]-2.6681[/C][C]0.004708[/C][/ROW]
[ROW][C]27[/C][C]0.042174[/C][C]0.3579[/C][C]0.360748[/C][/ROW]
[ROW][C]28[/C][C]-0.137051[/C][C]-1.1629[/C][C]0.124352[/C][/ROW]
[ROW][C]29[/C][C]-0.150481[/C][C]-1.2769[/C][C]0.102875[/C][/ROW]
[ROW][C]30[/C][C]0.065578[/C][C]0.5565[/C][C]0.289814[/C][/ROW]
[ROW][C]31[/C][C]-0.009984[/C][C]-0.0847[/C][C]0.466361[/C][/ROW]
[ROW][C]32[/C][C]0.052974[/C][C]0.4495[/C][C]0.327212[/C][/ROW]
[ROW][C]33[/C][C]0.093541[/C][C]0.7937[/C][C]0.214982[/C][/ROW]
[ROW][C]34[/C][C]-0.180338[/C][C]-1.5302[/C][C]0.065172[/C][/ROW]
[ROW][C]35[/C][C]-0.028908[/C][C]-0.2453[/C][C]0.403465[/C][/ROW]
[ROW][C]36[/C][C]0.230208[/C][C]1.9534[/C][C]0.02733[/C][/ROW]
[ROW][C]37[/C][C]-0.032572[/C][C]-0.2764[/C][C]0.391522[/C][/ROW]
[ROW][C]38[/C][C]-0.152625[/C][C]-1.2951[/C][C]0.099718[/C][/ROW]
[ROW][C]39[/C][C]0.015272[/C][C]0.1296[/C][C]0.448628[/C][/ROW]
[ROW][C]40[/C][C]-0.104499[/C][C]-0.8867[/C][C]0.189096[/C][/ROW]
[ROW][C]41[/C][C]-0.174528[/C][C]-1.4809[/C][C]0.071495[/C][/ROW]
[ROW][C]42[/C][C]0.080734[/C][C]0.6851[/C][C]0.247756[/C][/ROW]
[ROW][C]43[/C][C]0.079336[/C][C]0.6732[/C][C]0.25149[/C][/ROW]
[ROW][C]44[/C][C]0.004632[/C][C]0.0393[/C][C]0.484379[/C][/ROW]
[ROW][C]45[/C][C]0.065673[/C][C]0.5572[/C][C]0.289543[/C][/ROW]
[ROW][C]46[/C][C]-0.079988[/C][C]-0.6787[/C][C]0.249746[/C][/ROW]
[ROW][C]47[/C][C]0.034813[/C][C]0.2954[/C][C]0.384269[/C][/ROW]
[ROW][C]48[/C][C]0.190444[/C][C]1.616[/C][C]0.055237[/C][/ROW]
[/TABLE]
Source: https://freestatistics.org/blog/index.php?pk=105435&T=1

Globally Unique Identifier (entire table): ba.freestatistics.org/blog/index.php?pk=105435&T=1

As an alternative you can also use a QR Code:  

The GUIDs for individual cells are displayed in the table below:

Autocorrelation Function
Time lag kACF(k)T-STATP-value
10.0703190.59670.276298
2-0.233976-1.98540.025457
30.0681120.57790.282551
4-0.142495-1.20910.115287
5-0.211961-1.79850.038141
60.0689130.58470.280274
7-0.1007-0.85450.19784
8-0.052042-0.44160.330054
90.1182471.00340.159524
10-0.112644-0.95580.171181
110.1140180.96750.168272
120.463813.93569.5e-05
13-0.037397-0.31730.375959
14-0.269423-2.28610.012595
150.0568020.4820.31564
16-0.133191-1.13020.131079
17-0.178608-1.51550.067008
180.0454740.38590.35037
19-0.100472-0.85250.198372
200.0273680.23220.408511
210.1988891.68760.047905
22-0.058314-0.49480.311119
230.0607590.51560.303871
240.3752223.18390.001074
25-0.006121-0.05190.47936
26-0.314443-2.66810.004708
270.0421740.35790.360748
28-0.137051-1.16290.124352
29-0.150481-1.27690.102875
300.0655780.55650.289814
31-0.009984-0.08470.466361
320.0529740.44950.327212
330.0935410.79370.214982
34-0.180338-1.53020.065172
35-0.028908-0.24530.403465
360.2302081.95340.02733
37-0.032572-0.27640.391522
38-0.152625-1.29510.099718
390.0152720.12960.448628
40-0.104499-0.88670.189096
41-0.174528-1.48090.071495
420.0807340.68510.247756
430.0793360.67320.25149
440.0046320.03930.484379
450.0656730.55720.289543
46-0.079988-0.67870.249746
470.0348130.29540.384269
480.1904441.6160.055237


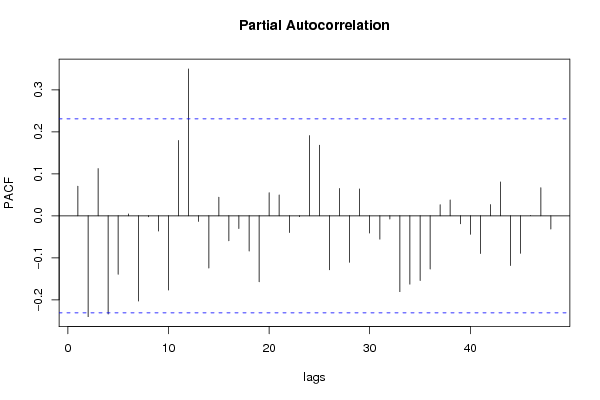
Partial Autocorrelation Function
Time lag kPACF(k)T-STATP-value
10.0703190.59670.276298
2-0.240108-2.03740.022644
30.1124030.95380.171694
4-0.234004-1.98560.025444
5-0.139325-1.18220.120506
60.0042840.03630.485553
7-0.202861-1.72130.044743
8-0.002173-0.01840.492671
9-0.036368-0.30860.379261
10-0.176649-1.49890.069134
110.1792881.52130.066281
120.3495422.9660.002046
13-0.013446-0.11410.45474
14-0.12453-1.05670.147096
150.0442190.37520.354303
16-0.059446-0.50440.307754
17-0.030484-0.25870.398315
18-0.083966-0.71250.239237
19-0.157215-1.3340.093202
200.054830.46520.32158
210.0494570.41970.337994
22-0.039708-0.33690.368572
23-0.002059-0.01750.493054
240.1908861.61970.054832
250.1677921.42380.079417
26-0.128757-1.09250.139119
270.0649360.5510.291671
28-0.110705-0.93940.175342
290.0636780.54030.29532
30-0.040886-0.34690.364829
31-0.055678-0.47240.319019
32-0.007799-0.06620.47371
33-0.180604-1.53250.064893
34-0.162742-1.38090.085789
35-0.153917-1.3060.09785
36-0.126931-1.0770.142528
370.0263080.22320.411994
380.0378630.32130.374464
39-0.019136-0.16240.435733
40-0.04416-0.37470.354488
41-0.09004-0.7640.223678
420.0266470.22610.410879
430.0804070.68230.248626
44-0.118248-1.00340.159522
45-0.08927-0.75750.225617
460.0002740.00230.499075
470.066760.56650.286415
48-0.031381-0.26630.395393

\begin{tabular}{lllllllll}
\hline
Partial Autocorrelation Function \tabularnewline
Time lag k & PACF(k) & T-STAT & P-value \tabularnewline
1 & 0.070319 & 0.5967 & 0.276298 \tabularnewline
2 & -0.240108 & -2.0374 & 0.022644 \tabularnewline
3 & 0.112403 & 0.9538 & 0.171694 \tabularnewline
4 & -0.234004 & -1.9856 & 0.025444 \tabularnewline
5 & -0.139325 & -1.1822 & 0.120506 \tabularnewline
6 & 0.004284 & 0.0363 & 0.485553 \tabularnewline
7 & -0.202861 & -1.7213 & 0.044743 \tabularnewline
8 & -0.002173 & -0.0184 & 0.492671 \tabularnewline
9 & -0.036368 & -0.3086 & 0.379261 \tabularnewline
10 & -0.176649 & -1.4989 & 0.069134 \tabularnewline
11 & 0.179288 & 1.5213 & 0.066281 \tabularnewline
12 & 0.349542 & 2.966 & 0.002046 \tabularnewline
13 & -0.013446 & -0.1141 & 0.45474 \tabularnewline
14 & -0.12453 & -1.0567 & 0.147096 \tabularnewline
15 & 0.044219 & 0.3752 & 0.354303 \tabularnewline
16 & -0.059446 & -0.5044 & 0.307754 \tabularnewline
17 & -0.030484 & -0.2587 & 0.398315 \tabularnewline
18 & -0.083966 & -0.7125 & 0.239237 \tabularnewline
19 & -0.157215 & -1.334 & 0.093202 \tabularnewline
20 & 0.05483 & 0.4652 & 0.32158 \tabularnewline
21 & 0.049457 & 0.4197 & 0.337994 \tabularnewline
22 & -0.039708 & -0.3369 & 0.368572 \tabularnewline
23 & -0.002059 & -0.0175 & 0.493054 \tabularnewline
24 & 0.190886 & 1.6197 & 0.054832 \tabularnewline
25 & 0.167792 & 1.4238 & 0.079417 \tabularnewline
26 & -0.128757 & -1.0925 & 0.139119 \tabularnewline
27 & 0.064936 & 0.551 & 0.291671 \tabularnewline
28 & -0.110705 & -0.9394 & 0.175342 \tabularnewline
29 & 0.063678 & 0.5403 & 0.29532 \tabularnewline
30 & -0.040886 & -0.3469 & 0.364829 \tabularnewline
31 & -0.055678 & -0.4724 & 0.319019 \tabularnewline
32 & -0.007799 & -0.0662 & 0.47371 \tabularnewline
33 & -0.180604 & -1.5325 & 0.064893 \tabularnewline
34 & -0.162742 & -1.3809 & 0.085789 \tabularnewline
35 & -0.153917 & -1.306 & 0.09785 \tabularnewline
36 & -0.126931 & -1.077 & 0.142528 \tabularnewline
37 & 0.026308 & 0.2232 & 0.411994 \tabularnewline
38 & 0.037863 & 0.3213 & 0.374464 \tabularnewline
39 & -0.019136 & -0.1624 & 0.435733 \tabularnewline
40 & -0.04416 & -0.3747 & 0.354488 \tabularnewline
41 & -0.09004 & -0.764 & 0.223678 \tabularnewline
42 & 0.026647 & 0.2261 & 0.410879 \tabularnewline
43 & 0.080407 & 0.6823 & 0.248626 \tabularnewline
44 & -0.118248 & -1.0034 & 0.159522 \tabularnewline
45 & -0.08927 & -0.7575 & 0.225617 \tabularnewline
46 & 0.000274 & 0.0023 & 0.499075 \tabularnewline
47 & 0.06676 & 0.5665 & 0.286415 \tabularnewline
48 & -0.031381 & -0.2663 & 0.395393 \tabularnewline
\hline
\end{tabular}
%Source: https://freestatistics.org/blog/index.php?pk=105435&T=2

[TABLE]
[ROW][C]Partial Autocorrelation Function[/C][/ROW]
[ROW][C]Time lag k[/C][C]PACF(k)[/C][C]T-STAT[/C][C]P-value[/C][/ROW]
[ROW][C]1[/C][C]0.070319[/C][C]0.5967[/C][C]0.276298[/C][/ROW]
[ROW][C]2[/C][C]-0.240108[/C][C]-2.0374[/C][C]0.022644[/C][/ROW]
[ROW][C]3[/C][C]0.112403[/C][C]0.9538[/C][C]0.171694[/C][/ROW]
[ROW][C]4[/C][C]-0.234004[/C][C]-1.9856[/C][C]0.025444[/C][/ROW]
[ROW][C]5[/C][C]-0.139325[/C][C]-1.1822[/C][C]0.120506[/C][/ROW]
[ROW][C]6[/C][C]0.004284[/C][C]0.0363[/C][C]0.485553[/C][/ROW]
[ROW][C]7[/C][C]-0.202861[/C][C]-1.7213[/C][C]0.044743[/C][/ROW]
[ROW][C]8[/C][C]-0.002173[/C][C]-0.0184[/C][C]0.492671[/C][/ROW]
[ROW][C]9[/C][C]-0.036368[/C][C]-0.3086[/C][C]0.379261[/C][/ROW]
[ROW][C]10[/C][C]-0.176649[/C][C]-1.4989[/C][C]0.069134[/C][/ROW]
[ROW][C]11[/C][C]0.179288[/C][C]1.5213[/C][C]0.066281[/C][/ROW]
[ROW][C]12[/C][C]0.349542[/C][C]2.966[/C][C]0.002046[/C][/ROW]
[ROW][C]13[/C][C]-0.013446[/C][C]-0.1141[/C][C]0.45474[/C][/ROW]
[ROW][C]14[/C][C]-0.12453[/C][C]-1.0567[/C][C]0.147096[/C][/ROW]
[ROW][C]15[/C][C]0.044219[/C][C]0.3752[/C][C]0.354303[/C][/ROW]
[ROW][C]16[/C][C]-0.059446[/C][C]-0.5044[/C][C]0.307754[/C][/ROW]
[ROW][C]17[/C][C]-0.030484[/C][C]-0.2587[/C][C]0.398315[/C][/ROW]
[ROW][C]18[/C][C]-0.083966[/C][C]-0.7125[/C][C]0.239237[/C][/ROW]
[ROW][C]19[/C][C]-0.157215[/C][C]-1.334[/C][C]0.093202[/C][/ROW]
[ROW][C]20[/C][C]0.05483[/C][C]0.4652[/C][C]0.32158[/C][/ROW]
[ROW][C]21[/C][C]0.049457[/C][C]0.4197[/C][C]0.337994[/C][/ROW]
[ROW][C]22[/C][C]-0.039708[/C][C]-0.3369[/C][C]0.368572[/C][/ROW]
[ROW][C]23[/C][C]-0.002059[/C][C]-0.0175[/C][C]0.493054[/C][/ROW]
[ROW][C]24[/C][C]0.190886[/C][C]1.6197[/C][C]0.054832[/C][/ROW]
[ROW][C]25[/C][C]0.167792[/C][C]1.4238[/C][C]0.079417[/C][/ROW]
[ROW][C]26[/C][C]-0.128757[/C][C]-1.0925[/C][C]0.139119[/C][/ROW]
[ROW][C]27[/C][C]0.064936[/C][C]0.551[/C][C]0.291671[/C][/ROW]
[ROW][C]28[/C][C]-0.110705[/C][C]-0.9394[/C][C]0.175342[/C][/ROW]
[ROW][C]29[/C][C]0.063678[/C][C]0.5403[/C][C]0.29532[/C][/ROW]
[ROW][C]30[/C][C]-0.040886[/C][C]-0.3469[/C][C]0.364829[/C][/ROW]
[ROW][C]31[/C][C]-0.055678[/C][C]-0.4724[/C][C]0.319019[/C][/ROW]
[ROW][C]32[/C][C]-0.007799[/C][C]-0.0662[/C][C]0.47371[/C][/ROW]
[ROW][C]33[/C][C]-0.180604[/C][C]-1.5325[/C][C]0.064893[/C][/ROW]
[ROW][C]34[/C][C]-0.162742[/C][C]-1.3809[/C][C]0.085789[/C][/ROW]
[ROW][C]35[/C][C]-0.153917[/C][C]-1.306[/C][C]0.09785[/C][/ROW]
[ROW][C]36[/C][C]-0.126931[/C][C]-1.077[/C][C]0.142528[/C][/ROW]
[ROW][C]37[/C][C]0.026308[/C][C]0.2232[/C][C]0.411994[/C][/ROW]
[ROW][C]38[/C][C]0.037863[/C][C]0.3213[/C][C]0.374464[/C][/ROW]
[ROW][C]39[/C][C]-0.019136[/C][C]-0.1624[/C][C]0.435733[/C][/ROW]
[ROW][C]40[/C][C]-0.04416[/C][C]-0.3747[/C][C]0.354488[/C][/ROW]
[ROW][C]41[/C][C]-0.09004[/C][C]-0.764[/C][C]0.223678[/C][/ROW]
[ROW][C]42[/C][C]0.026647[/C][C]0.2261[/C][C]0.410879[/C][/ROW]
[ROW][C]43[/C][C]0.080407[/C][C]0.6823[/C][C]0.248626[/C][/ROW]
[ROW][C]44[/C][C]-0.118248[/C][C]-1.0034[/C][C]0.159522[/C][/ROW]
[ROW][C]45[/C][C]-0.08927[/C][C]-0.7575[/C][C]0.225617[/C][/ROW]
[ROW][C]46[/C][C]0.000274[/C][C]0.0023[/C][C]0.499075[/C][/ROW]
[ROW][C]47[/C][C]0.06676[/C][C]0.5665[/C][C]0.286415[/C][/ROW]
[ROW][C]48[/C][C]-0.031381[/C][C]-0.2663[/C][C]0.395393[/C][/ROW]
[/TABLE]
Source: https://freestatistics.org/blog/index.php?pk=105435&T=2

Globally Unique Identifier (entire table): ba.freestatistics.org/blog/index.php?pk=105435&T=2

As an alternative you can also use a QR Code:  

The GUIDs for individual cells are displayed in the table below:

Partial Autocorrelation Function
Time lag kPACF(k)T-STATP-value
10.0703190.59670.276298
2-0.240108-2.03740.022644
30.1124030.95380.171694
4-0.234004-1.98560.025444
5-0.139325-1.18220.120506
60.0042840.03630.485553
7-0.202861-1.72130.044743
8-0.002173-0.01840.492671
9-0.036368-0.30860.379261
10-0.176649-1.49890.069134
110.1792881.52130.066281
120.3495422.9660.002046
13-0.013446-0.11410.45474
14-0.12453-1.05670.147096
150.0442190.37520.354303
16-0.059446-0.50440.307754
17-0.030484-0.25870.398315
18-0.083966-0.71250.239237
19-0.157215-1.3340.093202
200.054830.46520.32158
210.0494570.41970.337994
22-0.039708-0.33690.368572
23-0.002059-0.01750.493054
240.1908861.61970.054832
250.1677921.42380.079417
26-0.128757-1.09250.139119
270.0649360.5510.291671
28-0.110705-0.93940.175342
290.0636780.54030.29532
30-0.040886-0.34690.364829
31-0.055678-0.47240.319019
32-0.007799-0.06620.47371
33-0.180604-1.53250.064893
34-0.162742-1.38090.085789
35-0.153917-1.3060.09785
36-0.126931-1.0770.142528
370.0263080.22320.411994
380.0378630.32130.374464
39-0.019136-0.16240.435733
40-0.04416-0.37470.354488
41-0.09004-0.7640.223678
420.0266470.22610.410879
430.0804070.68230.248626
44-0.118248-1.00340.159522
45-0.08927-0.75750.225617
460.0002740.00230.499075
470.066760.56650.286415
48-0.031381-0.26630.395393


Parameters (Session):
par1 = 48 ; par2 = 1 ; par3 = 0 ; par4 = 0 ; par5 = 12 ; par6 = White Noise ; par7 = 0.95 ;
Parameters (R input):
par1 = 48 ; par2 = 1 ; par3 = 0 ; par4 = 0 ; par5 = 12 ; par6 = White Noise ; par7 = 0.95 ; par8 = ; par9 = ; par10 = ; par11 = ; par12 = ; par13 = ; par14 = ; par15 = ; par16 = ; par17 = ; par18 = ; par19 = ; par20 = ;
R code (references can be found in the software module):
if (par1 == 'Default') {
par1 = 10*log10(length(x))
} else {
par1 <- as.numeric(par1)
}
par2 <- as.numeric(par2)
par3 <- as.numeric(par3)
par4 <- as.numeric(par4)
par5 <- as.numeric(par5)
if (par6 == 'White Noise') par6 <- 'white' else par6 <- 'ma'
par7 <- as.numeric(par7)
if (par2 == 0) {
x <- log(x)
} else {
x <- (x ^ par2 - 1) / par2
}
if (par3 > 0) x <- diff(x,lag=1,difference=par3)
if (par4 > 0) x <- diff(x,lag=par5,difference=par4)
bitmap(file='pic1.png')
racf <- acf(x, par1, main='Autocorrelation', xlab='time lag', ylab='ACF', ci.type=par6, ci=par7, sub=paste('(lambda=',par2,', d=',par3,', D=',par4,', CI=', par7, ', CI type=',par6,')',sep=''))
dev.off()
bitmap(file='pic2.png')
rpacf <- pacf(x,par1,main='Partial Autocorrelation',xlab='lags',ylab='PACF')
dev.off()
(myacf <- c(racf$acf))
(mypacf <- c(rpacf$acf))
lengthx <- length(x)
sqrtn <- sqrt(lengthx)
load(file='createtable')
a<-table.start()
a<-table.row.start(a)
a<-table.element(a,'Autocorrelation Function',4,TRUE)
a<-table.row.end(a)
a<-table.row.start(a)
a<-table.element(a,'Time lag k',header=TRUE)
a<-table.element(a,hyperlink('basics.htm','ACF(k)','click here for more information about the Autocorrelation Function'),header=TRUE)
a<-table.element(a,'T-STAT',header=TRUE)
a<-table.element(a,'P-value',header=TRUE)
a<-table.row.end(a)
for (i in 2:(par1+1)) {
a<-table.row.start(a)
a<-table.element(a,i-1,header=TRUE)
a<-table.element(a,round(myacf[i],6))
mytstat <- myacf[i]*sqrtn
a<-table.element(a,round(mytstat,4))
a<-table.element(a,round(1-pt(abs(mytstat),lengthx),6))
a<-table.row.end(a)
}
a<-table.end(a)
table.save(a,file='mytable.tab')
a<-table.start()
a<-table.row.start(a)
a<-table.element(a,'Partial Autocorrelation Function',4,TRUE)
a<-table.row.end(a)
a<-table.row.start(a)
a<-table.element(a,'Time lag k',header=TRUE)
a<-table.element(a,hyperlink('basics.htm','PACF(k)','click here for more information about the Partial Autocorrelation Function'),header=TRUE)
a<-table.element(a,'T-STAT',header=TRUE)
a<-table.element(a,'P-value',header=TRUE)
a<-table.row.end(a)
for (i in 1:par1) {
a<-table.row.start(a)
a<-table.element(a,i,header=TRUE)
a<-table.element(a,round(mypacf[i],6))
mytstat <- mypacf[i]*sqrtn
a<-table.element(a,round(mytstat,4))
a<-table.element(a,round(1-pt(abs(mytstat),lengthx),6))
a<-table.row.end(a)
}
a<-table.end(a)
table.save(a,file='mytable1.tab')