Free Statistics

of Irreproducible Research!

Author's title

Author*The author of this computation has been verified*
R Software Modulerwasp_smp.wasp
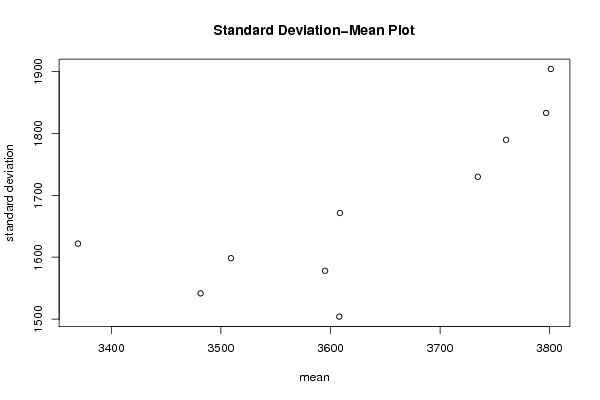
Title produced by softwareStandard Deviation-Mean Plot
Date of computationSun, 05 Dec 2010 15:31:27 +0000
Cite this page as followsStatistical Computations at FreeStatistics.org, Office for Research Development and Education, URL https://freestatistics.org/blog/index.php?v=date/2010/Dec/05/t12915633184vr0ybc061f0n62.htm/, Retrieved Wed, 01 May 2024 13:29:27 +0000
Statistical Computations at FreeStatistics.org, Office for Research Development and Education, URL https://freestatistics.org/blog/index.php?pk=105423, Retrieved Wed, 01 May 2024 13:29:27 +0000
QR Codes:

Original text written by user:
IsPrivate?No (this computation is public)
User-defined keywords
Estimated Impact112
Family? (F = Feedback message, R = changed R code, M = changed R Module, P = changed Parameters, D = changed Data)
-     [Univariate Data Series] [data set] [2008-12-01 19:54:57] [b98453cac15ba1066b407e146608df68]
- RMP   [Standard Deviation-Mean Plot] [Unemployment] [2010-11-29 10:34:47] [b98453cac15ba1066b407e146608df68]
-   PD      [Standard Deviation-Mean Plot] [] [2010-12-05 15:31:27] [6b67b7c8c7d0a997c30f007387afbdb8] [Current]
Feedback Forum

Post a new message
Dataseries X:
1579
2146
2462
3695
4831
5134
6250
5760
6249
2917
1741
2359
1511
2059
2635
2867
4403
5720
4502
5749
5627
2846
1762
2429
1169
2154
2249
2687
4359
5382
4459
6398
4596
3024
1887
2070
1351
2218
2461
3028
4784
4975
4607
6249
4809
3157
1910
2228
1594
2467
2222
3607
4685
4962
5770
5480
5000
3228
1993
2288
1580
2111
2192
3601
4665
4876
5813
5589
5331
3075
2002
2306
1507
1992
2487
3490
4647
5594
5611
5788
6204
3013
1931
2549
1504
2090
2702
2939
4500
6208
6415
5657
5964
3163
1997
2422
1376
2202
2683
3303
5202
5231
4880
7998
4977
3531
2025
2205
1442
2238
2179
3218
5139
4990
4914
6084
5672
3548
1793
2086


Summary of computational transaction
Raw Inputview raw input (R code)
Raw Outputview raw output of R engine
Computing time2 seconds
R Server'George Udny Yule' @ 72.249.76.132

\begin{tabular}{lllllllll}
\hline
Summary of computational transaction \tabularnewline
Raw Input & view raw input (R code)  \tabularnewline
Raw Output & view raw output of R engine  \tabularnewline
Computing time & 2 seconds \tabularnewline
R Server & 'George Udny Yule' @ 72.249.76.132 \tabularnewline
\hline
\end{tabular}
%Source: https://freestatistics.org/blog/index.php?pk=105423&T=0

[TABLE]
[ROW][C]Summary of computational transaction[/C][/ROW]
[ROW][C]Raw Input[/C][C]view raw input (R code) [/C][/ROW]
[ROW][C]Raw Output[/C][C]view raw output of R engine [/C][/ROW]
[ROW][C]Computing time[/C][C]2 seconds[/C][/ROW]
[ROW][C]R Server[/C][C]'George Udny Yule' @ 72.249.76.132[/C][/ROW]
[/TABLE]
Source: https://freestatistics.org/blog/index.php?pk=105423&T=0

Globally Unique Identifier (entire table): ba.freestatistics.org/blog/index.php?pk=105423&T=0

As an alternative you can also use a QR Code:  

The GUIDs for individual cells are displayed in the table below:

Summary of computational transaction
Raw Inputview raw input (R code)
Raw Outputview raw output of R engine
Computing time2 seconds
R Server'George Udny Yule' @ 72.249.76.132


Standard Deviation-Mean Plot
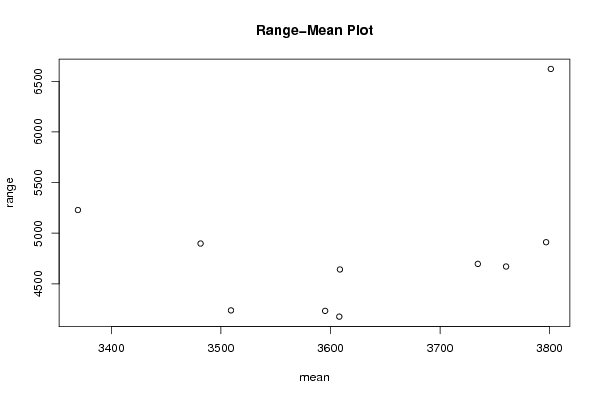
SectionMeanStandard DeviationRange
13760.251789.635164699024671
23509.166666666671598.460954869534238
33369.51621.986296321445229
43481.416666666671541.658814885824898
536081504.044124110974176
63595.083333333331578.135059223874233
73734.416666666671729.940222736734697
83796.751832.931339536364911
93801.083333333331904.047672165486622
103608.583333333331671.338465168424642

\begin{tabular}{lllllllll}
\hline
Standard Deviation-Mean Plot \tabularnewline
Section & Mean & Standard Deviation & Range \tabularnewline
1 & 3760.25 & 1789.63516469902 & 4671 \tabularnewline
2 & 3509.16666666667 & 1598.46095486953 & 4238 \tabularnewline
3 & 3369.5 & 1621.98629632144 & 5229 \tabularnewline
4 & 3481.41666666667 & 1541.65881488582 & 4898 \tabularnewline
5 & 3608 & 1504.04412411097 & 4176 \tabularnewline
6 & 3595.08333333333 & 1578.13505922387 & 4233 \tabularnewline
7 & 3734.41666666667 & 1729.94022273673 & 4697 \tabularnewline
8 & 3796.75 & 1832.93133953636 & 4911 \tabularnewline
9 & 3801.08333333333 & 1904.04767216548 & 6622 \tabularnewline
10 & 3608.58333333333 & 1671.33846516842 & 4642 \tabularnewline
\hline
\end{tabular}
%Source: https://freestatistics.org/blog/index.php?pk=105423&T=1

[TABLE]
[ROW][C]Standard Deviation-Mean Plot[/C][/ROW]
[ROW][C]Section[/C][C]Mean[/C][C]Standard Deviation[/C][C]Range[/C][/ROW]
[ROW][C]1[/C][C]3760.25[/C][C]1789.63516469902[/C][C]4671[/C][/ROW]
[ROW][C]2[/C][C]3509.16666666667[/C][C]1598.46095486953[/C][C]4238[/C][/ROW]
[ROW][C]3[/C][C]3369.5[/C][C]1621.98629632144[/C][C]5229[/C][/ROW]
[ROW][C]4[/C][C]3481.41666666667[/C][C]1541.65881488582[/C][C]4898[/C][/ROW]
[ROW][C]5[/C][C]3608[/C][C]1504.04412411097[/C][C]4176[/C][/ROW]
[ROW][C]6[/C][C]3595.08333333333[/C][C]1578.13505922387[/C][C]4233[/C][/ROW]
[ROW][C]7[/C][C]3734.41666666667[/C][C]1729.94022273673[/C][C]4697[/C][/ROW]
[ROW][C]8[/C][C]3796.75[/C][C]1832.93133953636[/C][C]4911[/C][/ROW]
[ROW][C]9[/C][C]3801.08333333333[/C][C]1904.04767216548[/C][C]6622[/C][/ROW]
[ROW][C]10[/C][C]3608.58333333333[/C][C]1671.33846516842[/C][C]4642[/C][/ROW]
[/TABLE]
Source: https://freestatistics.org/blog/index.php?pk=105423&T=1

Globally Unique Identifier (entire table): ba.freestatistics.org/blog/index.php?pk=105423&T=1

As an alternative you can also use a QR Code:  

The GUIDs for individual cells are displayed in the table below:

Standard Deviation-Mean Plot
SectionMeanStandard DeviationRange
13760.251789.635164699024671
23509.166666666671598.460954869534238
33369.51621.986296321445229
43481.416666666671541.658814885824898
536081504.044124110974176
63595.083333333331578.135059223874233
73734.416666666671729.940222736734697
83796.751832.931339536364911
93801.083333333331904.047672165486622
103608.583333333331671.338465168424642


Regression: S.E.(k) = alpha + beta * Mean(k)
alpha-904.840164459907
beta0.71201196104474
S.D.0.200343800297590
T-STAT3.5539505589248
p-value0.00746628813643318

\begin{tabular}{lllllllll}
\hline
Regression: S.E.(k) = alpha + beta * Mean(k) \tabularnewline
alpha & -904.840164459907 \tabularnewline
beta & 0.71201196104474 \tabularnewline
S.D. & 0.200343800297590 \tabularnewline
T-STAT & 3.5539505589248 \tabularnewline
p-value & 0.00746628813643318 \tabularnewline
\hline
\end{tabular}
%Source: https://freestatistics.org/blog/index.php?pk=105423&T=2

[TABLE]
[ROW][C]Regression: S.E.(k) = alpha + beta * Mean(k)[/C][/ROW]
[ROW][C]alpha[/C][C]-904.840164459907[/C][/ROW]
[ROW][C]beta[/C][C]0.71201196104474[/C][/ROW]
[ROW][C]S.D.[/C][C]0.200343800297590[/C][/ROW]
[ROW][C]T-STAT[/C][C]3.5539505589248[/C][/ROW]
[ROW][C]p-value[/C][C]0.00746628813643318[/C][/ROW]
[/TABLE]
Source: https://freestatistics.org/blog/index.php?pk=105423&T=2

Globally Unique Identifier (entire table): ba.freestatistics.org/blog/index.php?pk=105423&T=2

As an alternative you can also use a QR Code:  

The GUIDs for individual cells are displayed in the table below:

Regression: S.E.(k) = alpha + beta * Mean(k)
alpha-904.840164459907
beta0.71201196104474
S.D.0.200343800297590
T-STAT3.5539505589248
p-value0.00746628813643318


Regression: ln S.E.(k) = alpha + beta * ln Mean(k)
alpha-4.71701515661347
beta1.48123624288438
S.D.0.43955066861743
T-STAT3.36988736143544
p-value0.00978721716802655
Lambda-0.481236242884375

\begin{tabular}{lllllllll}
\hline
Regression: ln S.E.(k) = alpha + beta * ln Mean(k) \tabularnewline
alpha & -4.71701515661347 \tabularnewline
beta & 1.48123624288438 \tabularnewline
S.D. & 0.43955066861743 \tabularnewline
T-STAT & 3.36988736143544 \tabularnewline
p-value & 0.00978721716802655 \tabularnewline
Lambda & -0.481236242884375 \tabularnewline
\hline
\end{tabular}
%Source: https://freestatistics.org/blog/index.php?pk=105423&T=3

[TABLE]
[ROW][C]Regression: ln S.E.(k) = alpha + beta * ln Mean(k)[/C][/ROW]
[ROW][C]alpha[/C][C]-4.71701515661347[/C][/ROW]
[ROW][C]beta[/C][C]1.48123624288438[/C][/ROW]
[ROW][C]S.D.[/C][C]0.43955066861743[/C][/ROW]
[ROW][C]T-STAT[/C][C]3.36988736143544[/C][/ROW]
[ROW][C]p-value[/C][C]0.00978721716802655[/C][/ROW]
[ROW][C]Lambda[/C][C]-0.481236242884375[/C][/ROW]
[/TABLE]
Source: https://freestatistics.org/blog/index.php?pk=105423&T=3

Globally Unique Identifier (entire table): ba.freestatistics.org/blog/index.php?pk=105423&T=3

As an alternative you can also use a QR Code:  

The GUIDs for individual cells are displayed in the table below:

Regression: ln S.E.(k) = alpha + beta * ln Mean(k)
alpha-4.71701515661347
beta1.48123624288438
S.D.0.43955066861743
T-STAT3.36988736143544
p-value0.00978721716802655
Lambda-0.481236242884375


Parameters (Session):
par1 = 12 ;
Parameters (R input):
par1 = 12 ;
R code (references can be found in the software module):
par1 <- as.numeric(par1)
(n <- length(x))
(np <- floor(n / par1))
arr <- array(NA,dim=c(par1,np))
j <- 0
k <- 1
for (i in 1:(np*par1))
{
j = j + 1
arr[j,k] <- x[i]
if (j == par1) {
j = 0
k=k+1
}
}
arr
arr.mean <- array(NA,dim=np)
arr.sd <- array(NA,dim=np)
arr.range <- array(NA,dim=np)
for (j in 1:np)
{
arr.mean[j] <- mean(arr[,j],na.rm=TRUE)
arr.sd[j] <- sd(arr[,j],na.rm=TRUE)
arr.range[j] <- max(arr[,j],na.rm=TRUE) - min(arr[,j],na.rm=TRUE)
}
arr.mean
arr.sd
arr.range
(lm1 <- lm(arr.sd~arr.mean))
(lnlm1 <- lm(log(arr.sd)~log(arr.mean)))
(lm2 <- lm(arr.range~arr.mean))
bitmap(file='test1.png')
plot(arr.mean,arr.sd,main='Standard Deviation-Mean Plot',xlab='mean',ylab='standard deviation')
dev.off()
bitmap(file='test2.png')
plot(arr.mean,arr.range,main='Range-Mean Plot',xlab='mean',ylab='range')
dev.off()
load(file='createtable')
a<-table.start()
a<-table.row.start(a)
a<-table.element(a,'Standard Deviation-Mean Plot',4,TRUE)
a<-table.row.end(a)
a<-table.row.start(a)
a<-table.element(a,'Section',header=TRUE)
a<-table.element(a,'Mean',header=TRUE)
a<-table.element(a,'Standard Deviation',header=TRUE)
a<-table.element(a,'Range',header=TRUE)
a<-table.row.end(a)
for (j in 1:np) {
a<-table.row.start(a)
a<-table.element(a,j,header=TRUE)
a<-table.element(a,arr.mean[j])
a<-table.element(a,arr.sd[j] )
a<-table.element(a,arr.range[j] )
a<-table.row.end(a)
}
a<-table.end(a)
table.save(a,file='mytable.tab')
a<-table.start()
a<-table.row.start(a)
a<-table.element(a,'Regression: S.E.(k) = alpha + beta * Mean(k)',2,TRUE)
a<-table.row.end(a)
a<-table.row.start(a)
a<-table.element(a,'alpha',header=TRUE)
a<-table.element(a,lm1$coefficients[[1]])
a<-table.row.end(a)
a<-table.row.start(a)
a<-table.element(a,'beta',header=TRUE)
a<-table.element(a,lm1$coefficients[[2]])
a<-table.row.end(a)
a<-table.row.start(a)
a<-table.element(a,'S.D.',header=TRUE)
a<-table.element(a,summary(lm1)$coefficients[2,2])
a<-table.row.end(a)
a<-table.row.start(a)
a<-table.element(a,'T-STAT',header=TRUE)
a<-table.element(a,summary(lm1)$coefficients[2,3])
a<-table.row.end(a)
a<-table.row.start(a)
a<-table.element(a,'p-value',header=TRUE)
a<-table.element(a,summary(lm1)$coefficients[2,4])
a<-table.row.end(a)
a<-table.end(a)
table.save(a,file='mytable1.tab')
a<-table.start()
a<-table.row.start(a)
a<-table.element(a,'Regression: ln S.E.(k) = alpha + beta * ln Mean(k)',2,TRUE)
a<-table.row.end(a)
a<-table.row.start(a)
a<-table.element(a,'alpha',header=TRUE)
a<-table.element(a,lnlm1$coefficients[[1]])
a<-table.row.end(a)
a<-table.row.start(a)
a<-table.element(a,'beta',header=TRUE)
a<-table.element(a,lnlm1$coefficients[[2]])
a<-table.row.end(a)
a<-table.row.start(a)
a<-table.element(a,'S.D.',header=TRUE)
a<-table.element(a,summary(lnlm1)$coefficients[2,2])
a<-table.row.end(a)
a<-table.row.start(a)
a<-table.element(a,'T-STAT',header=TRUE)
a<-table.element(a,summary(lnlm1)$coefficients[2,3])
a<-table.row.end(a)
a<-table.row.start(a)
a<-table.element(a,'p-value',header=TRUE)
a<-table.element(a,summary(lnlm1)$coefficients[2,4])
a<-table.row.end(a)
a<-table.row.start(a)
a<-table.element(a,'Lambda',header=TRUE)
a<-table.element(a,1-lnlm1$coefficients[[2]])
a<-table.row.end(a)
a<-table.end(a)
table.save(a,file='mytable2.tab')