Free Statistics

of Irreproducible Research!

Author's title

Author*Unverified author*
R Software Modulerwasp_smp.wasp
Title produced by softwareStandard Deviation-Mean Plot
Date of computationSun, 05 Dec 2010 13:49:58 +0000
Cite this page as followsStatistical Computations at FreeStatistics.org, Office for Research Development and Education, URL https://freestatistics.org/blog/index.php?v=date/2010/Dec/05/t12915569401dzotigh2pn3hp6.htm/, Retrieved Wed, 01 May 2024 21:03:42 +0000
Statistical Computations at FreeStatistics.org, Office for Research Development and Education, URL https://freestatistics.org/blog/index.php?pk=105397, Retrieved Wed, 01 May 2024 21:03:42 +0000
QR Codes:

Original text written by user:
IsPrivate?No (this computation is public)
User-defined keywordsKDGP2W83
Estimated Impact154
Family? (F = Feedback message, R = changed R code, M = changed R Module, P = changed Parameters, D = changed Data)
-       [Standard Deviation-Mean Plot] [Opgave 8 oef 3] [2010-12-05 13:49:58] [9a37dffdb284317d3f5f461f9b8f0111] [Current]
Feedback Forum

Post a new message
Dataseries X:
6715
7703
9856
8326
9269
7035
10342
11682
10304
11385
9777
8882
7897
6930
9545
9110
7459
7320
10017
12307
11072
10749
9589
9080
7384
8062
8511
8684
8306
7643
10577
13747
11783
11611
9946
8693
7303
7609
9423
8584
7586
6843
11811
13414
12103
11501
8213
7982
7687
7180
7862
8043
8340
6692
10065
12684
11587
9843
8110
7940
6475
6121
9669
7778
7826
7403
10741
14023
11519
10236
8075
8157


Summary of computational transaction
Raw Inputview raw input (R code)
Raw Outputview raw output of R engine
Computing time1 seconds
R Server'Gwilym Jenkins' @ 72.249.127.135

\begin{tabular}{lllllllll}
\hline
Summary of computational transaction \tabularnewline
Raw Input & view raw input (R code)  \tabularnewline
Raw Output & view raw output of R engine  \tabularnewline
Computing time & 1 seconds \tabularnewline
R Server & 'Gwilym Jenkins' @ 72.249.127.135 \tabularnewline
\hline
\end{tabular}
%Source: https://freestatistics.org/blog/index.php?pk=105397&T=0

[TABLE]
[ROW][C]Summary of computational transaction[/C][/ROW]
[ROW][C]Raw Input[/C][C]view raw input (R code) [/C][/ROW]
[ROW][C]Raw Output[/C][C]view raw output of R engine [/C][/ROW]
[ROW][C]Computing time[/C][C]1 seconds[/C][/ROW]
[ROW][C]R Server[/C][C]'Gwilym Jenkins' @ 72.249.127.135[/C][/ROW]
[/TABLE]
Source: https://freestatistics.org/blog/index.php?pk=105397&T=0

Globally Unique Identifier (entire table): ba.freestatistics.org/blog/index.php?pk=105397&T=0

As an alternative you can also use a QR Code:  

The GUIDs for individual cells are displayed in the table below:

Summary of computational transaction
Raw Inputview raw input (R code)
Raw Outputview raw output of R engine
Computing time1 seconds
R Server'Gwilym Jenkins' @ 72.249.127.135


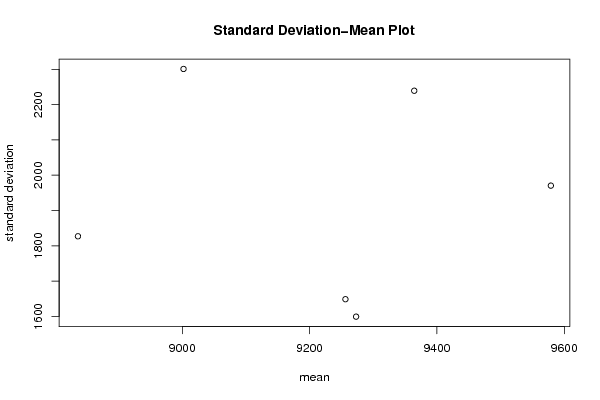
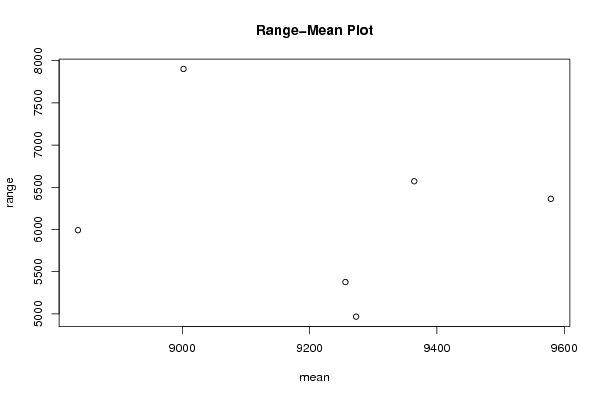
Standard Deviation-Mean Plot
SectionMeanStandard DeviationRange
192731599.149376159944967
29256.251648.574873530585377
39578.916666666671970.328558588106363
49364.333333333332239.120660735676571
58836.083333333331826.877637258495992
69001.916666666672300.883089690627902

\begin{tabular}{lllllllll}
\hline
Standard Deviation-Mean Plot \tabularnewline
Section & Mean & Standard Deviation & Range \tabularnewline
1 & 9273 & 1599.14937615994 & 4967 \tabularnewline
2 & 9256.25 & 1648.57487353058 & 5377 \tabularnewline
3 & 9578.91666666667 & 1970.32855858810 & 6363 \tabularnewline
4 & 9364.33333333333 & 2239.12066073567 & 6571 \tabularnewline
5 & 8836.08333333333 & 1826.87763725849 & 5992 \tabularnewline
6 & 9001.91666666667 & 2300.88308969062 & 7902 \tabularnewline
\hline
\end{tabular}
%Source: https://freestatistics.org/blog/index.php?pk=105397&T=1

[TABLE]
[ROW][C]Standard Deviation-Mean Plot[/C][/ROW]
[ROW][C]Section[/C][C]Mean[/C][C]Standard Deviation[/C][C]Range[/C][/ROW]
[ROW][C]1[/C][C]9273[/C][C]1599.14937615994[/C][C]4967[/C][/ROW]
[ROW][C]2[/C][C]9256.25[/C][C]1648.57487353058[/C][C]5377[/C][/ROW]
[ROW][C]3[/C][C]9578.91666666667[/C][C]1970.32855858810[/C][C]6363[/C][/ROW]
[ROW][C]4[/C][C]9364.33333333333[/C][C]2239.12066073567[/C][C]6571[/C][/ROW]
[ROW][C]5[/C][C]8836.08333333333[/C][C]1826.87763725849[/C][C]5992[/C][/ROW]
[ROW][C]6[/C][C]9001.91666666667[/C][C]2300.88308969062[/C][C]7902[/C][/ROW]
[/TABLE]
Source: https://freestatistics.org/blog/index.php?pk=105397&T=1

Globally Unique Identifier (entire table): ba.freestatistics.org/blog/index.php?pk=105397&T=1

As an alternative you can also use a QR Code:  

The GUIDs for individual cells are displayed in the table below:

Standard Deviation-Mean Plot
SectionMeanStandard DeviationRange
192731599.149376159944967
29256.251648.574873530585377
39578.916666666671970.328558588106363
49364.333333333332239.120660735676571
58836.083333333331826.877637258495992
69001.916666666672300.883089690627902


Regression: S.E.(k) = alpha + beta * Mean(k)
alpha2193.35193148865
beta-0.0284788131180969
S.D.0.557639052501058
T-STAT-0.0510703348167009
p-value0.96171804723874

\begin{tabular}{lllllllll}
\hline
Regression: S.E.(k) = alpha + beta * Mean(k) \tabularnewline
alpha & 2193.35193148865 \tabularnewline
beta & -0.0284788131180969 \tabularnewline
S.D. & 0.557639052501058 \tabularnewline
T-STAT & -0.0510703348167009 \tabularnewline
p-value & 0.96171804723874 \tabularnewline
\hline
\end{tabular}
%Source: https://freestatistics.org/blog/index.php?pk=105397&T=2

[TABLE]
[ROW][C]Regression: S.E.(k) = alpha + beta * Mean(k)[/C][/ROW]
[ROW][C]alpha[/C][C]2193.35193148865[/C][/ROW]
[ROW][C]beta[/C][C]-0.0284788131180969[/C][/ROW]
[ROW][C]S.D.[/C][C]0.557639052501058[/C][/ROW]
[ROW][C]T-STAT[/C][C]-0.0510703348167009[/C][/ROW]
[ROW][C]p-value[/C][C]0.96171804723874[/C][/ROW]
[/TABLE]
Source: https://freestatistics.org/blog/index.php?pk=105397&T=2

Globally Unique Identifier (entire table): ba.freestatistics.org/blog/index.php?pk=105397&T=2

As an alternative you can also use a QR Code:  

The GUIDs for individual cells are displayed in the table below:

Regression: S.E.(k) = alpha + beta * Mean(k)
alpha2193.35193148865
beta-0.0284788131180969
S.D.0.557639052501058
T-STAT-0.0510703348167009
p-value0.96171804723874


Regression: ln S.E.(k) = alpha + beta * ln Mean(k)
alpha8.66080085240856
beta-0.121024298686971
S.D.2.65084857948783
T-STAT-0.0456549271140768
p-value0.965773665575391
Lambda1.12102429868697

\begin{tabular}{lllllllll}
\hline
Regression: ln S.E.(k) = alpha + beta * ln Mean(k) \tabularnewline
alpha & 8.66080085240856 \tabularnewline
beta & -0.121024298686971 \tabularnewline
S.D. & 2.65084857948783 \tabularnewline
T-STAT & -0.0456549271140768 \tabularnewline
p-value & 0.965773665575391 \tabularnewline
Lambda & 1.12102429868697 \tabularnewline
\hline
\end{tabular}
%Source: https://freestatistics.org/blog/index.php?pk=105397&T=3

[TABLE]
[ROW][C]Regression: ln S.E.(k) = alpha + beta * ln Mean(k)[/C][/ROW]
[ROW][C]alpha[/C][C]8.66080085240856[/C][/ROW]
[ROW][C]beta[/C][C]-0.121024298686971[/C][/ROW]
[ROW][C]S.D.[/C][C]2.65084857948783[/C][/ROW]
[ROW][C]T-STAT[/C][C]-0.0456549271140768[/C][/ROW]
[ROW][C]p-value[/C][C]0.965773665575391[/C][/ROW]
[ROW][C]Lambda[/C][C]1.12102429868697[/C][/ROW]
[/TABLE]
Source: https://freestatistics.org/blog/index.php?pk=105397&T=3

Globally Unique Identifier (entire table): ba.freestatistics.org/blog/index.php?pk=105397&T=3

As an alternative you can also use a QR Code:  

The GUIDs for individual cells are displayed in the table below:

Regression: ln S.E.(k) = alpha + beta * ln Mean(k)
alpha8.66080085240856
beta-0.121024298686971
S.D.2.65084857948783
T-STAT-0.0456549271140768
p-value0.965773665575391
Lambda1.12102429868697


Parameters (Session):
par1 = 12 ;
Parameters (R input):
par1 = 12 ;
R code (references can be found in the software module):
par1 <- as.numeric(par1)
(n <- length(x))
(np <- floor(n / par1))
arr <- array(NA,dim=c(par1,np))
j <- 0
k <- 1
for (i in 1:(np*par1))
{
j = j + 1
arr[j,k] <- x[i]
if (j == par1) {
j = 0
k=k+1
}
}
arr
arr.mean <- array(NA,dim=np)
arr.sd <- array(NA,dim=np)
arr.range <- array(NA,dim=np)
for (j in 1:np)
{
arr.mean[j] <- mean(arr[,j],na.rm=TRUE)
arr.sd[j] <- sd(arr[,j],na.rm=TRUE)
arr.range[j] <- max(arr[,j],na.rm=TRUE) - min(arr[,j],na.rm=TRUE)
}
arr.mean
arr.sd
arr.range
(lm1 <- lm(arr.sd~arr.mean))
(lnlm1 <- lm(log(arr.sd)~log(arr.mean)))
(lm2 <- lm(arr.range~arr.mean))
bitmap(file='test1.png')
plot(arr.mean,arr.sd,main='Standard Deviation-Mean Plot',xlab='mean',ylab='standard deviation')
dev.off()
bitmap(file='test2.png')
plot(arr.mean,arr.range,main='Range-Mean Plot',xlab='mean',ylab='range')
dev.off()
load(file='createtable')
a<-table.start()
a<-table.row.start(a)
a<-table.element(a,'Standard Deviation-Mean Plot',4,TRUE)
a<-table.row.end(a)
a<-table.row.start(a)
a<-table.element(a,'Section',header=TRUE)
a<-table.element(a,'Mean',header=TRUE)
a<-table.element(a,'Standard Deviation',header=TRUE)
a<-table.element(a,'Range',header=TRUE)
a<-table.row.end(a)
for (j in 1:np) {
a<-table.row.start(a)
a<-table.element(a,j,header=TRUE)
a<-table.element(a,arr.mean[j])
a<-table.element(a,arr.sd[j] )
a<-table.element(a,arr.range[j] )
a<-table.row.end(a)
}
a<-table.end(a)
table.save(a,file='mytable.tab')
a<-table.start()
a<-table.row.start(a)
a<-table.element(a,'Regression: S.E.(k) = alpha + beta * Mean(k)',2,TRUE)
a<-table.row.end(a)
a<-table.row.start(a)
a<-table.element(a,'alpha',header=TRUE)
a<-table.element(a,lm1$coefficients[[1]])
a<-table.row.end(a)
a<-table.row.start(a)
a<-table.element(a,'beta',header=TRUE)
a<-table.element(a,lm1$coefficients[[2]])
a<-table.row.end(a)
a<-table.row.start(a)
a<-table.element(a,'S.D.',header=TRUE)
a<-table.element(a,summary(lm1)$coefficients[2,2])
a<-table.row.end(a)
a<-table.row.start(a)
a<-table.element(a,'T-STAT',header=TRUE)
a<-table.element(a,summary(lm1)$coefficients[2,3])
a<-table.row.end(a)
a<-table.row.start(a)
a<-table.element(a,'p-value',header=TRUE)
a<-table.element(a,summary(lm1)$coefficients[2,4])
a<-table.row.end(a)
a<-table.end(a)
table.save(a,file='mytable1.tab')
a<-table.start()
a<-table.row.start(a)
a<-table.element(a,'Regression: ln S.E.(k) = alpha + beta * ln Mean(k)',2,TRUE)
a<-table.row.end(a)
a<-table.row.start(a)
a<-table.element(a,'alpha',header=TRUE)
a<-table.element(a,lnlm1$coefficients[[1]])
a<-table.row.end(a)
a<-table.row.start(a)
a<-table.element(a,'beta',header=TRUE)
a<-table.element(a,lnlm1$coefficients[[2]])
a<-table.row.end(a)
a<-table.row.start(a)
a<-table.element(a,'S.D.',header=TRUE)
a<-table.element(a,summary(lnlm1)$coefficients[2,2])
a<-table.row.end(a)
a<-table.row.start(a)
a<-table.element(a,'T-STAT',header=TRUE)
a<-table.element(a,summary(lnlm1)$coefficients[2,3])
a<-table.row.end(a)
a<-table.row.start(a)
a<-table.element(a,'p-value',header=TRUE)
a<-table.element(a,summary(lnlm1)$coefficients[2,4])
a<-table.row.end(a)
a<-table.row.start(a)
a<-table.element(a,'Lambda',header=TRUE)
a<-table.element(a,1-lnlm1$coefficients[[2]])
a<-table.row.end(a)
a<-table.end(a)
table.save(a,file='mytable2.tab')