Free Statistics

of Irreproducible Research!

Author's title

Author*The author of this computation has been verified*
R Software Modulerwasp_autocorrelation.wasp
Title produced by software(Partial) Autocorrelation Function
Date of computationSun, 05 Dec 2010 13:25:23 +0000
Cite this page as followsStatistical Computations at FreeStatistics.org, Office for Research Development and Education, URL https://freestatistics.org/blog/index.php?v=date/2010/Dec/05/t1291555531a38l0xhtzk5laix.htm/, Retrieved Wed, 01 May 2024 20:29:35 +0000
Statistical Computations at FreeStatistics.org, Office for Research Development and Education, URL https://freestatistics.org/blog/index.php?pk=105384, Retrieved Wed, 01 May 2024 20:29:35 +0000
QR Codes:

Original text written by user:
IsPrivate?No (this computation is public)
User-defined keywords
Estimated Impact109
Family? (F = Feedback message, R = changed R code, M = changed R Module, P = changed Parameters, D = changed Data)
-     [Univariate Data Series] [data set] [2008-12-01 19:54:57] [b98453cac15ba1066b407e146608df68]
- RMP   [(Partial) Autocorrelation Function] [Unemployment] [2010-11-29 09:05:21] [b98453cac15ba1066b407e146608df68]
-   PD      [(Partial) Autocorrelation Function] [] [2010-12-05 13:25:23] [6b67b7c8c7d0a997c30f007387afbdb8] [Current]
Feedback Forum

Post a new message
Dataseries X:
1579
2146
2462
3695
4831
5134
6250
5760
6249
2917
1741
2359
1511
2059
2635
2867
4403
5720
4502
5749
5627
2846
1762
2429
1169
2154
2249
2687
4359
5382
4459
6398
4596
3024
1887
2070
1351
2218
2461
3028
4784
4975
4607
6249
4809
3157
1910
2228
1594
2467
2222
3607
4685
4962
5770
5480
5000
3228
1993
2288
1580
2111
2192
3601
4665
4876
5813
5589
5331
3075
2002
2306
1507
1992
2487
3490
4647
5594
5611
5788
6204
3013
1931
2549
1504
2090
2702
2939
4500
6208
6415
5657
5964
3163
1997
2422
1376
2202
2683
3303
5202
5231
4880
7998
4977
3531
2025
2205
1442
2238
2179
3218
5139
4990
4914
6084
5672
3548
1793
2086


Summary of computational transaction
Raw Inputview raw input (R code)
Raw Outputview raw output of R engine
Computing time2 seconds
R Server'Sir Ronald Aylmer Fisher' @ 193.190.124.24

\begin{tabular}{lllllllll}
\hline
Summary of computational transaction \tabularnewline
Raw Input & view raw input (R code)  \tabularnewline
Raw Output & view raw output of R engine  \tabularnewline
Computing time & 2 seconds \tabularnewline
R Server & 'Sir Ronald Aylmer Fisher' @ 193.190.124.24 \tabularnewline
\hline
\end{tabular}
%Source: https://freestatistics.org/blog/index.php?pk=105384&T=0

[TABLE]
[ROW][C]Summary of computational transaction[/C][/ROW]
[ROW][C]Raw Input[/C][C]view raw input (R code) [/C][/ROW]
[ROW][C]Raw Output[/C][C]view raw output of R engine [/C][/ROW]
[ROW][C]Computing time[/C][C]2 seconds[/C][/ROW]
[ROW][C]R Server[/C][C]'Sir Ronald Aylmer Fisher' @ 193.190.124.24[/C][/ROW]
[/TABLE]
Source: https://freestatistics.org/blog/index.php?pk=105384&T=0

Globally Unique Identifier (entire table): ba.freestatistics.org/blog/index.php?pk=105384&T=0

As an alternative you can also use a QR Code:  

The GUIDs for individual cells are displayed in the table below:

Summary of computational transaction
Raw Inputview raw input (R code)
Raw Outputview raw output of R engine
Computing time2 seconds
R Server'Sir Ronald Aylmer Fisher' @ 193.190.124.24


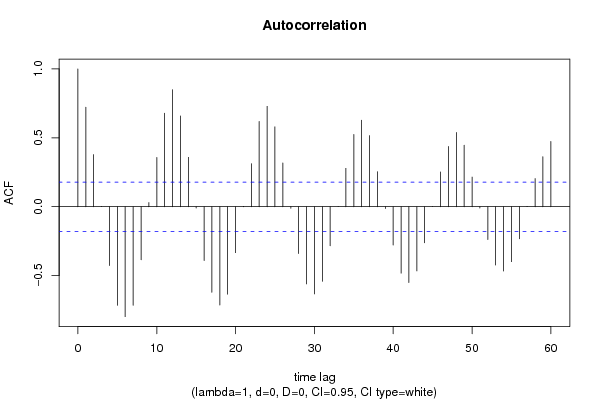
Autocorrelation Function
Time lag kACF(k)T-STATP-value
10.7219977.90910
20.3781184.14213.2e-05
30.001470.01610.493589
4-0.427046-4.67814e-06
5-0.715973-7.84310
6-0.798206-8.74390
7-0.71598-7.84320
8-0.385985-4.22832.3e-05
90.0296470.32480.372961
100.3574283.91547.5e-05
110.6785337.4330
120.849019.30040
130.6579967.2080
140.3581143.92297.3e-05
15-0.009708-0.10630.457743
16-0.390924-4.28241.9e-05
17-0.621464-6.80780
18-0.713787-7.81910
19-0.634949-6.95550
20-0.333587-3.65430.000192
210.0025380.02780.488933
220.3116113.41350.000438
230.618446.77470
240.7285957.98140
250.5794976.34810
260.316853.47090.000361
27-0.011895-0.13030.448273
28-0.339402-3.7180.000153
29-0.560649-6.14160
30-0.632975-6.93390
31-0.541916-5.93640
32-0.283434-3.10490.001188
33-0.000692-0.00760.496984
340.2783633.04930.001411
350.5242525.74290
360.6275786.87480
370.5161925.65460
380.2542082.78470.003114
39-0.013812-0.15130.439994
40-0.278256-3.04810.001416
41-0.482412-5.28460
42-0.549872-6.02350
43-0.466124-5.10611e-06
44-0.262502-2.87560.002387
45-0.000387-0.00420.498311
460.251552.75560.003386
470.4376464.79422e-06
480.5390295.90480
490.445694.88232e-06
500.2149422.35460.010084
51-0.009253-0.10140.459717
52-0.23888-2.61680.005009
53-0.42381-4.64264e-06
54-0.466444-5.10961e-06
55-0.398872-4.36941.3e-05
56-0.232515-2.54710.006064
570.0015610.01710.493193
580.2039982.23470.013645
590.3631833.97856e-05
600.4732055.18370

\begin{tabular}{lllllllll}
\hline
Autocorrelation Function \tabularnewline
Time lag k & ACF(k) & T-STAT & P-value \tabularnewline
1 & 0.721997 & 7.9091 & 0 \tabularnewline
2 & 0.378118 & 4.1421 & 3.2e-05 \tabularnewline
3 & 0.00147 & 0.0161 & 0.493589 \tabularnewline
4 & -0.427046 & -4.6781 & 4e-06 \tabularnewline
5 & -0.715973 & -7.8431 & 0 \tabularnewline
6 & -0.798206 & -8.7439 & 0 \tabularnewline
7 & -0.71598 & -7.8432 & 0 \tabularnewline
8 & -0.385985 & -4.2283 & 2.3e-05 \tabularnewline
9 & 0.029647 & 0.3248 & 0.372961 \tabularnewline
10 & 0.357428 & 3.9154 & 7.5e-05 \tabularnewline
11 & 0.678533 & 7.433 & 0 \tabularnewline
12 & 0.84901 & 9.3004 & 0 \tabularnewline
13 & 0.657996 & 7.208 & 0 \tabularnewline
14 & 0.358114 & 3.9229 & 7.3e-05 \tabularnewline
15 & -0.009708 & -0.1063 & 0.457743 \tabularnewline
16 & -0.390924 & -4.2824 & 1.9e-05 \tabularnewline
17 & -0.621464 & -6.8078 & 0 \tabularnewline
18 & -0.713787 & -7.8191 & 0 \tabularnewline
19 & -0.634949 & -6.9555 & 0 \tabularnewline
20 & -0.333587 & -3.6543 & 0.000192 \tabularnewline
21 & 0.002538 & 0.0278 & 0.488933 \tabularnewline
22 & 0.311611 & 3.4135 & 0.000438 \tabularnewline
23 & 0.61844 & 6.7747 & 0 \tabularnewline
24 & 0.728595 & 7.9814 & 0 \tabularnewline
25 & 0.579497 & 6.3481 & 0 \tabularnewline
26 & 0.31685 & 3.4709 & 0.000361 \tabularnewline
27 & -0.011895 & -0.1303 & 0.448273 \tabularnewline
28 & -0.339402 & -3.718 & 0.000153 \tabularnewline
29 & -0.560649 & -6.1416 & 0 \tabularnewline
30 & -0.632975 & -6.9339 & 0 \tabularnewline
31 & -0.541916 & -5.9364 & 0 \tabularnewline
32 & -0.283434 & -3.1049 & 0.001188 \tabularnewline
33 & -0.000692 & -0.0076 & 0.496984 \tabularnewline
34 & 0.278363 & 3.0493 & 0.001411 \tabularnewline
35 & 0.524252 & 5.7429 & 0 \tabularnewline
36 & 0.627578 & 6.8748 & 0 \tabularnewline
37 & 0.516192 & 5.6546 & 0 \tabularnewline
38 & 0.254208 & 2.7847 & 0.003114 \tabularnewline
39 & -0.013812 & -0.1513 & 0.439994 \tabularnewline
40 & -0.278256 & -3.0481 & 0.001416 \tabularnewline
41 & -0.482412 & -5.2846 & 0 \tabularnewline
42 & -0.549872 & -6.0235 & 0 \tabularnewline
43 & -0.466124 & -5.1061 & 1e-06 \tabularnewline
44 & -0.262502 & -2.8756 & 0.002387 \tabularnewline
45 & -0.000387 & -0.0042 & 0.498311 \tabularnewline
46 & 0.25155 & 2.7556 & 0.003386 \tabularnewline
47 & 0.437646 & 4.7942 & 2e-06 \tabularnewline
48 & 0.539029 & 5.9048 & 0 \tabularnewline
49 & 0.44569 & 4.8823 & 2e-06 \tabularnewline
50 & 0.214942 & 2.3546 & 0.010084 \tabularnewline
51 & -0.009253 & -0.1014 & 0.459717 \tabularnewline
52 & -0.23888 & -2.6168 & 0.005009 \tabularnewline
53 & -0.42381 & -4.6426 & 4e-06 \tabularnewline
54 & -0.466444 & -5.1096 & 1e-06 \tabularnewline
55 & -0.398872 & -4.3694 & 1.3e-05 \tabularnewline
56 & -0.232515 & -2.5471 & 0.006064 \tabularnewline
57 & 0.001561 & 0.0171 & 0.493193 \tabularnewline
58 & 0.203998 & 2.2347 & 0.013645 \tabularnewline
59 & 0.363183 & 3.9785 & 6e-05 \tabularnewline
60 & 0.473205 & 5.1837 & 0 \tabularnewline
\hline
\end{tabular}
%Source: https://freestatistics.org/blog/index.php?pk=105384&T=1

[TABLE]
[ROW][C]Autocorrelation Function[/C][/ROW]
[ROW][C]Time lag k[/C][C]ACF(k)[/C][C]T-STAT[/C][C]P-value[/C][/ROW]
[ROW][C]1[/C][C]0.721997[/C][C]7.9091[/C][C]0[/C][/ROW]
[ROW][C]2[/C][C]0.378118[/C][C]4.1421[/C][C]3.2e-05[/C][/ROW]
[ROW][C]3[/C][C]0.00147[/C][C]0.0161[/C][C]0.493589[/C][/ROW]
[ROW][C]4[/C][C]-0.427046[/C][C]-4.6781[/C][C]4e-06[/C][/ROW]
[ROW][C]5[/C][C]-0.715973[/C][C]-7.8431[/C][C]0[/C][/ROW]
[ROW][C]6[/C][C]-0.798206[/C][C]-8.7439[/C][C]0[/C][/ROW]
[ROW][C]7[/C][C]-0.71598[/C][C]-7.8432[/C][C]0[/C][/ROW]
[ROW][C]8[/C][C]-0.385985[/C][C]-4.2283[/C][C]2.3e-05[/C][/ROW]
[ROW][C]9[/C][C]0.029647[/C][C]0.3248[/C][C]0.372961[/C][/ROW]
[ROW][C]10[/C][C]0.357428[/C][C]3.9154[/C][C]7.5e-05[/C][/ROW]
[ROW][C]11[/C][C]0.678533[/C][C]7.433[/C][C]0[/C][/ROW]
[ROW][C]12[/C][C]0.84901[/C][C]9.3004[/C][C]0[/C][/ROW]
[ROW][C]13[/C][C]0.657996[/C][C]7.208[/C][C]0[/C][/ROW]
[ROW][C]14[/C][C]0.358114[/C][C]3.9229[/C][C]7.3e-05[/C][/ROW]
[ROW][C]15[/C][C]-0.009708[/C][C]-0.1063[/C][C]0.457743[/C][/ROW]
[ROW][C]16[/C][C]-0.390924[/C][C]-4.2824[/C][C]1.9e-05[/C][/ROW]
[ROW][C]17[/C][C]-0.621464[/C][C]-6.8078[/C][C]0[/C][/ROW]
[ROW][C]18[/C][C]-0.713787[/C][C]-7.8191[/C][C]0[/C][/ROW]
[ROW][C]19[/C][C]-0.634949[/C][C]-6.9555[/C][C]0[/C][/ROW]
[ROW][C]20[/C][C]-0.333587[/C][C]-3.6543[/C][C]0.000192[/C][/ROW]
[ROW][C]21[/C][C]0.002538[/C][C]0.0278[/C][C]0.488933[/C][/ROW]
[ROW][C]22[/C][C]0.311611[/C][C]3.4135[/C][C]0.000438[/C][/ROW]
[ROW][C]23[/C][C]0.61844[/C][C]6.7747[/C][C]0[/C][/ROW]
[ROW][C]24[/C][C]0.728595[/C][C]7.9814[/C][C]0[/C][/ROW]
[ROW][C]25[/C][C]0.579497[/C][C]6.3481[/C][C]0[/C][/ROW]
[ROW][C]26[/C][C]0.31685[/C][C]3.4709[/C][C]0.000361[/C][/ROW]
[ROW][C]27[/C][C]-0.011895[/C][C]-0.1303[/C][C]0.448273[/C][/ROW]
[ROW][C]28[/C][C]-0.339402[/C][C]-3.718[/C][C]0.000153[/C][/ROW]
[ROW][C]29[/C][C]-0.560649[/C][C]-6.1416[/C][C]0[/C][/ROW]
[ROW][C]30[/C][C]-0.632975[/C][C]-6.9339[/C][C]0[/C][/ROW]
[ROW][C]31[/C][C]-0.541916[/C][C]-5.9364[/C][C]0[/C][/ROW]
[ROW][C]32[/C][C]-0.283434[/C][C]-3.1049[/C][C]0.001188[/C][/ROW]
[ROW][C]33[/C][C]-0.000692[/C][C]-0.0076[/C][C]0.496984[/C][/ROW]
[ROW][C]34[/C][C]0.278363[/C][C]3.0493[/C][C]0.001411[/C][/ROW]
[ROW][C]35[/C][C]0.524252[/C][C]5.7429[/C][C]0[/C][/ROW]
[ROW][C]36[/C][C]0.627578[/C][C]6.8748[/C][C]0[/C][/ROW]
[ROW][C]37[/C][C]0.516192[/C][C]5.6546[/C][C]0[/C][/ROW]
[ROW][C]38[/C][C]0.254208[/C][C]2.7847[/C][C]0.003114[/C][/ROW]
[ROW][C]39[/C][C]-0.013812[/C][C]-0.1513[/C][C]0.439994[/C][/ROW]
[ROW][C]40[/C][C]-0.278256[/C][C]-3.0481[/C][C]0.001416[/C][/ROW]
[ROW][C]41[/C][C]-0.482412[/C][C]-5.2846[/C][C]0[/C][/ROW]
[ROW][C]42[/C][C]-0.549872[/C][C]-6.0235[/C][C]0[/C][/ROW]
[ROW][C]43[/C][C]-0.466124[/C][C]-5.1061[/C][C]1e-06[/C][/ROW]
[ROW][C]44[/C][C]-0.262502[/C][C]-2.8756[/C][C]0.002387[/C][/ROW]
[ROW][C]45[/C][C]-0.000387[/C][C]-0.0042[/C][C]0.498311[/C][/ROW]
[ROW][C]46[/C][C]0.25155[/C][C]2.7556[/C][C]0.003386[/C][/ROW]
[ROW][C]47[/C][C]0.437646[/C][C]4.7942[/C][C]2e-06[/C][/ROW]
[ROW][C]48[/C][C]0.539029[/C][C]5.9048[/C][C]0[/C][/ROW]
[ROW][C]49[/C][C]0.44569[/C][C]4.8823[/C][C]2e-06[/C][/ROW]
[ROW][C]50[/C][C]0.214942[/C][C]2.3546[/C][C]0.010084[/C][/ROW]
[ROW][C]51[/C][C]-0.009253[/C][C]-0.1014[/C][C]0.459717[/C][/ROW]
[ROW][C]52[/C][C]-0.23888[/C][C]-2.6168[/C][C]0.005009[/C][/ROW]
[ROW][C]53[/C][C]-0.42381[/C][C]-4.6426[/C][C]4e-06[/C][/ROW]
[ROW][C]54[/C][C]-0.466444[/C][C]-5.1096[/C][C]1e-06[/C][/ROW]
[ROW][C]55[/C][C]-0.398872[/C][C]-4.3694[/C][C]1.3e-05[/C][/ROW]
[ROW][C]56[/C][C]-0.232515[/C][C]-2.5471[/C][C]0.006064[/C][/ROW]
[ROW][C]57[/C][C]0.001561[/C][C]0.0171[/C][C]0.493193[/C][/ROW]
[ROW][C]58[/C][C]0.203998[/C][C]2.2347[/C][C]0.013645[/C][/ROW]
[ROW][C]59[/C][C]0.363183[/C][C]3.9785[/C][C]6e-05[/C][/ROW]
[ROW][C]60[/C][C]0.473205[/C][C]5.1837[/C][C]0[/C][/ROW]
[/TABLE]
Source: https://freestatistics.org/blog/index.php?pk=105384&T=1

Globally Unique Identifier (entire table): ba.freestatistics.org/blog/index.php?pk=105384&T=1

As an alternative you can also use a QR Code:  

The GUIDs for individual cells are displayed in the table below:

Autocorrelation Function
Time lag kACF(k)T-STATP-value
10.7219977.90910
20.3781184.14213.2e-05
30.001470.01610.493589
4-0.427046-4.67814e-06
5-0.715973-7.84310
6-0.798206-8.74390
7-0.71598-7.84320
8-0.385985-4.22832.3e-05
90.0296470.32480.372961
100.3574283.91547.5e-05
110.6785337.4330
120.849019.30040
130.6579967.2080
140.3581143.92297.3e-05
15-0.009708-0.10630.457743
16-0.390924-4.28241.9e-05
17-0.621464-6.80780
18-0.713787-7.81910
19-0.634949-6.95550
20-0.333587-3.65430.000192
210.0025380.02780.488933
220.3116113.41350.000438
230.618446.77470
240.7285957.98140
250.5794976.34810
260.316853.47090.000361
27-0.011895-0.13030.448273
28-0.339402-3.7180.000153
29-0.560649-6.14160
30-0.632975-6.93390
31-0.541916-5.93640
32-0.283434-3.10490.001188
33-0.000692-0.00760.496984
340.2783633.04930.001411
350.5242525.74290
360.6275786.87480
370.5161925.65460
380.2542082.78470.003114
39-0.013812-0.15130.439994
40-0.278256-3.04810.001416
41-0.482412-5.28460
42-0.549872-6.02350
43-0.466124-5.10611e-06
44-0.262502-2.87560.002387
45-0.000387-0.00420.498311
460.251552.75560.003386
470.4376464.79422e-06
480.5390295.90480
490.445694.88232e-06
500.2149422.35460.010084
51-0.009253-0.10140.459717
52-0.23888-2.61680.005009
53-0.42381-4.64264e-06
54-0.466444-5.10961e-06
55-0.398872-4.36941.3e-05
56-0.232515-2.54710.006064
570.0015610.01710.493193
580.2039982.23470.013645
590.3631833.97856e-05
600.4732055.18370


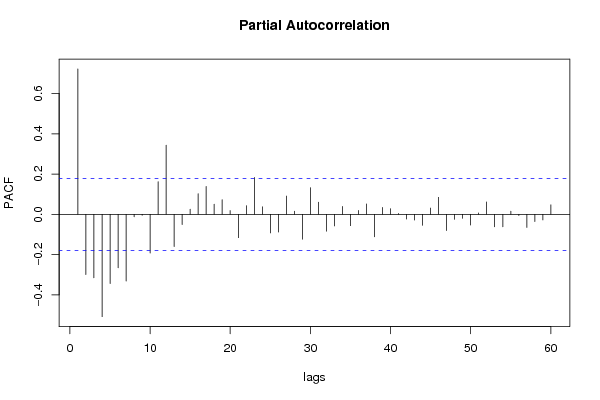
Partial Autocorrelation Function
Time lag kPACF(k)T-STATP-value
10.7219977.90910
2-0.299049-3.27590.000689
3-0.314878-3.44930.000388
4-0.508132-5.56630
5-0.343824-3.76640.000129
6-0.265166-2.90470.002188
7-0.330766-3.62340.000214
8-0.012209-0.13370.446917
9-0.005084-0.05570.477842
10-0.191771-2.10070.018879
110.1614861.7690.039718
120.3435923.76390.00013
13-0.160301-1.7560.040819
14-0.050542-0.55370.290421
150.0254270.27850.39054
160.1021071.11850.132788
170.1386451.51880.065724
180.0502980.5510.291332
190.0727320.79670.213588
200.0184970.20260.419885
21-0.11584-1.2690.103454
220.0424910.46550.321221
230.1828662.00320.023704
240.0372920.40850.34181
25-0.092168-1.00970.157346
26-0.08763-0.95990.169509
270.0906920.99350.161237
280.0157240.17220.431766
29-0.123171-1.34930.089895
300.1319171.44510.075522
310.0600840.65820.25584
32-0.083436-0.9140.181276
33-0.057407-0.62890.265318
340.0392380.42980.334045
35-0.056313-0.61690.269242
360.0193940.21240.416059
370.051410.56320.287187
38-0.111281-1.2190.112614
390.0341110.37370.354654
400.0274160.30030.382222
410.0041190.04510.482041
42-0.02351-0.25750.398602
43-0.028106-0.30790.379351
44-0.054615-0.59830.275391
450.0310140.33970.367323
460.0844670.92530.178336
47-0.080816-0.88530.188884
48-0.02429-0.26610.395317
49-0.019711-0.21590.414709
50-0.052721-0.57750.282333
510.0063450.06950.472353
520.0617240.67620.250122
53-0.0621-0.68030.248823
54-0.061369-0.67230.251355
550.0154280.1690.433039
56-0.005782-0.06330.474803
57-0.064841-0.71030.239448
58-0.035646-0.39050.348437
59-0.027818-0.30470.380549
600.0472140.51720.302984

\begin{tabular}{lllllllll}
\hline
Partial Autocorrelation Function \tabularnewline
Time lag k & PACF(k) & T-STAT & P-value \tabularnewline
1 & 0.721997 & 7.9091 & 0 \tabularnewline
2 & -0.299049 & -3.2759 & 0.000689 \tabularnewline
3 & -0.314878 & -3.4493 & 0.000388 \tabularnewline
4 & -0.508132 & -5.5663 & 0 \tabularnewline
5 & -0.343824 & -3.7664 & 0.000129 \tabularnewline
6 & -0.265166 & -2.9047 & 0.002188 \tabularnewline
7 & -0.330766 & -3.6234 & 0.000214 \tabularnewline
8 & -0.012209 & -0.1337 & 0.446917 \tabularnewline
9 & -0.005084 & -0.0557 & 0.477842 \tabularnewline
10 & -0.191771 & -2.1007 & 0.018879 \tabularnewline
11 & 0.161486 & 1.769 & 0.039718 \tabularnewline
12 & 0.343592 & 3.7639 & 0.00013 \tabularnewline
13 & -0.160301 & -1.756 & 0.040819 \tabularnewline
14 & -0.050542 & -0.5537 & 0.290421 \tabularnewline
15 & 0.025427 & 0.2785 & 0.39054 \tabularnewline
16 & 0.102107 & 1.1185 & 0.132788 \tabularnewline
17 & 0.138645 & 1.5188 & 0.065724 \tabularnewline
18 & 0.050298 & 0.551 & 0.291332 \tabularnewline
19 & 0.072732 & 0.7967 & 0.213588 \tabularnewline
20 & 0.018497 & 0.2026 & 0.419885 \tabularnewline
21 & -0.11584 & -1.269 & 0.103454 \tabularnewline
22 & 0.042491 & 0.4655 & 0.321221 \tabularnewline
23 & 0.182866 & 2.0032 & 0.023704 \tabularnewline
24 & 0.037292 & 0.4085 & 0.34181 \tabularnewline
25 & -0.092168 & -1.0097 & 0.157346 \tabularnewline
26 & -0.08763 & -0.9599 & 0.169509 \tabularnewline
27 & 0.090692 & 0.9935 & 0.161237 \tabularnewline
28 & 0.015724 & 0.1722 & 0.431766 \tabularnewline
29 & -0.123171 & -1.3493 & 0.089895 \tabularnewline
30 & 0.131917 & 1.4451 & 0.075522 \tabularnewline
31 & 0.060084 & 0.6582 & 0.25584 \tabularnewline
32 & -0.083436 & -0.914 & 0.181276 \tabularnewline
33 & -0.057407 & -0.6289 & 0.265318 \tabularnewline
34 & 0.039238 & 0.4298 & 0.334045 \tabularnewline
35 & -0.056313 & -0.6169 & 0.269242 \tabularnewline
36 & 0.019394 & 0.2124 & 0.416059 \tabularnewline
37 & 0.05141 & 0.5632 & 0.287187 \tabularnewline
38 & -0.111281 & -1.219 & 0.112614 \tabularnewline
39 & 0.034111 & 0.3737 & 0.354654 \tabularnewline
40 & 0.027416 & 0.3003 & 0.382222 \tabularnewline
41 & 0.004119 & 0.0451 & 0.482041 \tabularnewline
42 & -0.02351 & -0.2575 & 0.398602 \tabularnewline
43 & -0.028106 & -0.3079 & 0.379351 \tabularnewline
44 & -0.054615 & -0.5983 & 0.275391 \tabularnewline
45 & 0.031014 & 0.3397 & 0.367323 \tabularnewline
46 & 0.084467 & 0.9253 & 0.178336 \tabularnewline
47 & -0.080816 & -0.8853 & 0.188884 \tabularnewline
48 & -0.02429 & -0.2661 & 0.395317 \tabularnewline
49 & -0.019711 & -0.2159 & 0.414709 \tabularnewline
50 & -0.052721 & -0.5775 & 0.282333 \tabularnewline
51 & 0.006345 & 0.0695 & 0.472353 \tabularnewline
52 & 0.061724 & 0.6762 & 0.250122 \tabularnewline
53 & -0.0621 & -0.6803 & 0.248823 \tabularnewline
54 & -0.061369 & -0.6723 & 0.251355 \tabularnewline
55 & 0.015428 & 0.169 & 0.433039 \tabularnewline
56 & -0.005782 & -0.0633 & 0.474803 \tabularnewline
57 & -0.064841 & -0.7103 & 0.239448 \tabularnewline
58 & -0.035646 & -0.3905 & 0.348437 \tabularnewline
59 & -0.027818 & -0.3047 & 0.380549 \tabularnewline
60 & 0.047214 & 0.5172 & 0.302984 \tabularnewline
\hline
\end{tabular}
%Source: https://freestatistics.org/blog/index.php?pk=105384&T=2

[TABLE]
[ROW][C]Partial Autocorrelation Function[/C][/ROW]
[ROW][C]Time lag k[/C][C]PACF(k)[/C][C]T-STAT[/C][C]P-value[/C][/ROW]
[ROW][C]1[/C][C]0.721997[/C][C]7.9091[/C][C]0[/C][/ROW]
[ROW][C]2[/C][C]-0.299049[/C][C]-3.2759[/C][C]0.000689[/C][/ROW]
[ROW][C]3[/C][C]-0.314878[/C][C]-3.4493[/C][C]0.000388[/C][/ROW]
[ROW][C]4[/C][C]-0.508132[/C][C]-5.5663[/C][C]0[/C][/ROW]
[ROW][C]5[/C][C]-0.343824[/C][C]-3.7664[/C][C]0.000129[/C][/ROW]
[ROW][C]6[/C][C]-0.265166[/C][C]-2.9047[/C][C]0.002188[/C][/ROW]
[ROW][C]7[/C][C]-0.330766[/C][C]-3.6234[/C][C]0.000214[/C][/ROW]
[ROW][C]8[/C][C]-0.012209[/C][C]-0.1337[/C][C]0.446917[/C][/ROW]
[ROW][C]9[/C][C]-0.005084[/C][C]-0.0557[/C][C]0.477842[/C][/ROW]
[ROW][C]10[/C][C]-0.191771[/C][C]-2.1007[/C][C]0.018879[/C][/ROW]
[ROW][C]11[/C][C]0.161486[/C][C]1.769[/C][C]0.039718[/C][/ROW]
[ROW][C]12[/C][C]0.343592[/C][C]3.7639[/C][C]0.00013[/C][/ROW]
[ROW][C]13[/C][C]-0.160301[/C][C]-1.756[/C][C]0.040819[/C][/ROW]
[ROW][C]14[/C][C]-0.050542[/C][C]-0.5537[/C][C]0.290421[/C][/ROW]
[ROW][C]15[/C][C]0.025427[/C][C]0.2785[/C][C]0.39054[/C][/ROW]
[ROW][C]16[/C][C]0.102107[/C][C]1.1185[/C][C]0.132788[/C][/ROW]
[ROW][C]17[/C][C]0.138645[/C][C]1.5188[/C][C]0.065724[/C][/ROW]
[ROW][C]18[/C][C]0.050298[/C][C]0.551[/C][C]0.291332[/C][/ROW]
[ROW][C]19[/C][C]0.072732[/C][C]0.7967[/C][C]0.213588[/C][/ROW]
[ROW][C]20[/C][C]0.018497[/C][C]0.2026[/C][C]0.419885[/C][/ROW]
[ROW][C]21[/C][C]-0.11584[/C][C]-1.269[/C][C]0.103454[/C][/ROW]
[ROW][C]22[/C][C]0.042491[/C][C]0.4655[/C][C]0.321221[/C][/ROW]
[ROW][C]23[/C][C]0.182866[/C][C]2.0032[/C][C]0.023704[/C][/ROW]
[ROW][C]24[/C][C]0.037292[/C][C]0.4085[/C][C]0.34181[/C][/ROW]
[ROW][C]25[/C][C]-0.092168[/C][C]-1.0097[/C][C]0.157346[/C][/ROW]
[ROW][C]26[/C][C]-0.08763[/C][C]-0.9599[/C][C]0.169509[/C][/ROW]
[ROW][C]27[/C][C]0.090692[/C][C]0.9935[/C][C]0.161237[/C][/ROW]
[ROW][C]28[/C][C]0.015724[/C][C]0.1722[/C][C]0.431766[/C][/ROW]
[ROW][C]29[/C][C]-0.123171[/C][C]-1.3493[/C][C]0.089895[/C][/ROW]
[ROW][C]30[/C][C]0.131917[/C][C]1.4451[/C][C]0.075522[/C][/ROW]
[ROW][C]31[/C][C]0.060084[/C][C]0.6582[/C][C]0.25584[/C][/ROW]
[ROW][C]32[/C][C]-0.083436[/C][C]-0.914[/C][C]0.181276[/C][/ROW]
[ROW][C]33[/C][C]-0.057407[/C][C]-0.6289[/C][C]0.265318[/C][/ROW]
[ROW][C]34[/C][C]0.039238[/C][C]0.4298[/C][C]0.334045[/C][/ROW]
[ROW][C]35[/C][C]-0.056313[/C][C]-0.6169[/C][C]0.269242[/C][/ROW]
[ROW][C]36[/C][C]0.019394[/C][C]0.2124[/C][C]0.416059[/C][/ROW]
[ROW][C]37[/C][C]0.05141[/C][C]0.5632[/C][C]0.287187[/C][/ROW]
[ROW][C]38[/C][C]-0.111281[/C][C]-1.219[/C][C]0.112614[/C][/ROW]
[ROW][C]39[/C][C]0.034111[/C][C]0.3737[/C][C]0.354654[/C][/ROW]
[ROW][C]40[/C][C]0.027416[/C][C]0.3003[/C][C]0.382222[/C][/ROW]
[ROW][C]41[/C][C]0.004119[/C][C]0.0451[/C][C]0.482041[/C][/ROW]
[ROW][C]42[/C][C]-0.02351[/C][C]-0.2575[/C][C]0.398602[/C][/ROW]
[ROW][C]43[/C][C]-0.028106[/C][C]-0.3079[/C][C]0.379351[/C][/ROW]
[ROW][C]44[/C][C]-0.054615[/C][C]-0.5983[/C][C]0.275391[/C][/ROW]
[ROW][C]45[/C][C]0.031014[/C][C]0.3397[/C][C]0.367323[/C][/ROW]
[ROW][C]46[/C][C]0.084467[/C][C]0.9253[/C][C]0.178336[/C][/ROW]
[ROW][C]47[/C][C]-0.080816[/C][C]-0.8853[/C][C]0.188884[/C][/ROW]
[ROW][C]48[/C][C]-0.02429[/C][C]-0.2661[/C][C]0.395317[/C][/ROW]
[ROW][C]49[/C][C]-0.019711[/C][C]-0.2159[/C][C]0.414709[/C][/ROW]
[ROW][C]50[/C][C]-0.052721[/C][C]-0.5775[/C][C]0.282333[/C][/ROW]
[ROW][C]51[/C][C]0.006345[/C][C]0.0695[/C][C]0.472353[/C][/ROW]
[ROW][C]52[/C][C]0.061724[/C][C]0.6762[/C][C]0.250122[/C][/ROW]
[ROW][C]53[/C][C]-0.0621[/C][C]-0.6803[/C][C]0.248823[/C][/ROW]
[ROW][C]54[/C][C]-0.061369[/C][C]-0.6723[/C][C]0.251355[/C][/ROW]
[ROW][C]55[/C][C]0.015428[/C][C]0.169[/C][C]0.433039[/C][/ROW]
[ROW][C]56[/C][C]-0.005782[/C][C]-0.0633[/C][C]0.474803[/C][/ROW]
[ROW][C]57[/C][C]-0.064841[/C][C]-0.7103[/C][C]0.239448[/C][/ROW]
[ROW][C]58[/C][C]-0.035646[/C][C]-0.3905[/C][C]0.348437[/C][/ROW]
[ROW][C]59[/C][C]-0.027818[/C][C]-0.3047[/C][C]0.380549[/C][/ROW]
[ROW][C]60[/C][C]0.047214[/C][C]0.5172[/C][C]0.302984[/C][/ROW]
[/TABLE]
Source: https://freestatistics.org/blog/index.php?pk=105384&T=2

Globally Unique Identifier (entire table): ba.freestatistics.org/blog/index.php?pk=105384&T=2

As an alternative you can also use a QR Code:  

The GUIDs for individual cells are displayed in the table below:

Partial Autocorrelation Function
Time lag kPACF(k)T-STATP-value
10.7219977.90910
2-0.299049-3.27590.000689
3-0.314878-3.44930.000388
4-0.508132-5.56630
5-0.343824-3.76640.000129
6-0.265166-2.90470.002188
7-0.330766-3.62340.000214
8-0.012209-0.13370.446917
9-0.005084-0.05570.477842
10-0.191771-2.10070.018879
110.1614861.7690.039718
120.3435923.76390.00013
13-0.160301-1.7560.040819
14-0.050542-0.55370.290421
150.0254270.27850.39054
160.1021071.11850.132788
170.1386451.51880.065724
180.0502980.5510.291332
190.0727320.79670.213588
200.0184970.20260.419885
21-0.11584-1.2690.103454
220.0424910.46550.321221
230.1828662.00320.023704
240.0372920.40850.34181
25-0.092168-1.00970.157346
26-0.08763-0.95990.169509
270.0906920.99350.161237
280.0157240.17220.431766
29-0.123171-1.34930.089895
300.1319171.44510.075522
310.0600840.65820.25584
32-0.083436-0.9140.181276
33-0.057407-0.62890.265318
340.0392380.42980.334045
35-0.056313-0.61690.269242
360.0193940.21240.416059
370.051410.56320.287187
38-0.111281-1.2190.112614
390.0341110.37370.354654
400.0274160.30030.382222
410.0041190.04510.482041
42-0.02351-0.25750.398602
43-0.028106-0.30790.379351
44-0.054615-0.59830.275391
450.0310140.33970.367323
460.0844670.92530.178336
47-0.080816-0.88530.188884
48-0.02429-0.26610.395317
49-0.019711-0.21590.414709
50-0.052721-0.57750.282333
510.0063450.06950.472353
520.0617240.67620.250122
53-0.0621-0.68030.248823
54-0.061369-0.67230.251355
550.0154280.1690.433039
56-0.005782-0.06330.474803
57-0.064841-0.71030.239448
58-0.035646-0.39050.348437
59-0.027818-0.30470.380549
600.0472140.51720.302984


Parameters (Session):
par1 = 60 ; par2 = 1 ; par3 = 0 ; par4 = 0 ; par5 = 12 ; par6 = White Noise ; par7 = 0.95 ;
Parameters (R input):
par1 = 60 ; par2 = 1 ; par3 = 0 ; par4 = 0 ; par5 = 12 ; par6 = White Noise ; par7 = 0.95 ;
R code (references can be found in the software module):
if (par1 == 'Default') {
par1 = 10*log10(length(x))
} else {
par1 <- as.numeric(par1)
}
par2 <- as.numeric(par2)
par3 <- as.numeric(par3)
par4 <- as.numeric(par4)
par5 <- as.numeric(par5)
if (par6 == 'White Noise') par6 <- 'white' else par6 <- 'ma'
par7 <- as.numeric(par7)
if (par2 == 0) {
x <- log(x)
} else {
x <- (x ^ par2 - 1) / par2
}
if (par3 > 0) x <- diff(x,lag=1,difference=par3)
if (par4 > 0) x <- diff(x,lag=par5,difference=par4)
bitmap(file='pic1.png')
racf <- acf(x, par1, main='Autocorrelation', xlab='time lag', ylab='ACF', ci.type=par6, ci=par7, sub=paste('(lambda=',par2,', d=',par3,', D=',par4,', CI=', par7, ', CI type=',par6,')',sep=''))
dev.off()
bitmap(file='pic2.png')
rpacf <- pacf(x,par1,main='Partial Autocorrelation',xlab='lags',ylab='PACF')
dev.off()
(myacf <- c(racf$acf))
(mypacf <- c(rpacf$acf))
lengthx <- length(x)
sqrtn <- sqrt(lengthx)
load(file='createtable')
a<-table.start()
a<-table.row.start(a)
a<-table.element(a,'Autocorrelation Function',4,TRUE)
a<-table.row.end(a)
a<-table.row.start(a)
a<-table.element(a,'Time lag k',header=TRUE)
a<-table.element(a,hyperlink('basics.htm','ACF(k)','click here for more information about the Autocorrelation Function'),header=TRUE)
a<-table.element(a,'T-STAT',header=TRUE)
a<-table.element(a,'P-value',header=TRUE)
a<-table.row.end(a)
for (i in 2:(par1+1)) {
a<-table.row.start(a)
a<-table.element(a,i-1,header=TRUE)
a<-table.element(a,round(myacf[i],6))
mytstat <- myacf[i]*sqrtn
a<-table.element(a,round(mytstat,4))
a<-table.element(a,round(1-pt(abs(mytstat),lengthx),6))
a<-table.row.end(a)
}
a<-table.end(a)
table.save(a,file='mytable.tab')
a<-table.start()
a<-table.row.start(a)
a<-table.element(a,'Partial Autocorrelation Function',4,TRUE)
a<-table.row.end(a)
a<-table.row.start(a)
a<-table.element(a,'Time lag k',header=TRUE)
a<-table.element(a,hyperlink('basics.htm','PACF(k)','click here for more information about the Partial Autocorrelation Function'),header=TRUE)
a<-table.element(a,'T-STAT',header=TRUE)
a<-table.element(a,'P-value',header=TRUE)
a<-table.row.end(a)
for (i in 1:par1) {
a<-table.row.start(a)
a<-table.element(a,i,header=TRUE)
a<-table.element(a,round(mypacf[i],6))
mytstat <- mypacf[i]*sqrtn
a<-table.element(a,round(mytstat,4))
a<-table.element(a,round(1-pt(abs(mytstat),lengthx),6))
a<-table.row.end(a)
}
a<-table.end(a)
table.save(a,file='mytable1.tab')