Free Statistics

of Irreproducible Research!

Author's title

Author*The author of this computation has been verified*
R Software Modulerwasp_arimaforecasting.wasp
Title produced by softwareARIMA Forecasting
Date of computationSun, 05 Dec 2010 13:03:55 +0000
Cite this page as followsStatistical Computations at FreeStatistics.org, Office for Research Development and Education, URL https://freestatistics.org/blog/index.php?v=date/2010/Dec/05/t12915545897smn3gdg15sv75k.htm/, Retrieved Wed, 01 May 2024 22:58:01 +0000
Statistical Computations at FreeStatistics.org, Office for Research Development and Education, URL https://freestatistics.org/blog/index.php?pk=105379, Retrieved Wed, 01 May 2024 22:58:01 +0000
QR Codes:

Original text written by user:
IsPrivate?No (this computation is public)
User-defined keywords
Estimated Impact128
Family? (F = Feedback message, R = changed R code, M = changed R Module, P = changed Parameters, D = changed Data)
-     [Univariate Data Series] [data set] [2008-12-01 19:54:57] [b98453cac15ba1066b407e146608df68]
- RMP   [Standard Deviation-Mean Plot] [Unemployment] [2010-11-29 10:34:47] [b98453cac15ba1066b407e146608df68]
- RMP     [ARIMA Forecasting] [Unemployment] [2010-11-29 20:46:45] [b98453cac15ba1066b407e146608df68]
-   PD        [ARIMA Forecasting] [workshop 9] [2010-12-05 13:03:55] [3f56c8f677e988de577e4e00a8180a48] [Current]
Feedback Forum

Post a new message
Dataseries X:
2938
2909
3141
2427
3059
2918
2901
2823
2798
2892
2967
2397
3458
3024
3100
2904
3056
2771
2897
2772
2857
3020
2648
2364
3194
3013
2560
3074
2746
2846
3184
2354
3080
2963
2430
2296
2416
2647
2789
2685
2666
2882
2953
2127
2563
3061
2809
2861
2781
2555
3206
2570
2410
3195
2736
2743
2934
2668
2907
2866
2983
2878
3225
2515
3193
2663
2908
2896
2853
3028
3053
2455
3401
2969
3243
2849
3296
3121
3194
3023
2984
3525
3116
2383
3294
2882
2820
2583
2803
2767
2945
2716
2644
2956
2598
2171
2994
2645
2724
2550
2707
2679
2878
2307
2496
2637
2436
2426
2607
2533
2888
2520
2229
2804
2661
2547
2509
2465
2629
2706
2666
2432
2836
2888
2566
2802
2611
2683
2675
2434
2693
2619
2903
2550
2900
2456
2912
2883
2464
2655
2447
2592
2698
2274
2901
2397
3004
2614
2882
2671
2761
2806
2414
2673
2748
2112
2903
2633
2684
2861
2504
2708
2961
2535
2688
2699
2469
2585
2582
2480
2709
2441
2182
2585
2881
2422
2690
2659
2535
2613


Summary of computational transaction
Raw Inputview raw input (R code)
Raw Outputview raw output of R engine
Computing time4 seconds
R Server'George Udny Yule' @ 72.249.76.132

\begin{tabular}{lllllllll}
\hline
Summary of computational transaction \tabularnewline
Raw Input & view raw input (R code)  \tabularnewline
Raw Output & view raw output of R engine  \tabularnewline
Computing time & 4 seconds \tabularnewline
R Server & 'George Udny Yule' @ 72.249.76.132 \tabularnewline
\hline
\end{tabular}
%Source: https://freestatistics.org/blog/index.php?pk=105379&T=0

[TABLE]
[ROW][C]Summary of computational transaction[/C][/ROW]
[ROW][C]Raw Input[/C][C]view raw input (R code) [/C][/ROW]
[ROW][C]Raw Output[/C][C]view raw output of R engine [/C][/ROW]
[ROW][C]Computing time[/C][C]4 seconds[/C][/ROW]
[ROW][C]R Server[/C][C]'George Udny Yule' @ 72.249.76.132[/C][/ROW]
[/TABLE]
Source: https://freestatistics.org/blog/index.php?pk=105379&T=0

Globally Unique Identifier (entire table): ba.freestatistics.org/blog/index.php?pk=105379&T=0

As an alternative you can also use a QR Code:  

The GUIDs for individual cells are displayed in the table below:

Summary of computational transaction
Raw Inputview raw input (R code)
Raw Outputview raw output of R engine
Computing time4 seconds
R Server'George Udny Yule' @ 72.249.76.132


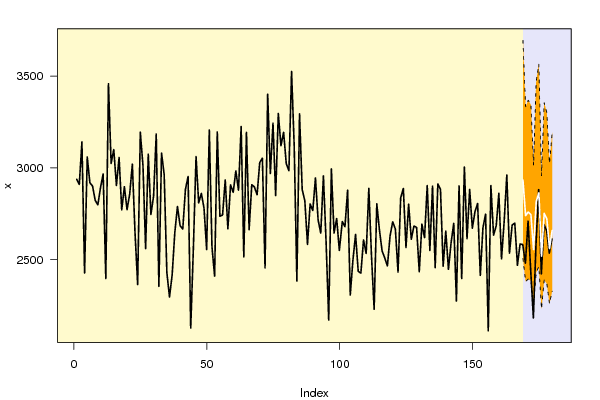
Univariate ARIMA Extrapolation Forecast
timeY[t]F[t]95% LB95% UBp-value(H0: Y[t] = F[t])P(F[t]>Y[t-1])P(F[t]>Y[t-s])P(F[t]>Y[168])
1562112-------
1572903-------
1582633-------
1592684-------
1602861-------
1612504-------
1622708-------
1632961-------
1642535-------
1652688-------
1662699-------
1672469-------
1682585-------
16925822933.05872506.22213694.21420.1830.81490.53080.8149
17024802739.65672380.78823332.60840.19540.69890.63780.6954
17127092759.35742393.66643368.30.43560.81570.59580.7127
17224412745.11372384.35033342.49020.15920.54720.35190.7003
17321822554.59492256.30023014.57550.05620.68580.58530.4485
17425852815.53882430.06353472.05480.24560.97070.62590.7544
17528812864.09292461.07513564.36180.48110.78260.39310.7826
17624222518.87282231.57382956.35070.33210.05240.47120.3835
17726902751.80492388.7313354.59070.42040.85820.58220.7062
17826592722.32952369.37453301.60460.41520.54360.53150.6789
17925352560.03542260.04613023.52690.45780.33780.64990.458
18026132659.3792327.52323191.09630.43210.67670.6080.608

\begin{tabular}{lllllllll}
\hline
Univariate ARIMA Extrapolation Forecast \tabularnewline
time & Y[t] & F[t] & 95% LB & 95% UB & p-value(H0: Y[t] = F[t]) & P(F[t]>Y[t-1]) & P(F[t]>Y[t-s]) & P(F[t]>Y[168]) \tabularnewline
156 & 2112 & - & - & - & - & - & - & - \tabularnewline
157 & 2903 & - & - & - & - & - & - & - \tabularnewline
158 & 2633 & - & - & - & - & - & - & - \tabularnewline
159 & 2684 & - & - & - & - & - & - & - \tabularnewline
160 & 2861 & - & - & - & - & - & - & - \tabularnewline
161 & 2504 & - & - & - & - & - & - & - \tabularnewline
162 & 2708 & - & - & - & - & - & - & - \tabularnewline
163 & 2961 & - & - & - & - & - & - & - \tabularnewline
164 & 2535 & - & - & - & - & - & - & - \tabularnewline
165 & 2688 & - & - & - & - & - & - & - \tabularnewline
166 & 2699 & - & - & - & - & - & - & - \tabularnewline
167 & 2469 & - & - & - & - & - & - & - \tabularnewline
168 & 2585 & - & - & - & - & - & - & - \tabularnewline
169 & 2582 & 2933.0587 & 2506.2221 & 3694.2142 & 0.183 & 0.8149 & 0.5308 & 0.8149 \tabularnewline
170 & 2480 & 2739.6567 & 2380.7882 & 3332.6084 & 0.1954 & 0.6989 & 0.6378 & 0.6954 \tabularnewline
171 & 2709 & 2759.3574 & 2393.6664 & 3368.3 & 0.4356 & 0.8157 & 0.5958 & 0.7127 \tabularnewline
172 & 2441 & 2745.1137 & 2384.3503 & 3342.4902 & 0.1592 & 0.5472 & 0.3519 & 0.7003 \tabularnewline
173 & 2182 & 2554.5949 & 2256.3002 & 3014.5755 & 0.0562 & 0.6858 & 0.5853 & 0.4485 \tabularnewline
174 & 2585 & 2815.5388 & 2430.0635 & 3472.0548 & 0.2456 & 0.9707 & 0.6259 & 0.7544 \tabularnewline
175 & 2881 & 2864.0929 & 2461.0751 & 3564.3618 & 0.4811 & 0.7826 & 0.3931 & 0.7826 \tabularnewline
176 & 2422 & 2518.8728 & 2231.5738 & 2956.3507 & 0.3321 & 0.0524 & 0.4712 & 0.3835 \tabularnewline
177 & 2690 & 2751.8049 & 2388.731 & 3354.5907 & 0.4204 & 0.8582 & 0.5822 & 0.7062 \tabularnewline
178 & 2659 & 2722.3295 & 2369.3745 & 3301.6046 & 0.4152 & 0.5436 & 0.5315 & 0.6789 \tabularnewline
179 & 2535 & 2560.0354 & 2260.0461 & 3023.5269 & 0.4578 & 0.3378 & 0.6499 & 0.458 \tabularnewline
180 & 2613 & 2659.379 & 2327.5232 & 3191.0963 & 0.4321 & 0.6767 & 0.608 & 0.608 \tabularnewline
\hline
\end{tabular}
%Source: https://freestatistics.org/blog/index.php?pk=105379&T=1

[TABLE]
[ROW][C]Univariate ARIMA Extrapolation Forecast[/C][/ROW]
[ROW][C]time[/C][C]Y[t][/C][C]F[t][/C][C]95% LB[/C][C]95% UB[/C][C]p-value(H0: Y[t] = F[t])[/C][C]P(F[t]>Y[t-1])[/C][C]P(F[t]>Y[t-s])[/C][C]P(F[t]>Y[168])[/C][/ROW]
[ROW][C]156[/C][C]2112[/C][C]-[/C][C]-[/C][C]-[/C][C]-[/C][C]-[/C][C]-[/C][C]-[/C][/ROW]
[ROW][C]157[/C][C]2903[/C][C]-[/C][C]-[/C][C]-[/C][C]-[/C][C]-[/C][C]-[/C][C]-[/C][/ROW]
[ROW][C]158[/C][C]2633[/C][C]-[/C][C]-[/C][C]-[/C][C]-[/C][C]-[/C][C]-[/C][C]-[/C][/ROW]
[ROW][C]159[/C][C]2684[/C][C]-[/C][C]-[/C][C]-[/C][C]-[/C][C]-[/C][C]-[/C][C]-[/C][/ROW]
[ROW][C]160[/C][C]2861[/C][C]-[/C][C]-[/C][C]-[/C][C]-[/C][C]-[/C][C]-[/C][C]-[/C][/ROW]
[ROW][C]161[/C][C]2504[/C][C]-[/C][C]-[/C][C]-[/C][C]-[/C][C]-[/C][C]-[/C][C]-[/C][/ROW]
[ROW][C]162[/C][C]2708[/C][C]-[/C][C]-[/C][C]-[/C][C]-[/C][C]-[/C][C]-[/C][C]-[/C][/ROW]
[ROW][C]163[/C][C]2961[/C][C]-[/C][C]-[/C][C]-[/C][C]-[/C][C]-[/C][C]-[/C][C]-[/C][/ROW]
[ROW][C]164[/C][C]2535[/C][C]-[/C][C]-[/C][C]-[/C][C]-[/C][C]-[/C][C]-[/C][C]-[/C][/ROW]
[ROW][C]165[/C][C]2688[/C][C]-[/C][C]-[/C][C]-[/C][C]-[/C][C]-[/C][C]-[/C][C]-[/C][/ROW]
[ROW][C]166[/C][C]2699[/C][C]-[/C][C]-[/C][C]-[/C][C]-[/C][C]-[/C][C]-[/C][C]-[/C][/ROW]
[ROW][C]167[/C][C]2469[/C][C]-[/C][C]-[/C][C]-[/C][C]-[/C][C]-[/C][C]-[/C][C]-[/C][/ROW]
[ROW][C]168[/C][C]2585[/C][C]-[/C][C]-[/C][C]-[/C][C]-[/C][C]-[/C][C]-[/C][C]-[/C][/ROW]
[ROW][C]169[/C][C]2582[/C][C]2933.0587[/C][C]2506.2221[/C][C]3694.2142[/C][C]0.183[/C][C]0.8149[/C][C]0.5308[/C][C]0.8149[/C][/ROW]
[ROW][C]170[/C][C]2480[/C][C]2739.6567[/C][C]2380.7882[/C][C]3332.6084[/C][C]0.1954[/C][C]0.6989[/C][C]0.6378[/C][C]0.6954[/C][/ROW]
[ROW][C]171[/C][C]2709[/C][C]2759.3574[/C][C]2393.6664[/C][C]3368.3[/C][C]0.4356[/C][C]0.8157[/C][C]0.5958[/C][C]0.7127[/C][/ROW]
[ROW][C]172[/C][C]2441[/C][C]2745.1137[/C][C]2384.3503[/C][C]3342.4902[/C][C]0.1592[/C][C]0.5472[/C][C]0.3519[/C][C]0.7003[/C][/ROW]
[ROW][C]173[/C][C]2182[/C][C]2554.5949[/C][C]2256.3002[/C][C]3014.5755[/C][C]0.0562[/C][C]0.6858[/C][C]0.5853[/C][C]0.4485[/C][/ROW]
[ROW][C]174[/C][C]2585[/C][C]2815.5388[/C][C]2430.0635[/C][C]3472.0548[/C][C]0.2456[/C][C]0.9707[/C][C]0.6259[/C][C]0.7544[/C][/ROW]
[ROW][C]175[/C][C]2881[/C][C]2864.0929[/C][C]2461.0751[/C][C]3564.3618[/C][C]0.4811[/C][C]0.7826[/C][C]0.3931[/C][C]0.7826[/C][/ROW]
[ROW][C]176[/C][C]2422[/C][C]2518.8728[/C][C]2231.5738[/C][C]2956.3507[/C][C]0.3321[/C][C]0.0524[/C][C]0.4712[/C][C]0.3835[/C][/ROW]
[ROW][C]177[/C][C]2690[/C][C]2751.8049[/C][C]2388.731[/C][C]3354.5907[/C][C]0.4204[/C][C]0.8582[/C][C]0.5822[/C][C]0.7062[/C][/ROW]
[ROW][C]178[/C][C]2659[/C][C]2722.3295[/C][C]2369.3745[/C][C]3301.6046[/C][C]0.4152[/C][C]0.5436[/C][C]0.5315[/C][C]0.6789[/C][/ROW]
[ROW][C]179[/C][C]2535[/C][C]2560.0354[/C][C]2260.0461[/C][C]3023.5269[/C][C]0.4578[/C][C]0.3378[/C][C]0.6499[/C][C]0.458[/C][/ROW]
[ROW][C]180[/C][C]2613[/C][C]2659.379[/C][C]2327.5232[/C][C]3191.0963[/C][C]0.4321[/C][C]0.6767[/C][C]0.608[/C][C]0.608[/C][/ROW]
[/TABLE]
Source: https://freestatistics.org/blog/index.php?pk=105379&T=1

Globally Unique Identifier (entire table): ba.freestatistics.org/blog/index.php?pk=105379&T=1

As an alternative you can also use a QR Code:  

The GUIDs for individual cells are displayed in the table below:

Univariate ARIMA Extrapolation Forecast
timeY[t]F[t]95% LB95% UBp-value(H0: Y[t] = F[t])P(F[t]>Y[t-1])P(F[t]>Y[t-s])P(F[t]>Y[168])
1562112-------
1572903-------
1582633-------
1592684-------
1602861-------
1612504-------
1622708-------
1632961-------
1642535-------
1652688-------
1662699-------
1672469-------
1682585-------
16925822933.05872506.22213694.21420.1830.81490.53080.8149
17024802739.65672380.78823332.60840.19540.69890.63780.6954
17127092759.35742393.66643368.30.43560.81570.59580.7127
17224412745.11372384.35033342.49020.15920.54720.35190.7003
17321822554.59492256.30023014.57550.05620.68580.58530.4485
17425852815.53882430.06353472.05480.24560.97070.62590.7544
17528812864.09292461.07513564.36180.48110.78260.39310.7826
17624222518.87282231.57382956.35070.33210.05240.47120.3835
17726902751.80492388.7313354.59070.42040.85820.58220.7062
17826592722.32952369.37453301.60460.41520.54360.53150.6789
17925352560.03542260.04613023.52690.45780.33780.64990.458
18026132659.3792327.52323191.09630.43210.67670.6080.608


Univariate ARIMA Extrapolation Forecast Performance
time% S.E.PEMAPESq.EMSERMSE
1690.1324-0.11970123242.239900
1700.1104-0.09480.107267421.577595331.9087308.7587
1710.1126-0.01820.07762535.872564399.8966253.7713
1720.111-0.11080.085992485.116371421.2016267.2475
1730.0919-0.14590.0979138826.959184902.3531291.3801
1740.119-0.08190.095253148.136879609.9837282.1524
1750.12470.00590.0824285.848668277.9644261.3005
1760.0886-0.03850.07699384.332760916.2604246.8122
1770.1118-0.02250.07093819.844854572.2143233.607
1780.1086-0.02330.06614010.620249516.0548222.522
1790.0924-0.00980.061626.76945071.5743212.3007
1800.102-0.01740.05742151.007841494.8604203.7029

\begin{tabular}{lllllllll}
\hline
Univariate ARIMA Extrapolation Forecast Performance \tabularnewline
time & % S.E. & PE & MAPE & Sq.E & MSE & RMSE \tabularnewline
169 & 0.1324 & -0.1197 & 0 & 123242.2399 & 0 & 0 \tabularnewline
170 & 0.1104 & -0.0948 & 0.1072 & 67421.5775 & 95331.9087 & 308.7587 \tabularnewline
171 & 0.1126 & -0.0182 & 0.0776 & 2535.8725 & 64399.8966 & 253.7713 \tabularnewline
172 & 0.111 & -0.1108 & 0.0859 & 92485.1163 & 71421.2016 & 267.2475 \tabularnewline
173 & 0.0919 & -0.1459 & 0.0979 & 138826.9591 & 84902.3531 & 291.3801 \tabularnewline
174 & 0.119 & -0.0819 & 0.0952 & 53148.1368 & 79609.9837 & 282.1524 \tabularnewline
175 & 0.1247 & 0.0059 & 0.0824 & 285.8486 & 68277.9644 & 261.3005 \tabularnewline
176 & 0.0886 & -0.0385 & 0.0769 & 9384.3327 & 60916.2604 & 246.8122 \tabularnewline
177 & 0.1118 & -0.0225 & 0.0709 & 3819.8448 & 54572.2143 & 233.607 \tabularnewline
178 & 0.1086 & -0.0233 & 0.0661 & 4010.6202 & 49516.0548 & 222.522 \tabularnewline
179 & 0.0924 & -0.0098 & 0.061 & 626.769 & 45071.5743 & 212.3007 \tabularnewline
180 & 0.102 & -0.0174 & 0.0574 & 2151.0078 & 41494.8604 & 203.7029 \tabularnewline
\hline
\end{tabular}
%Source: https://freestatistics.org/blog/index.php?pk=105379&T=2

[TABLE]
[ROW][C]Univariate ARIMA Extrapolation Forecast Performance[/C][/ROW]
[ROW][C]time[/C][C]% S.E.[/C][C]PE[/C][C]MAPE[/C][C]Sq.E[/C][C]MSE[/C][C]RMSE[/C][/ROW]
[ROW][C]169[/C][C]0.1324[/C][C]-0.1197[/C][C]0[/C][C]123242.2399[/C][C]0[/C][C]0[/C][/ROW]
[ROW][C]170[/C][C]0.1104[/C][C]-0.0948[/C][C]0.1072[/C][C]67421.5775[/C][C]95331.9087[/C][C]308.7587[/C][/ROW]
[ROW][C]171[/C][C]0.1126[/C][C]-0.0182[/C][C]0.0776[/C][C]2535.8725[/C][C]64399.8966[/C][C]253.7713[/C][/ROW]
[ROW][C]172[/C][C]0.111[/C][C]-0.1108[/C][C]0.0859[/C][C]92485.1163[/C][C]71421.2016[/C][C]267.2475[/C][/ROW]
[ROW][C]173[/C][C]0.0919[/C][C]-0.1459[/C][C]0.0979[/C][C]138826.9591[/C][C]84902.3531[/C][C]291.3801[/C][/ROW]
[ROW][C]174[/C][C]0.119[/C][C]-0.0819[/C][C]0.0952[/C][C]53148.1368[/C][C]79609.9837[/C][C]282.1524[/C][/ROW]
[ROW][C]175[/C][C]0.1247[/C][C]0.0059[/C][C]0.0824[/C][C]285.8486[/C][C]68277.9644[/C][C]261.3005[/C][/ROW]
[ROW][C]176[/C][C]0.0886[/C][C]-0.0385[/C][C]0.0769[/C][C]9384.3327[/C][C]60916.2604[/C][C]246.8122[/C][/ROW]
[ROW][C]177[/C][C]0.1118[/C][C]-0.0225[/C][C]0.0709[/C][C]3819.8448[/C][C]54572.2143[/C][C]233.607[/C][/ROW]
[ROW][C]178[/C][C]0.1086[/C][C]-0.0233[/C][C]0.0661[/C][C]4010.6202[/C][C]49516.0548[/C][C]222.522[/C][/ROW]
[ROW][C]179[/C][C]0.0924[/C][C]-0.0098[/C][C]0.061[/C][C]626.769[/C][C]45071.5743[/C][C]212.3007[/C][/ROW]
[ROW][C]180[/C][C]0.102[/C][C]-0.0174[/C][C]0.0574[/C][C]2151.0078[/C][C]41494.8604[/C][C]203.7029[/C][/ROW]
[/TABLE]
Source: https://freestatistics.org/blog/index.php?pk=105379&T=2

Globally Unique Identifier (entire table): ba.freestatistics.org/blog/index.php?pk=105379&T=2

As an alternative you can also use a QR Code:  

The GUIDs for individual cells are displayed in the table below:

Univariate ARIMA Extrapolation Forecast Performance
time% S.E.PEMAPESq.EMSERMSE
1690.1324-0.11970123242.239900
1700.1104-0.09480.107267421.577595331.9087308.7587
1710.1126-0.01820.07762535.872564399.8966253.7713
1720.111-0.11080.085992485.116371421.2016267.2475
1730.0919-0.14590.0979138826.959184902.3531291.3801
1740.119-0.08190.095253148.136879609.9837282.1524
1750.12470.00590.0824285.848668277.9644261.3005
1760.0886-0.03850.07699384.332760916.2604246.8122
1770.1118-0.02250.07093819.844854572.2143233.607
1780.1086-0.02330.06614010.620249516.0548222.522
1790.0924-0.00980.061626.76945071.5743212.3007
1800.102-0.01740.05742151.007841494.8604203.7029


Parameters (Session):
par1 = FALSE ; par2 = -2.0 ; par3 = 1 ; par4 = 1 ; par5 = 12 ; par6 = 3 ; par7 = 1 ; par8 = 2 ; par9 = 1 ;
Parameters (R input):
par1 = 12 ; par2 = -2.0 ; par3 = 0 ; par4 = 1 ; par5 = 12 ; par6 = 1 ; par7 = 0 ; par8 = 2 ; par9 = 1 ; par10 = FALSE ;
R code (references can be found in the software module):
par1 <- as.numeric(par1) #cut off periods
par2 <- as.numeric(par2) #lambda
par3 <- as.numeric(par3) #degree of non-seasonal differencing
par4 <- as.numeric(par4) #degree of seasonal differencing
par5 <- as.numeric(par5) #seasonal period
par6 <- as.numeric(par6) #p
par7 <- as.numeric(par7) #q
par8 <- as.numeric(par8) #P
par9 <- as.numeric(par9) #Q
if (par10 == 'TRUE') par10 <- TRUE
if (par10 == 'FALSE') par10 <- FALSE
if (par2 == 0) x <- log(x)
if (par2 != 0) x <- x^par2
lx <- length(x)
first <- lx - 2*par1
nx <- lx - par1
nx1 <- nx + 1
fx <- lx - nx
if (fx < 1) {
fx <- par5
nx1 <- lx + fx - 1
first <- lx - 2*fx
}
first <- 1
if (fx < 3) fx <- round(lx/10,0)
(arima.out <- arima(x[1:nx], order=c(par6,par3,par7), seasonal=list(order=c(par8,par4,par9), period=par5), include.mean=par10, method='ML'))
(forecast <- predict(arima.out,par1))
(lb <- forecast$pred - 1.96 * forecast$se)
(ub <- forecast$pred + 1.96 * forecast$se)
if (par2 == 0) {
x <- exp(x)
forecast$pred <- exp(forecast$pred)
lb <- exp(lb)
ub <- exp(ub)
}
if (par2 != 0) {
x <- x^(1/par2)
forecast$pred <- forecast$pred^(1/par2)
lb <- lb^(1/par2)
ub <- ub^(1/par2)
}
if (par2 < 0) {
olb <- lb
lb <- ub
ub <- olb
}
(actandfor <- c(x[1:nx], forecast$pred))
(perc.se <- (ub-forecast$pred)/1.96/forecast$pred)
bitmap(file='test1.png')
opar <- par(mar=c(4,4,2,2),las=1)
ylim <- c( min(x[first:nx],lb), max(x[first:nx],ub))
plot(x,ylim=ylim,type='n',xlim=c(first,lx))
usr <- par('usr')
rect(usr[1],usr[3],nx+1,usr[4],border=NA,col='lemonchiffon')
rect(nx1,usr[3],usr[2],usr[4],border=NA,col='lavender')
abline(h= (-3:3)*2 , col ='gray', lty =3)
polygon( c(nx1:lx,lx:nx1), c(lb,rev(ub)), col = 'orange', lty=2,border=NA)
lines(nx1:lx, lb , lty=2)
lines(nx1:lx, ub , lty=2)
lines(x, lwd=2)
lines(nx1:lx, forecast$pred , lwd=2 , col ='white')
box()
par(opar)
dev.off()
prob.dec <- array(NA, dim=fx)
prob.sdec <- array(NA, dim=fx)
prob.ldec <- array(NA, dim=fx)
prob.pval <- array(NA, dim=fx)
perf.pe <- array(0, dim=fx)
perf.mape <- array(0, dim=fx)
perf.mape1 <- array(0, dim=fx)
perf.se <- array(0, dim=fx)
perf.mse <- array(0, dim=fx)
perf.mse1 <- array(0, dim=fx)
perf.rmse <- array(0, dim=fx)
for (i in 1:fx) {
locSD <- (ub[i] - forecast$pred[i]) / 1.96
perf.pe[i] = (x[nx+i] - forecast$pred[i]) / forecast$pred[i]
perf.se[i] = (x[nx+i] - forecast$pred[i])^2
prob.dec[i] = pnorm((x[nx+i-1] - forecast$pred[i]) / locSD)
prob.sdec[i] = pnorm((x[nx+i-par5] - forecast$pred[i]) / locSD)
prob.ldec[i] = pnorm((x[nx] - forecast$pred[i]) / locSD)
prob.pval[i] = pnorm(abs(x[nx+i] - forecast$pred[i]) / locSD)
}
perf.mape[1] = abs(perf.pe[1])
perf.mse[1] = abs(perf.se[1])
for (i in 2:fx) {
perf.mape[i] = perf.mape[i-1] + abs(perf.pe[i])
perf.mape1[i] = perf.mape[i] / i
perf.mse[i] = perf.mse[i-1] + perf.se[i]
perf.mse1[i] = perf.mse[i] / i
}
perf.rmse = sqrt(perf.mse1)
bitmap(file='test2.png')
plot(forecast$pred, pch=19, type='b',main='ARIMA Extrapolation Forecast', ylab='Forecast and 95% CI', xlab='time',ylim=c(min(lb),max(ub)))
dum <- forecast$pred
dum[1:par1] <- x[(nx+1):lx]
lines(dum, lty=1)
lines(ub,lty=3)
lines(lb,lty=3)
dev.off()
load(file='createtable')
a<-table.start()
a<-table.row.start(a)
a<-table.element(a,'Univariate ARIMA Extrapolation Forecast',9,TRUE)
a<-table.row.end(a)
a<-table.row.start(a)
a<-table.element(a,'time',1,header=TRUE)
a<-table.element(a,'Y[t]',1,header=TRUE)
a<-table.element(a,'F[t]',1,header=TRUE)
a<-table.element(a,'95% LB',1,header=TRUE)
a<-table.element(a,'95% UB',1,header=TRUE)
a<-table.element(a,'p-value
(H0: Y[t] = F[t])',1,header=TRUE)
a<-table.element(a,'P(F[t]>Y[t-1])',1,header=TRUE)
a<-table.element(a,'P(F[t]>Y[t-s])',1,header=TRUE)
mylab <- paste('P(F[t]>Y[',nx,sep='')
mylab <- paste(mylab,'])',sep='')
a<-table.element(a,mylab,1,header=TRUE)
a<-table.row.end(a)
for (i in (nx-par5):nx) {
a<-table.row.start(a)
a<-table.element(a,i,header=TRUE)
a<-table.element(a,x[i])
a<-table.element(a,'-')
a<-table.row.end(a)
}
for (i in 1:fx) {
a<-table.row.start(a)
a<-table.element(a,nx+i,header=TRUE)
a<-table.element(a,round(x[nx+i],4))
a<-table.element(a,round(forecast$pred[i],4))
a<-table.element(a,round(lb[i],4))
a<-table.element(a,round(ub[i],4))
a<-table.element(a,round((1-prob.pval[i]),4))
a<-table.element(a,round((1-prob.dec[i]),4))
a<-table.element(a,round((1-prob.sdec[i]),4))
a<-table.element(a,round((1-prob.ldec[i]),4))
a<-table.row.end(a)
}
a<-table.end(a)
table.save(a,file='mytable.tab')
a<-table.start()
a<-table.row.start(a)
a<-table.element(a,'Univariate ARIMA Extrapolation Forecast Performance',7,TRUE)
a<-table.row.end(a)
a<-table.row.start(a)
a<-table.element(a,'time',1,header=TRUE)
a<-table.element(a,'% S.E.',1,header=TRUE)
a<-table.element(a,'PE',1,header=TRUE)
a<-table.element(a,'MAPE',1,header=TRUE)
a<-table.element(a,'Sq.E',1,header=TRUE)
a<-table.element(a,'MSE',1,header=TRUE)
a<-table.element(a,'RMSE',1,header=TRUE)
a<-table.row.end(a)
for (i in 1:fx) {
a<-table.row.start(a)
a<-table.element(a,nx+i,header=TRUE)
a<-table.element(a,round(perc.se[i],4))
a<-table.element(a,round(perf.pe[i],4))
a<-table.element(a,round(perf.mape1[i],4))
a<-table.element(a,round(perf.se[i],4))
a<-table.element(a,round(perf.mse1[i],4))
a<-table.element(a,round(perf.rmse[i],4))
a<-table.row.end(a)
}
a<-table.end(a)
table.save(a,file='mytable1.tab')