Free Statistics

of Irreproducible Research!

Author's title

Author*The author of this computation has been verified*
R Software Modulerwasp_smp.wasp
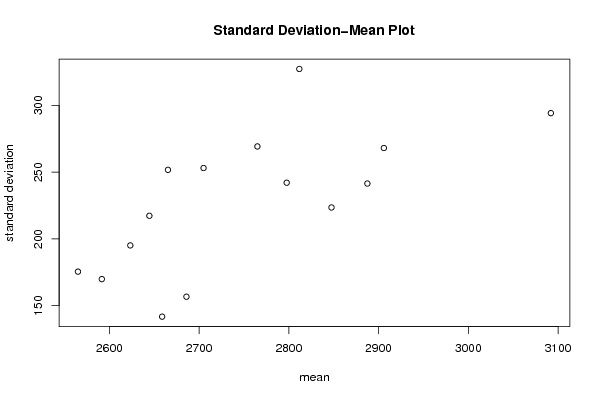
Title produced by softwareStandard Deviation-Mean Plot
Date of computationSun, 05 Dec 2010 12:08:11 +0000
Cite this page as followsStatistical Computations at FreeStatistics.org, Office for Research Development and Education, URL https://freestatistics.org/blog/index.php?v=date/2010/Dec/05/t1291551001ycsar456roauevm.htm/, Retrieved Wed, 01 May 2024 15:55:39 +0000
Statistical Computations at FreeStatistics.org, Office for Research Development and Education, URL https://freestatistics.org/blog/index.php?pk=105350, Retrieved Wed, 01 May 2024 15:55:39 +0000
QR Codes:

Original text written by user:
IsPrivate?No (this computation is public)
User-defined keywords
Estimated Impact138
Family? (F = Feedback message, R = changed R code, M = changed R Module, P = changed Parameters, D = changed Data)
-     [Univariate Explorative Data Analysis] [Run Sequence gebo...] [2008-12-12 13:32:37] [76963dc1903f0f612b6153510a3818cf]
- R  D  [Univariate Explorative Data Analysis] [Run Sequence gebo...] [2008-12-17 12:14:40] [76963dc1903f0f612b6153510a3818cf]
-         [Univariate Explorative Data Analysis] [Run Sequence Plot...] [2008-12-22 18:19:51] [1ce0d16c8f4225c977b42c8fa93bc163]
- RMP       [Univariate Data Series] [Identifying Integ...] [2009-11-22 12:08:06] [b98453cac15ba1066b407e146608df68]
- RMP         [Standard Deviation-Mean Plot] [Births] [2010-11-29 10:52:49] [b98453cac15ba1066b407e146608df68]
-   PD            [Standard Deviation-Mean Plot] [workshop 9] [2010-12-05 12:08:11] [3f56c8f677e988de577e4e00a8180a48] [Current]
Feedback Forum

Post a new message
Dataseries X:
2938
2909
3141
2427
3059
2918
2901
2823
2798
2892
2967
2397
3458
3024
3100
2904
3056
2771
2897
2772
2857
3020
2648
2364
3194
3013
2560
3074
2746
2846
3184
2354
3080
2963
2430
2296
2416
2647
2789
2685
2666
2882
2953
2127
2563
3061
2809
2861
2781
2555
3206
2570
2410
3195
2736
2743
2934
2668
2907
2866
2983
2878
3225
2515
3193
2663
2908
2896
2853
3028
3053
2455
3401
2969
3243
2849
3296
3121
3194
3023
2984
3525
3116
2383
3294
2882
2820
2583
2803
2767
2945
2716
2644
2956
2598
2171
2994
2645
2724
2550
2707
2679
2878
2307
2496
2637
2436
2426
2607
2533
2888
2520
2229
2804
2661
2547
2509
2465
2629
2706
2666
2432
2836
2888
2566
2802
2611
2683
2675
2434
2693
2619
2903
2550
2900
2456
2912
2883
2464
2655
2447
2592
2698
2274
2901
2397
3004
2614
2882
2671
2761
2806
2414
2673
2748
2112
2903
2633
2684
2861
2504
2708
2961
2535
2688
2699
2469
2585
2582
2480
2709
2441
2182
2585
2881
2422
2690
2659
2535
2613


Summary of computational transaction
Raw Inputview raw input (R code)
Raw Outputview raw output of R engine
Computing time2 seconds
R Server'George Udny Yule' @ 72.249.76.132

\begin{tabular}{lllllllll}
\hline
Summary of computational transaction \tabularnewline
Raw Input & view raw input (R code)  \tabularnewline
Raw Output & view raw output of R engine  \tabularnewline
Computing time & 2 seconds \tabularnewline
R Server & 'George Udny Yule' @ 72.249.76.132 \tabularnewline
\hline
\end{tabular}
%Source: https://freestatistics.org/blog/index.php?pk=105350&T=0

[TABLE]
[ROW][C]Summary of computational transaction[/C][/ROW]
[ROW][C]Raw Input[/C][C]view raw input (R code) [/C][/ROW]
[ROW][C]Raw Output[/C][C]view raw output of R engine [/C][/ROW]
[ROW][C]Computing time[/C][C]2 seconds[/C][/ROW]
[ROW][C]R Server[/C][C]'George Udny Yule' @ 72.249.76.132[/C][/ROW]
[/TABLE]
Source: https://freestatistics.org/blog/index.php?pk=105350&T=0

Globally Unique Identifier (entire table): ba.freestatistics.org/blog/index.php?pk=105350&T=0

As an alternative you can also use a QR Code:  

The GUIDs for individual cells are displayed in the table below:

Summary of computational transaction
Raw Inputview raw input (R code)
Raw Outputview raw output of R engine
Computing time2 seconds
R Server'George Udny Yule' @ 72.249.76.132


Standard Deviation-Mean Plot
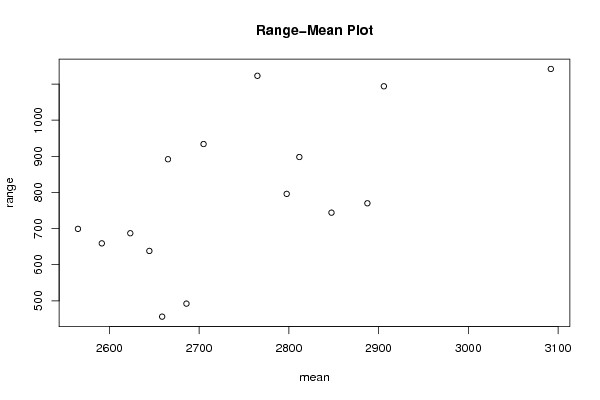
SectionMeanStandard DeviationRange
12847.5223.558208812096744
22905.91666666667268.1171583581711094
32811.66666666667327.377550552967898
42704.91666666667253.131463628661934
52797.58333333333242.094443754849796
62887.5241.486495011061770
73092294.2620971484131142
82764.91666666667269.3046461245001123
92623.25195.129385979476687
102591.5169.862243651089659
112658.75141.730297652715456
122644.5217.336981750377638
132665.25251.726086703927892
142685.83333333333156.676756606097492
152564.91666666667175.469478482122699

\begin{tabular}{lllllllll}
\hline
Standard Deviation-Mean Plot \tabularnewline
Section & Mean & Standard Deviation & Range \tabularnewline
1 & 2847.5 & 223.558208812096 & 744 \tabularnewline
2 & 2905.91666666667 & 268.117158358171 & 1094 \tabularnewline
3 & 2811.66666666667 & 327.377550552967 & 898 \tabularnewline
4 & 2704.91666666667 & 253.131463628661 & 934 \tabularnewline
5 & 2797.58333333333 & 242.094443754849 & 796 \tabularnewline
6 & 2887.5 & 241.486495011061 & 770 \tabularnewline
7 & 3092 & 294.262097148413 & 1142 \tabularnewline
8 & 2764.91666666667 & 269.304646124500 & 1123 \tabularnewline
9 & 2623.25 & 195.129385979476 & 687 \tabularnewline
10 & 2591.5 & 169.862243651089 & 659 \tabularnewline
11 & 2658.75 & 141.730297652715 & 456 \tabularnewline
12 & 2644.5 & 217.336981750377 & 638 \tabularnewline
13 & 2665.25 & 251.726086703927 & 892 \tabularnewline
14 & 2685.83333333333 & 156.676756606097 & 492 \tabularnewline
15 & 2564.91666666667 & 175.469478482122 & 699 \tabularnewline
\hline
\end{tabular}
%Source: https://freestatistics.org/blog/index.php?pk=105350&T=1

[TABLE]
[ROW][C]Standard Deviation-Mean Plot[/C][/ROW]
[ROW][C]Section[/C][C]Mean[/C][C]Standard Deviation[/C][C]Range[/C][/ROW]
[ROW][C]1[/C][C]2847.5[/C][C]223.558208812096[/C][C]744[/C][/ROW]
[ROW][C]2[/C][C]2905.91666666667[/C][C]268.117158358171[/C][C]1094[/C][/ROW]
[ROW][C]3[/C][C]2811.66666666667[/C][C]327.377550552967[/C][C]898[/C][/ROW]
[ROW][C]4[/C][C]2704.91666666667[/C][C]253.131463628661[/C][C]934[/C][/ROW]
[ROW][C]5[/C][C]2797.58333333333[/C][C]242.094443754849[/C][C]796[/C][/ROW]
[ROW][C]6[/C][C]2887.5[/C][C]241.486495011061[/C][C]770[/C][/ROW]
[ROW][C]7[/C][C]3092[/C][C]294.262097148413[/C][C]1142[/C][/ROW]
[ROW][C]8[/C][C]2764.91666666667[/C][C]269.304646124500[/C][C]1123[/C][/ROW]
[ROW][C]9[/C][C]2623.25[/C][C]195.129385979476[/C][C]687[/C][/ROW]
[ROW][C]10[/C][C]2591.5[/C][C]169.862243651089[/C][C]659[/C][/ROW]
[ROW][C]11[/C][C]2658.75[/C][C]141.730297652715[/C][C]456[/C][/ROW]
[ROW][C]12[/C][C]2644.5[/C][C]217.336981750377[/C][C]638[/C][/ROW]
[ROW][C]13[/C][C]2665.25[/C][C]251.726086703927[/C][C]892[/C][/ROW]
[ROW][C]14[/C][C]2685.83333333333[/C][C]156.676756606097[/C][C]492[/C][/ROW]
[ROW][C]15[/C][C]2564.91666666667[/C][C]175.469478482122[/C][C]699[/C][/ROW]
[/TABLE]
Source: https://freestatistics.org/blog/index.php?pk=105350&T=1

Globally Unique Identifier (entire table): ba.freestatistics.org/blog/index.php?pk=105350&T=1

As an alternative you can also use a QR Code:  

The GUIDs for individual cells are displayed in the table below:

Standard Deviation-Mean Plot
SectionMeanStandard DeviationRange
12847.5223.558208812096744
22905.91666666667268.1171583581711094
32811.66666666667327.377550552967898
42704.91666666667253.131463628661934
52797.58333333333242.094443754849796
62887.5241.486495011061770
73092294.2620971484131142
82764.91666666667269.3046461245001123
92623.25195.129385979476687
102591.5169.862243651089659
112658.75141.730297652715456
122644.5217.336981750377638
132665.25251.726086703927892
142685.83333333333156.676756606097492
152564.91666666667175.469478482122699


Regression: S.E.(k) = alpha + beta * Mean(k)
alpha-461.237215548352
beta0.250832117719095
S.D.0.0756687273327918
T-STAT3.3148716327147
p-value0.00558560766372271

\begin{tabular}{lllllllll}
\hline
Regression: S.E.(k) = alpha + beta * Mean(k) \tabularnewline
alpha & -461.237215548352 \tabularnewline
beta & 0.250832117719095 \tabularnewline
S.D. & 0.0756687273327918 \tabularnewline
T-STAT & 3.3148716327147 \tabularnewline
p-value & 0.00558560766372271 \tabularnewline
\hline
\end{tabular}
%Source: https://freestatistics.org/blog/index.php?pk=105350&T=2

[TABLE]
[ROW][C]Regression: S.E.(k) = alpha + beta * Mean(k)[/C][/ROW]
[ROW][C]alpha[/C][C]-461.237215548352[/C][/ROW]
[ROW][C]beta[/C][C]0.250832117719095[/C][/ROW]
[ROW][C]S.D.[/C][C]0.0756687273327918[/C][/ROW]
[ROW][C]T-STAT[/C][C]3.3148716327147[/C][/ROW]
[ROW][C]p-value[/C][C]0.00558560766372271[/C][/ROW]
[/TABLE]
Source: https://freestatistics.org/blog/index.php?pk=105350&T=2

Globally Unique Identifier (entire table): ba.freestatistics.org/blog/index.php?pk=105350&T=2

As an alternative you can also use a QR Code:  

The GUIDs for individual cells are displayed in the table below:

Regression: S.E.(k) = alpha + beta * Mean(k)
alpha-461.237215548352
beta0.250832117719095
S.D.0.0756687273327918
T-STAT3.3148716327147
p-value0.00558560766372271


Regression: ln S.E.(k) = alpha + beta * ln Mean(k)
alpha-19.8123725098232
beta3.18481464552895
S.D.0.977211738708195
T-STAT3.25908349170984
p-value0.00621856041871413
Lambda-2.18481464552895

\begin{tabular}{lllllllll}
\hline
Regression: ln S.E.(k) = alpha + beta * ln Mean(k) \tabularnewline
alpha & -19.8123725098232 \tabularnewline
beta & 3.18481464552895 \tabularnewline
S.D. & 0.977211738708195 \tabularnewline
T-STAT & 3.25908349170984 \tabularnewline
p-value & 0.00621856041871413 \tabularnewline
Lambda & -2.18481464552895 \tabularnewline
\hline
\end{tabular}
%Source: https://freestatistics.org/blog/index.php?pk=105350&T=3

[TABLE]
[ROW][C]Regression: ln S.E.(k) = alpha + beta * ln Mean(k)[/C][/ROW]
[ROW][C]alpha[/C][C]-19.8123725098232[/C][/ROW]
[ROW][C]beta[/C][C]3.18481464552895[/C][/ROW]
[ROW][C]S.D.[/C][C]0.977211738708195[/C][/ROW]
[ROW][C]T-STAT[/C][C]3.25908349170984[/C][/ROW]
[ROW][C]p-value[/C][C]0.00621856041871413[/C][/ROW]
[ROW][C]Lambda[/C][C]-2.18481464552895[/C][/ROW]
[/TABLE]
Source: https://freestatistics.org/blog/index.php?pk=105350&T=3

Globally Unique Identifier (entire table): ba.freestatistics.org/blog/index.php?pk=105350&T=3

As an alternative you can also use a QR Code:  

The GUIDs for individual cells are displayed in the table below:

Regression: ln S.E.(k) = alpha + beta * ln Mean(k)
alpha-19.8123725098232
beta3.18481464552895
S.D.0.977211738708195
T-STAT3.25908349170984
p-value0.00621856041871413
Lambda-2.18481464552895


Parameters (Session):
par1 = 12 ;
Parameters (R input):
par1 = 12 ;
R code (references can be found in the software module):
par1 <- as.numeric(par1)
(n <- length(x))
(np <- floor(n / par1))
arr <- array(NA,dim=c(par1,np))
j <- 0
k <- 1
for (i in 1:(np*par1))
{
j = j + 1
arr[j,k] <- x[i]
if (j == par1) {
j = 0
k=k+1
}
}
arr
arr.mean <- array(NA,dim=np)
arr.sd <- array(NA,dim=np)
arr.range <- array(NA,dim=np)
for (j in 1:np)
{
arr.mean[j] <- mean(arr[,j],na.rm=TRUE)
arr.sd[j] <- sd(arr[,j],na.rm=TRUE)
arr.range[j] <- max(arr[,j],na.rm=TRUE) - min(arr[,j],na.rm=TRUE)
}
arr.mean
arr.sd
arr.range
(lm1 <- lm(arr.sd~arr.mean))
(lnlm1 <- lm(log(arr.sd)~log(arr.mean)))
(lm2 <- lm(arr.range~arr.mean))
bitmap(file='test1.png')
plot(arr.mean,arr.sd,main='Standard Deviation-Mean Plot',xlab='mean',ylab='standard deviation')
dev.off()
bitmap(file='test2.png')
plot(arr.mean,arr.range,main='Range-Mean Plot',xlab='mean',ylab='range')
dev.off()
load(file='createtable')
a<-table.start()
a<-table.row.start(a)
a<-table.element(a,'Standard Deviation-Mean Plot',4,TRUE)
a<-table.row.end(a)
a<-table.row.start(a)
a<-table.element(a,'Section',header=TRUE)
a<-table.element(a,'Mean',header=TRUE)
a<-table.element(a,'Standard Deviation',header=TRUE)
a<-table.element(a,'Range',header=TRUE)
a<-table.row.end(a)
for (j in 1:np) {
a<-table.row.start(a)
a<-table.element(a,j,header=TRUE)
a<-table.element(a,arr.mean[j])
a<-table.element(a,arr.sd[j] )
a<-table.element(a,arr.range[j] )
a<-table.row.end(a)
}
a<-table.end(a)
table.save(a,file='mytable.tab')
a<-table.start()
a<-table.row.start(a)
a<-table.element(a,'Regression: S.E.(k) = alpha + beta * Mean(k)',2,TRUE)
a<-table.row.end(a)
a<-table.row.start(a)
a<-table.element(a,'alpha',header=TRUE)
a<-table.element(a,lm1$coefficients[[1]])
a<-table.row.end(a)
a<-table.row.start(a)
a<-table.element(a,'beta',header=TRUE)
a<-table.element(a,lm1$coefficients[[2]])
a<-table.row.end(a)
a<-table.row.start(a)
a<-table.element(a,'S.D.',header=TRUE)
a<-table.element(a,summary(lm1)$coefficients[2,2])
a<-table.row.end(a)
a<-table.row.start(a)
a<-table.element(a,'T-STAT',header=TRUE)
a<-table.element(a,summary(lm1)$coefficients[2,3])
a<-table.row.end(a)
a<-table.row.start(a)
a<-table.element(a,'p-value',header=TRUE)
a<-table.element(a,summary(lm1)$coefficients[2,4])
a<-table.row.end(a)
a<-table.end(a)
table.save(a,file='mytable1.tab')
a<-table.start()
a<-table.row.start(a)
a<-table.element(a,'Regression: ln S.E.(k) = alpha + beta * ln Mean(k)',2,TRUE)
a<-table.row.end(a)
a<-table.row.start(a)
a<-table.element(a,'alpha',header=TRUE)
a<-table.element(a,lnlm1$coefficients[[1]])
a<-table.row.end(a)
a<-table.row.start(a)
a<-table.element(a,'beta',header=TRUE)
a<-table.element(a,lnlm1$coefficients[[2]])
a<-table.row.end(a)
a<-table.row.start(a)
a<-table.element(a,'S.D.',header=TRUE)
a<-table.element(a,summary(lnlm1)$coefficients[2,2])
a<-table.row.end(a)
a<-table.row.start(a)
a<-table.element(a,'T-STAT',header=TRUE)
a<-table.element(a,summary(lnlm1)$coefficients[2,3])
a<-table.row.end(a)
a<-table.row.start(a)
a<-table.element(a,'p-value',header=TRUE)
a<-table.element(a,summary(lnlm1)$coefficients[2,4])
a<-table.row.end(a)
a<-table.row.start(a)
a<-table.element(a,'Lambda',header=TRUE)
a<-table.element(a,1-lnlm1$coefficients[[2]])
a<-table.row.end(a)
a<-table.end(a)
table.save(a,file='mytable2.tab')