Free Statistics

of Irreproducible Research!

Author's title

Author*The author of this computation has been verified*
R Software Modulerwasp_autocorrelation.wasp
Title produced by software(Partial) Autocorrelation Function
Date of computationSun, 05 Dec 2010 10:41:36 +0000
Cite this page as followsStatistical Computations at FreeStatistics.org, Office for Research Development and Education, URL https://freestatistics.org/blog/index.php?v=date/2010/Dec/05/t1291545631156xadafskn54jk.htm/, Retrieved Wed, 01 May 2024 13:35:48 +0000
Statistical Computations at FreeStatistics.org, Office for Research Development and Education, URL https://freestatistics.org/blog/index.php?pk=105329, Retrieved Wed, 01 May 2024 13:35:48 +0000
QR Codes:

Original text written by user:
IsPrivate?No (this computation is public)
User-defined keywords
Estimated Impact186
Family? (F = Feedback message, R = changed R code, M = changed R Module, P = changed Parameters, D = changed Data)
-     [Univariate Data Series] [data set] [2008-12-01 19:54:57] [b98453cac15ba1066b407e146608df68]
- RMP   [(Partial) Autocorrelation Function] [Unemployment] [2010-11-29 09:05:21] [b98453cac15ba1066b407e146608df68]
-   PD      [(Partial) Autocorrelation Function] [workshop 9] [2010-12-05 10:41:36] [3f56c8f677e988de577e4e00a8180a48] [Current]
Feedback Forum

Post a new message
Dataseries X:
2938
2909
3141
2427
3059
2918
2901
2823
2798
2892
2967
2397
3458
3024
3100
2904
3056
2771
2897
2772
2857
3020
2648
2364
3194
3013
2560
3074
2746
2846
3184
2354
3080
2963
2430
2296
2416
2647
2789
2685
2666
2882
2953
2127
2563
3061
2809
2861
2781
2555
3206
2570
2410
3195
2736
2743
2934
2668
2907
2866
2983
2878
3225
2515
3193
2663
2908
2896
2853
3028
3053
2455
3401
2969
3243
2849
3296
3121
3194
3023
2984
3525
3116
2383
3294
2882
2820
2583
2803
2767
2945
2716
2644
2956
2598
2171
2994
2645
2724
2550
2707
2679
2878
2307
2496
2637
2436
2426
2607
2533
2888
2520
2229
2804
2661
2547
2509
2465
2629
2706
2666
2432
2836
2888
2566
2802
2611
2683
2675
2434
2693
2619
2903
2550
2900
2456
2912
2883
2464
2655
2447
2592
2698
2274
2901
2397
3004
2614
2882
2671
2761
2806
2414
2673
2748
2112
2903
2633
2684
2861
2504
2708
2961
2535
2688
2699
2469
2585
2582
2480
2709
2441
2182
2585
2881
2422
2690
2659
2535
2613


Summary of computational transaction
Raw Inputview raw input (R code)
Raw Outputview raw output of R engine
Computing time2 seconds
R Server'Gwilym Jenkins' @ 72.249.127.135

\begin{tabular}{lllllllll}
\hline
Summary of computational transaction \tabularnewline
Raw Input & view raw input (R code)  \tabularnewline
Raw Output & view raw output of R engine  \tabularnewline
Computing time & 2 seconds \tabularnewline
R Server & 'Gwilym Jenkins' @ 72.249.127.135 \tabularnewline
\hline
\end{tabular}
%Source: https://freestatistics.org/blog/index.php?pk=105329&T=0

[TABLE]
[ROW][C]Summary of computational transaction[/C][/ROW]
[ROW][C]Raw Input[/C][C]view raw input (R code) [/C][/ROW]
[ROW][C]Raw Output[/C][C]view raw output of R engine [/C][/ROW]
[ROW][C]Computing time[/C][C]2 seconds[/C][/ROW]
[ROW][C]R Server[/C][C]'Gwilym Jenkins' @ 72.249.127.135[/C][/ROW]
[/TABLE]
Source: https://freestatistics.org/blog/index.php?pk=105329&T=0

Globally Unique Identifier (entire table): ba.freestatistics.org/blog/index.php?pk=105329&T=0

As an alternative you can also use a QR Code:  

The GUIDs for individual cells are displayed in the table below:

Summary of computational transaction
Raw Inputview raw input (R code)
Raw Outputview raw output of R engine
Computing time2 seconds
R Server'Gwilym Jenkins' @ 72.249.127.135


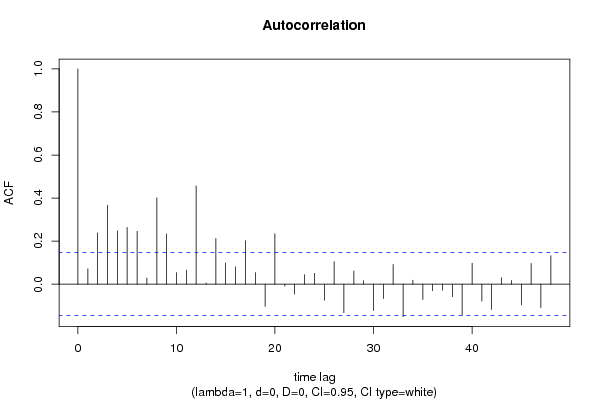
Autocorrelation Function
Time lag kACF(k)T-STATP-value
10.0712990.95660.170032
20.237893.19160.000835
30.367164.9261e-06
40.248073.32820.00053
50.2637683.53880.000256
60.2454143.29260.000598
70.0290190.38930.348746
80.401045.38050
90.233673.1350.001004
100.0542210.72740.233949
110.0652070.87480.191414
120.456766.12810
130.0052670.07070.47187
140.2123632.84910.002447
150.0994681.33450.091863
160.0809171.08560.13955
170.2022212.71310.003657
180.0541510.72650.234234
19-0.10326-1.38540.083825
200.234433.14520.000971
21-0.008878-0.11910.452662
22-0.045965-0.61670.269113
230.0439930.59020.277889
240.0506380.67940.248885
25-0.074279-0.99660.160158
260.1047131.40490.080892
27-0.132517-1.77790.038554
280.061440.82430.205427
290.0162420.21790.413875
30-0.122678-1.64590.050765
31-0.066783-0.8960.185728
320.0916171.22920.110306
33-0.150893-2.02440.022201
340.0184760.24790.402253
35-0.071173-0.95490.170457
36-0.030075-0.40350.343528
37-0.028164-0.37790.352989
38-0.058366-0.78310.21731
39-0.144522-1.9390.027034
400.0973481.30610.0966
41-0.078551-1.05390.146677
42-0.117993-1.5830.057583
430.0299030.40120.344378
440.0176020.23610.406793
45-0.096587-1.29590.098343
460.0961151.28950.099436
47-0.108751-1.4590.073148
480.1322871.77480.038809

\begin{tabular}{lllllllll}
\hline
Autocorrelation Function \tabularnewline
Time lag k & ACF(k) & T-STAT & P-value \tabularnewline
1 & 0.071299 & 0.9566 & 0.170032 \tabularnewline
2 & 0.23789 & 3.1916 & 0.000835 \tabularnewline
3 & 0.36716 & 4.926 & 1e-06 \tabularnewline
4 & 0.24807 & 3.3282 & 0.00053 \tabularnewline
5 & 0.263768 & 3.5388 & 0.000256 \tabularnewline
6 & 0.245414 & 3.2926 & 0.000598 \tabularnewline
7 & 0.029019 & 0.3893 & 0.348746 \tabularnewline
8 & 0.40104 & 5.3805 & 0 \tabularnewline
9 & 0.23367 & 3.135 & 0.001004 \tabularnewline
10 & 0.054221 & 0.7274 & 0.233949 \tabularnewline
11 & 0.065207 & 0.8748 & 0.191414 \tabularnewline
12 & 0.45676 & 6.1281 & 0 \tabularnewline
13 & 0.005267 & 0.0707 & 0.47187 \tabularnewline
14 & 0.212363 & 2.8491 & 0.002447 \tabularnewline
15 & 0.099468 & 1.3345 & 0.091863 \tabularnewline
16 & 0.080917 & 1.0856 & 0.13955 \tabularnewline
17 & 0.202221 & 2.7131 & 0.003657 \tabularnewline
18 & 0.054151 & 0.7265 & 0.234234 \tabularnewline
19 & -0.10326 & -1.3854 & 0.083825 \tabularnewline
20 & 0.23443 & 3.1452 & 0.000971 \tabularnewline
21 & -0.008878 & -0.1191 & 0.452662 \tabularnewline
22 & -0.045965 & -0.6167 & 0.269113 \tabularnewline
23 & 0.043993 & 0.5902 & 0.277889 \tabularnewline
24 & 0.050638 & 0.6794 & 0.248885 \tabularnewline
25 & -0.074279 & -0.9966 & 0.160158 \tabularnewline
26 & 0.104713 & 1.4049 & 0.080892 \tabularnewline
27 & -0.132517 & -1.7779 & 0.038554 \tabularnewline
28 & 0.06144 & 0.8243 & 0.205427 \tabularnewline
29 & 0.016242 & 0.2179 & 0.413875 \tabularnewline
30 & -0.122678 & -1.6459 & 0.050765 \tabularnewline
31 & -0.066783 & -0.896 & 0.185728 \tabularnewline
32 & 0.091617 & 1.2292 & 0.110306 \tabularnewline
33 & -0.150893 & -2.0244 & 0.022201 \tabularnewline
34 & 0.018476 & 0.2479 & 0.402253 \tabularnewline
35 & -0.071173 & -0.9549 & 0.170457 \tabularnewline
36 & -0.030075 & -0.4035 & 0.343528 \tabularnewline
37 & -0.028164 & -0.3779 & 0.352989 \tabularnewline
38 & -0.058366 & -0.7831 & 0.21731 \tabularnewline
39 & -0.144522 & -1.939 & 0.027034 \tabularnewline
40 & 0.097348 & 1.3061 & 0.0966 \tabularnewline
41 & -0.078551 & -1.0539 & 0.146677 \tabularnewline
42 & -0.117993 & -1.583 & 0.057583 \tabularnewline
43 & 0.029903 & 0.4012 & 0.344378 \tabularnewline
44 & 0.017602 & 0.2361 & 0.406793 \tabularnewline
45 & -0.096587 & -1.2959 & 0.098343 \tabularnewline
46 & 0.096115 & 1.2895 & 0.099436 \tabularnewline
47 & -0.108751 & -1.459 & 0.073148 \tabularnewline
48 & 0.132287 & 1.7748 & 0.038809 \tabularnewline
\hline
\end{tabular}
%Source: https://freestatistics.org/blog/index.php?pk=105329&T=1

[TABLE]
[ROW][C]Autocorrelation Function[/C][/ROW]
[ROW][C]Time lag k[/C][C]ACF(k)[/C][C]T-STAT[/C][C]P-value[/C][/ROW]
[ROW][C]1[/C][C]0.071299[/C][C]0.9566[/C][C]0.170032[/C][/ROW]
[ROW][C]2[/C][C]0.23789[/C][C]3.1916[/C][C]0.000835[/C][/ROW]
[ROW][C]3[/C][C]0.36716[/C][C]4.926[/C][C]1e-06[/C][/ROW]
[ROW][C]4[/C][C]0.24807[/C][C]3.3282[/C][C]0.00053[/C][/ROW]
[ROW][C]5[/C][C]0.263768[/C][C]3.5388[/C][C]0.000256[/C][/ROW]
[ROW][C]6[/C][C]0.245414[/C][C]3.2926[/C][C]0.000598[/C][/ROW]
[ROW][C]7[/C][C]0.029019[/C][C]0.3893[/C][C]0.348746[/C][/ROW]
[ROW][C]8[/C][C]0.40104[/C][C]5.3805[/C][C]0[/C][/ROW]
[ROW][C]9[/C][C]0.23367[/C][C]3.135[/C][C]0.001004[/C][/ROW]
[ROW][C]10[/C][C]0.054221[/C][C]0.7274[/C][C]0.233949[/C][/ROW]
[ROW][C]11[/C][C]0.065207[/C][C]0.8748[/C][C]0.191414[/C][/ROW]
[ROW][C]12[/C][C]0.45676[/C][C]6.1281[/C][C]0[/C][/ROW]
[ROW][C]13[/C][C]0.005267[/C][C]0.0707[/C][C]0.47187[/C][/ROW]
[ROW][C]14[/C][C]0.212363[/C][C]2.8491[/C][C]0.002447[/C][/ROW]
[ROW][C]15[/C][C]0.099468[/C][C]1.3345[/C][C]0.091863[/C][/ROW]
[ROW][C]16[/C][C]0.080917[/C][C]1.0856[/C][C]0.13955[/C][/ROW]
[ROW][C]17[/C][C]0.202221[/C][C]2.7131[/C][C]0.003657[/C][/ROW]
[ROW][C]18[/C][C]0.054151[/C][C]0.7265[/C][C]0.234234[/C][/ROW]
[ROW][C]19[/C][C]-0.10326[/C][C]-1.3854[/C][C]0.083825[/C][/ROW]
[ROW][C]20[/C][C]0.23443[/C][C]3.1452[/C][C]0.000971[/C][/ROW]
[ROW][C]21[/C][C]-0.008878[/C][C]-0.1191[/C][C]0.452662[/C][/ROW]
[ROW][C]22[/C][C]-0.045965[/C][C]-0.6167[/C][C]0.269113[/C][/ROW]
[ROW][C]23[/C][C]0.043993[/C][C]0.5902[/C][C]0.277889[/C][/ROW]
[ROW][C]24[/C][C]0.050638[/C][C]0.6794[/C][C]0.248885[/C][/ROW]
[ROW][C]25[/C][C]-0.074279[/C][C]-0.9966[/C][C]0.160158[/C][/ROW]
[ROW][C]26[/C][C]0.104713[/C][C]1.4049[/C][C]0.080892[/C][/ROW]
[ROW][C]27[/C][C]-0.132517[/C][C]-1.7779[/C][C]0.038554[/C][/ROW]
[ROW][C]28[/C][C]0.06144[/C][C]0.8243[/C][C]0.205427[/C][/ROW]
[ROW][C]29[/C][C]0.016242[/C][C]0.2179[/C][C]0.413875[/C][/ROW]
[ROW][C]30[/C][C]-0.122678[/C][C]-1.6459[/C][C]0.050765[/C][/ROW]
[ROW][C]31[/C][C]-0.066783[/C][C]-0.896[/C][C]0.185728[/C][/ROW]
[ROW][C]32[/C][C]0.091617[/C][C]1.2292[/C][C]0.110306[/C][/ROW]
[ROW][C]33[/C][C]-0.150893[/C][C]-2.0244[/C][C]0.022201[/C][/ROW]
[ROW][C]34[/C][C]0.018476[/C][C]0.2479[/C][C]0.402253[/C][/ROW]
[ROW][C]35[/C][C]-0.071173[/C][C]-0.9549[/C][C]0.170457[/C][/ROW]
[ROW][C]36[/C][C]-0.030075[/C][C]-0.4035[/C][C]0.343528[/C][/ROW]
[ROW][C]37[/C][C]-0.028164[/C][C]-0.3779[/C][C]0.352989[/C][/ROW]
[ROW][C]38[/C][C]-0.058366[/C][C]-0.7831[/C][C]0.21731[/C][/ROW]
[ROW][C]39[/C][C]-0.144522[/C][C]-1.939[/C][C]0.027034[/C][/ROW]
[ROW][C]40[/C][C]0.097348[/C][C]1.3061[/C][C]0.0966[/C][/ROW]
[ROW][C]41[/C][C]-0.078551[/C][C]-1.0539[/C][C]0.146677[/C][/ROW]
[ROW][C]42[/C][C]-0.117993[/C][C]-1.583[/C][C]0.057583[/C][/ROW]
[ROW][C]43[/C][C]0.029903[/C][C]0.4012[/C][C]0.344378[/C][/ROW]
[ROW][C]44[/C][C]0.017602[/C][C]0.2361[/C][C]0.406793[/C][/ROW]
[ROW][C]45[/C][C]-0.096587[/C][C]-1.2959[/C][C]0.098343[/C][/ROW]
[ROW][C]46[/C][C]0.096115[/C][C]1.2895[/C][C]0.099436[/C][/ROW]
[ROW][C]47[/C][C]-0.108751[/C][C]-1.459[/C][C]0.073148[/C][/ROW]
[ROW][C]48[/C][C]0.132287[/C][C]1.7748[/C][C]0.038809[/C][/ROW]
[/TABLE]
Source: https://freestatistics.org/blog/index.php?pk=105329&T=1

Globally Unique Identifier (entire table): ba.freestatistics.org/blog/index.php?pk=105329&T=1

As an alternative you can also use a QR Code:  

The GUIDs for individual cells are displayed in the table below:

Autocorrelation Function
Time lag kACF(k)T-STATP-value
10.0712990.95660.170032
20.237893.19160.000835
30.367164.9261e-06
40.248073.32820.00053
50.2637683.53880.000256
60.2454143.29260.000598
70.0290190.38930.348746
80.401045.38050
90.233673.1350.001004
100.0542210.72740.233949
110.0652070.87480.191414
120.456766.12810
130.0052670.07070.47187
140.2123632.84910.002447
150.0994681.33450.091863
160.0809171.08560.13955
170.2022212.71310.003657
180.0541510.72650.234234
19-0.10326-1.38540.083825
200.234433.14520.000971
21-0.008878-0.11910.452662
22-0.045965-0.61670.269113
230.0439930.59020.277889
240.0506380.67940.248885
25-0.074279-0.99660.160158
260.1047131.40490.080892
27-0.132517-1.77790.038554
280.061440.82430.205427
290.0162420.21790.413875
30-0.122678-1.64590.050765
31-0.066783-0.8960.185728
320.0916171.22920.110306
33-0.150893-2.02440.022201
340.0184760.24790.402253
35-0.071173-0.95490.170457
36-0.030075-0.40350.343528
37-0.028164-0.37790.352989
38-0.058366-0.78310.21731
39-0.144522-1.9390.027034
400.0973481.30610.0966
41-0.078551-1.05390.146677
42-0.117993-1.5830.057583
430.0299030.40120.344378
440.0176020.23610.406793
45-0.096587-1.29590.098343
460.0961151.28950.099436
47-0.108751-1.4590.073148
480.1322871.77480.038809


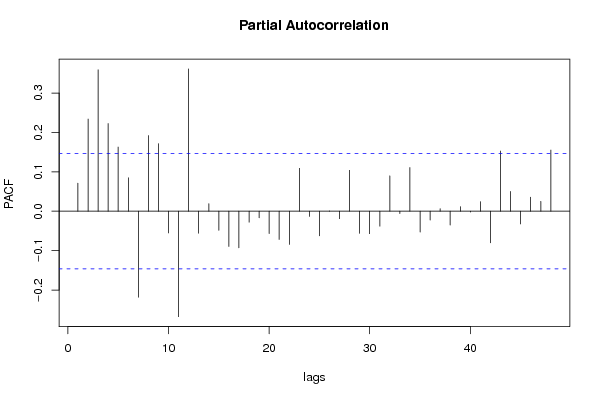
Partial Autocorrelation Function
Time lag kPACF(k)T-STATP-value
10.0712990.95660.170032
20.2339963.13940.00099
30.3588584.81462e-06
40.2224482.98450.001618
50.1628982.18550.015071
60.0847261.13670.128583
7-0.218152-2.92680.001933
80.1921652.57820.005366
90.1714072.29970.011307
10-0.05511-0.73940.23032
11-0.267665-3.59110.000212
120.361184.84571e-06
13-0.055632-0.74640.228205
140.0191430.25680.3988
15-0.048351-0.64870.258681
16-0.089388-1.19930.116
17-0.092995-1.24770.10689
18-0.027804-0.3730.354782
19-0.016685-0.22380.411565
20-0.056773-0.76170.22362
21-0.071789-0.96310.168383
22-0.084195-1.12960.130076
230.1090181.46260.072656
24-0.013357-0.17920.42899
25-0.062324-0.83620.202087
260.0006510.00870.496519
27-0.018886-0.25340.400133
280.103831.3930.082666
29-0.056063-0.75220.226467
30-0.0571-0.76610.222316
31-0.037988-0.50970.305454
320.0897471.20410.115068
33-0.006035-0.0810.467779
340.1109661.48880.06915
35-0.053033-0.71150.238843
36-0.022355-0.29990.382291
370.0064280.08620.465684
38-0.035203-0.47230.318643
390.0114970.15420.438795
40-0.002273-0.03050.487853
410.024240.32520.3727
42-0.080293-1.07720.141408
430.1527982.050.020907
440.0503390.67540.250154
45-0.032348-0.4340.332406
460.035650.47830.316509
470.0250070.33550.368817
480.1551752.08190.019383

\begin{tabular}{lllllllll}
\hline
Partial Autocorrelation Function \tabularnewline
Time lag k & PACF(k) & T-STAT & P-value \tabularnewline
1 & 0.071299 & 0.9566 & 0.170032 \tabularnewline
2 & 0.233996 & 3.1394 & 0.00099 \tabularnewline
3 & 0.358858 & 4.8146 & 2e-06 \tabularnewline
4 & 0.222448 & 2.9845 & 0.001618 \tabularnewline
5 & 0.162898 & 2.1855 & 0.015071 \tabularnewline
6 & 0.084726 & 1.1367 & 0.128583 \tabularnewline
7 & -0.218152 & -2.9268 & 0.001933 \tabularnewline
8 & 0.192165 & 2.5782 & 0.005366 \tabularnewline
9 & 0.171407 & 2.2997 & 0.011307 \tabularnewline
10 & -0.05511 & -0.7394 & 0.23032 \tabularnewline
11 & -0.267665 & -3.5911 & 0.000212 \tabularnewline
12 & 0.36118 & 4.8457 & 1e-06 \tabularnewline
13 & -0.055632 & -0.7464 & 0.228205 \tabularnewline
14 & 0.019143 & 0.2568 & 0.3988 \tabularnewline
15 & -0.048351 & -0.6487 & 0.258681 \tabularnewline
16 & -0.089388 & -1.1993 & 0.116 \tabularnewline
17 & -0.092995 & -1.2477 & 0.10689 \tabularnewline
18 & -0.027804 & -0.373 & 0.354782 \tabularnewline
19 & -0.016685 & -0.2238 & 0.411565 \tabularnewline
20 & -0.056773 & -0.7617 & 0.22362 \tabularnewline
21 & -0.071789 & -0.9631 & 0.168383 \tabularnewline
22 & -0.084195 & -1.1296 & 0.130076 \tabularnewline
23 & 0.109018 & 1.4626 & 0.072656 \tabularnewline
24 & -0.013357 & -0.1792 & 0.42899 \tabularnewline
25 & -0.062324 & -0.8362 & 0.202087 \tabularnewline
26 & 0.000651 & 0.0087 & 0.496519 \tabularnewline
27 & -0.018886 & -0.2534 & 0.400133 \tabularnewline
28 & 0.10383 & 1.393 & 0.082666 \tabularnewline
29 & -0.056063 & -0.7522 & 0.226467 \tabularnewline
30 & -0.0571 & -0.7661 & 0.222316 \tabularnewline
31 & -0.037988 & -0.5097 & 0.305454 \tabularnewline
32 & 0.089747 & 1.2041 & 0.115068 \tabularnewline
33 & -0.006035 & -0.081 & 0.467779 \tabularnewline
34 & 0.110966 & 1.4888 & 0.06915 \tabularnewline
35 & -0.053033 & -0.7115 & 0.238843 \tabularnewline
36 & -0.022355 & -0.2999 & 0.382291 \tabularnewline
37 & 0.006428 & 0.0862 & 0.465684 \tabularnewline
38 & -0.035203 & -0.4723 & 0.318643 \tabularnewline
39 & 0.011497 & 0.1542 & 0.438795 \tabularnewline
40 & -0.002273 & -0.0305 & 0.487853 \tabularnewline
41 & 0.02424 & 0.3252 & 0.3727 \tabularnewline
42 & -0.080293 & -1.0772 & 0.141408 \tabularnewline
43 & 0.152798 & 2.05 & 0.020907 \tabularnewline
44 & 0.050339 & 0.6754 & 0.250154 \tabularnewline
45 & -0.032348 & -0.434 & 0.332406 \tabularnewline
46 & 0.03565 & 0.4783 & 0.316509 \tabularnewline
47 & 0.025007 & 0.3355 & 0.368817 \tabularnewline
48 & 0.155175 & 2.0819 & 0.019383 \tabularnewline
\hline
\end{tabular}
%Source: https://freestatistics.org/blog/index.php?pk=105329&T=2

[TABLE]
[ROW][C]Partial Autocorrelation Function[/C][/ROW]
[ROW][C]Time lag k[/C][C]PACF(k)[/C][C]T-STAT[/C][C]P-value[/C][/ROW]
[ROW][C]1[/C][C]0.071299[/C][C]0.9566[/C][C]0.170032[/C][/ROW]
[ROW][C]2[/C][C]0.233996[/C][C]3.1394[/C][C]0.00099[/C][/ROW]
[ROW][C]3[/C][C]0.358858[/C][C]4.8146[/C][C]2e-06[/C][/ROW]
[ROW][C]4[/C][C]0.222448[/C][C]2.9845[/C][C]0.001618[/C][/ROW]
[ROW][C]5[/C][C]0.162898[/C][C]2.1855[/C][C]0.015071[/C][/ROW]
[ROW][C]6[/C][C]0.084726[/C][C]1.1367[/C][C]0.128583[/C][/ROW]
[ROW][C]7[/C][C]-0.218152[/C][C]-2.9268[/C][C]0.001933[/C][/ROW]
[ROW][C]8[/C][C]0.192165[/C][C]2.5782[/C][C]0.005366[/C][/ROW]
[ROW][C]9[/C][C]0.171407[/C][C]2.2997[/C][C]0.011307[/C][/ROW]
[ROW][C]10[/C][C]-0.05511[/C][C]-0.7394[/C][C]0.23032[/C][/ROW]
[ROW][C]11[/C][C]-0.267665[/C][C]-3.5911[/C][C]0.000212[/C][/ROW]
[ROW][C]12[/C][C]0.36118[/C][C]4.8457[/C][C]1e-06[/C][/ROW]
[ROW][C]13[/C][C]-0.055632[/C][C]-0.7464[/C][C]0.228205[/C][/ROW]
[ROW][C]14[/C][C]0.019143[/C][C]0.2568[/C][C]0.3988[/C][/ROW]
[ROW][C]15[/C][C]-0.048351[/C][C]-0.6487[/C][C]0.258681[/C][/ROW]
[ROW][C]16[/C][C]-0.089388[/C][C]-1.1993[/C][C]0.116[/C][/ROW]
[ROW][C]17[/C][C]-0.092995[/C][C]-1.2477[/C][C]0.10689[/C][/ROW]
[ROW][C]18[/C][C]-0.027804[/C][C]-0.373[/C][C]0.354782[/C][/ROW]
[ROW][C]19[/C][C]-0.016685[/C][C]-0.2238[/C][C]0.411565[/C][/ROW]
[ROW][C]20[/C][C]-0.056773[/C][C]-0.7617[/C][C]0.22362[/C][/ROW]
[ROW][C]21[/C][C]-0.071789[/C][C]-0.9631[/C][C]0.168383[/C][/ROW]
[ROW][C]22[/C][C]-0.084195[/C][C]-1.1296[/C][C]0.130076[/C][/ROW]
[ROW][C]23[/C][C]0.109018[/C][C]1.4626[/C][C]0.072656[/C][/ROW]
[ROW][C]24[/C][C]-0.013357[/C][C]-0.1792[/C][C]0.42899[/C][/ROW]
[ROW][C]25[/C][C]-0.062324[/C][C]-0.8362[/C][C]0.202087[/C][/ROW]
[ROW][C]26[/C][C]0.000651[/C][C]0.0087[/C][C]0.496519[/C][/ROW]
[ROW][C]27[/C][C]-0.018886[/C][C]-0.2534[/C][C]0.400133[/C][/ROW]
[ROW][C]28[/C][C]0.10383[/C][C]1.393[/C][C]0.082666[/C][/ROW]
[ROW][C]29[/C][C]-0.056063[/C][C]-0.7522[/C][C]0.226467[/C][/ROW]
[ROW][C]30[/C][C]-0.0571[/C][C]-0.7661[/C][C]0.222316[/C][/ROW]
[ROW][C]31[/C][C]-0.037988[/C][C]-0.5097[/C][C]0.305454[/C][/ROW]
[ROW][C]32[/C][C]0.089747[/C][C]1.2041[/C][C]0.115068[/C][/ROW]
[ROW][C]33[/C][C]-0.006035[/C][C]-0.081[/C][C]0.467779[/C][/ROW]
[ROW][C]34[/C][C]0.110966[/C][C]1.4888[/C][C]0.06915[/C][/ROW]
[ROW][C]35[/C][C]-0.053033[/C][C]-0.7115[/C][C]0.238843[/C][/ROW]
[ROW][C]36[/C][C]-0.022355[/C][C]-0.2999[/C][C]0.382291[/C][/ROW]
[ROW][C]37[/C][C]0.006428[/C][C]0.0862[/C][C]0.465684[/C][/ROW]
[ROW][C]38[/C][C]-0.035203[/C][C]-0.4723[/C][C]0.318643[/C][/ROW]
[ROW][C]39[/C][C]0.011497[/C][C]0.1542[/C][C]0.438795[/C][/ROW]
[ROW][C]40[/C][C]-0.002273[/C][C]-0.0305[/C][C]0.487853[/C][/ROW]
[ROW][C]41[/C][C]0.02424[/C][C]0.3252[/C][C]0.3727[/C][/ROW]
[ROW][C]42[/C][C]-0.080293[/C][C]-1.0772[/C][C]0.141408[/C][/ROW]
[ROW][C]43[/C][C]0.152798[/C][C]2.05[/C][C]0.020907[/C][/ROW]
[ROW][C]44[/C][C]0.050339[/C][C]0.6754[/C][C]0.250154[/C][/ROW]
[ROW][C]45[/C][C]-0.032348[/C][C]-0.434[/C][C]0.332406[/C][/ROW]
[ROW][C]46[/C][C]0.03565[/C][C]0.4783[/C][C]0.316509[/C][/ROW]
[ROW][C]47[/C][C]0.025007[/C][C]0.3355[/C][C]0.368817[/C][/ROW]
[ROW][C]48[/C][C]0.155175[/C][C]2.0819[/C][C]0.019383[/C][/ROW]
[/TABLE]
Source: https://freestatistics.org/blog/index.php?pk=105329&T=2

Globally Unique Identifier (entire table): ba.freestatistics.org/blog/index.php?pk=105329&T=2

As an alternative you can also use a QR Code:  

The GUIDs for individual cells are displayed in the table below:

Partial Autocorrelation Function
Time lag kPACF(k)T-STATP-value
10.0712990.95660.170032
20.2339963.13940.00099
30.3588584.81462e-06
40.2224482.98450.001618
50.1628982.18550.015071
60.0847261.13670.128583
7-0.218152-2.92680.001933
80.1921652.57820.005366
90.1714072.29970.011307
10-0.05511-0.73940.23032
11-0.267665-3.59110.000212
120.361184.84571e-06
13-0.055632-0.74640.228205
140.0191430.25680.3988
15-0.048351-0.64870.258681
16-0.089388-1.19930.116
17-0.092995-1.24770.10689
18-0.027804-0.3730.354782
19-0.016685-0.22380.411565
20-0.056773-0.76170.22362
21-0.071789-0.96310.168383
22-0.084195-1.12960.130076
230.1090181.46260.072656
24-0.013357-0.17920.42899
25-0.062324-0.83620.202087
260.0006510.00870.496519
27-0.018886-0.25340.400133
280.103831.3930.082666
29-0.056063-0.75220.226467
30-0.0571-0.76610.222316
31-0.037988-0.50970.305454
320.0897471.20410.115068
33-0.006035-0.0810.467779
340.1109661.48880.06915
35-0.053033-0.71150.238843
36-0.022355-0.29990.382291
370.0064280.08620.465684
38-0.035203-0.47230.318643
390.0114970.15420.438795
40-0.002273-0.03050.487853
410.024240.32520.3727
42-0.080293-1.07720.141408
430.1527982.050.020907
440.0503390.67540.250154
45-0.032348-0.4340.332406
460.035650.47830.316509
470.0250070.33550.368817
480.1551752.08190.019383


Parameters (Session):
par1 = 48 ; par2 = 1 ; par3 = 0 ; par4 = 0 ; par5 = 12 ; par6 = White Noise ; par7 = 0.95 ;
Parameters (R input):
par1 = 48 ; par2 = 1 ; par3 = 0 ; par4 = 0 ; par5 = 12 ; par6 = White Noise ; par7 = 0.95 ;
R code (references can be found in the software module):
if (par1 == 'Default') {
par1 = 10*log10(length(x))
} else {
par1 <- as.numeric(par1)
}
par2 <- as.numeric(par2)
par3 <- as.numeric(par3)
par4 <- as.numeric(par4)
par5 <- as.numeric(par5)
if (par6 == 'White Noise') par6 <- 'white' else par6 <- 'ma'
par7 <- as.numeric(par7)
if (par2 == 0) {
x <- log(x)
} else {
x <- (x ^ par2 - 1) / par2
}
if (par3 > 0) x <- diff(x,lag=1,difference=par3)
if (par4 > 0) x <- diff(x,lag=par5,difference=par4)
bitmap(file='pic1.png')
racf <- acf(x, par1, main='Autocorrelation', xlab='time lag', ylab='ACF', ci.type=par6, ci=par7, sub=paste('(lambda=',par2,', d=',par3,', D=',par4,', CI=', par7, ', CI type=',par6,')',sep=''))
dev.off()
bitmap(file='pic2.png')
rpacf <- pacf(x,par1,main='Partial Autocorrelation',xlab='lags',ylab='PACF')
dev.off()
(myacf <- c(racf$acf))
(mypacf <- c(rpacf$acf))
lengthx <- length(x)
sqrtn <- sqrt(lengthx)
load(file='createtable')
a<-table.start()
a<-table.row.start(a)
a<-table.element(a,'Autocorrelation Function',4,TRUE)
a<-table.row.end(a)
a<-table.row.start(a)
a<-table.element(a,'Time lag k',header=TRUE)
a<-table.element(a,hyperlink('basics.htm','ACF(k)','click here for more information about the Autocorrelation Function'),header=TRUE)
a<-table.element(a,'T-STAT',header=TRUE)
a<-table.element(a,'P-value',header=TRUE)
a<-table.row.end(a)
for (i in 2:(par1+1)) {
a<-table.row.start(a)
a<-table.element(a,i-1,header=TRUE)
a<-table.element(a,round(myacf[i],6))
mytstat <- myacf[i]*sqrtn
a<-table.element(a,round(mytstat,4))
a<-table.element(a,round(1-pt(abs(mytstat),lengthx),6))
a<-table.row.end(a)
}
a<-table.end(a)
table.save(a,file='mytable.tab')
a<-table.start()
a<-table.row.start(a)
a<-table.element(a,'Partial Autocorrelation Function',4,TRUE)
a<-table.row.end(a)
a<-table.row.start(a)
a<-table.element(a,'Time lag k',header=TRUE)
a<-table.element(a,hyperlink('basics.htm','PACF(k)','click here for more information about the Partial Autocorrelation Function'),header=TRUE)
a<-table.element(a,'T-STAT',header=TRUE)
a<-table.element(a,'P-value',header=TRUE)
a<-table.row.end(a)
for (i in 1:par1) {
a<-table.row.start(a)
a<-table.element(a,i,header=TRUE)
a<-table.element(a,round(mypacf[i],6))
mytstat <- mypacf[i]*sqrtn
a<-table.element(a,round(mytstat,4))
a<-table.element(a,round(1-pt(abs(mytstat),lengthx),6))
a<-table.row.end(a)
}
a<-table.end(a)
table.save(a,file='mytable1.tab')