| Tabulation of Results | ||
| PersonalStandards x Organization | ||
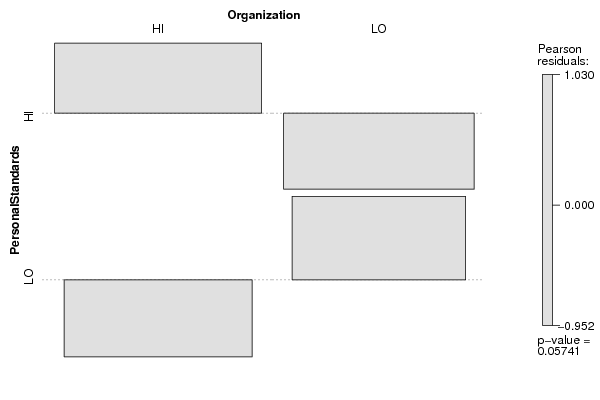
| HI | LO | HI | 53 | 34 | LO | 33 | 39 |
| Tabulation of Expected Results | ||
| PersonalStandards x Organization | ||
| HI | LO | HI | 47.06 | 39.94 | LO | 38.94 | 33.06 |
| Statistical Results | |
| Pearson's Chi-squared test with Yates' continuity correction | |
| Chi Square Statistic | 3.03 |
| Degrees of Freedom | 1 |
| P value | 0.08 |