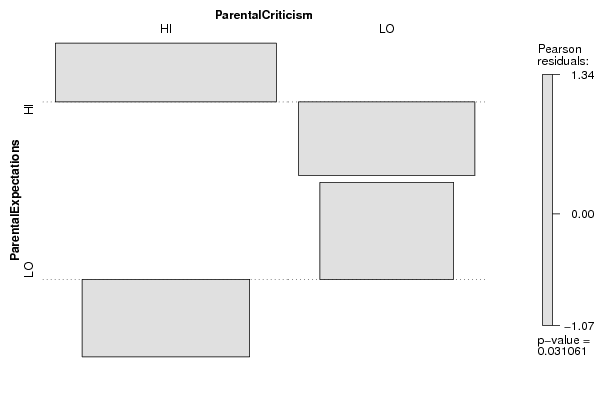
| Tabulation of Results | ||
| ParentalExpectations x ParentalCriticism | ||
| HI | LO | HI | 68 | 33 | LO | 29 | 29 |
| Tabulation of Expected Results | ||
| ParentalExpectations x ParentalCriticism | ||
| HI | LO | HI | 61.62 | 39.38 | LO | 35.38 | 22.62 |
| Statistical Results | |
| Pearson's Chi-squared test with Yates' continuity correction | |
| Chi Square Statistic | 3.95 |
| Degrees of Freedom | 1 |
| P value | 0.05 |