| Tabulation of Results | ||
| Doubtsaboutactions x Organization | ||
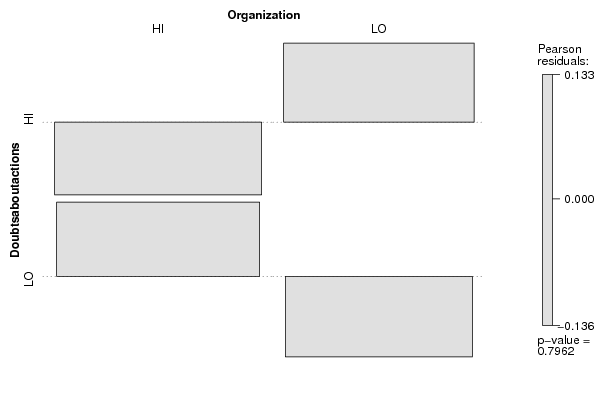
| HI | LO | HI | 43 | 38 | LO | 43 | 35 |
| Tabulation of Expected Results | ||
| Doubtsaboutactions x Organization | ||
| HI | LO | HI | 43.81 | 37.19 | LO | 42.19 | 35.81 |
| Statistical Results | |
| Pearson's Chi-squared test with Yates' continuity correction | |
| Chi Square Statistic | 0.01 |
| Degrees of Freedom | 1 |
| P value | 0.92 |