| Tabulation of Results | ||||
| ConcernoverMistakes x PersonalStandards | ||||
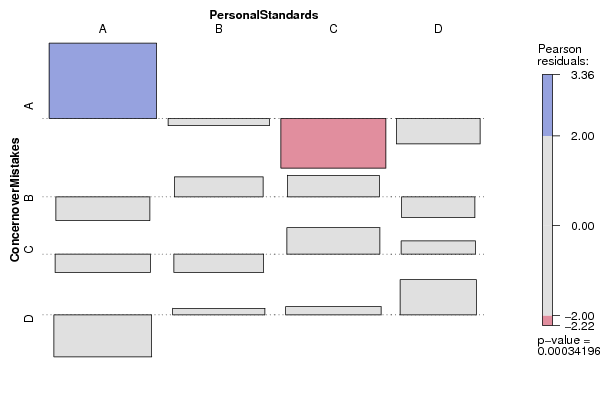
| A | B | C | D | A | 26 | 11 | 5 | 5 | B | 7 | 12 | 13 | 4 | C | 8 | 7 | 14 | 8 | D | 5 | 11 | 12 | 11 |
| Tabulation of Expected Results | ||||
| ConcernoverMistakes x PersonalStandards | ||||
| A | B | C | D | A | 13.6 | 12.12 | 13.01 | 8.28 | B | 10.42 | 9.28 | 9.96 | 6.34 | C | 10.7 | 9.54 | 10.24 | 6.52 | D | 11.28 | 10.06 | 10.79 | 6.87 |
| Statistical Results | |
| Pearson's Chi-squared test with simulated p-value (based on 2000 replicates) | |
| Chi Square Statistic | 30.63 |
| P value | 0 |