| Tabulation of Results | ||
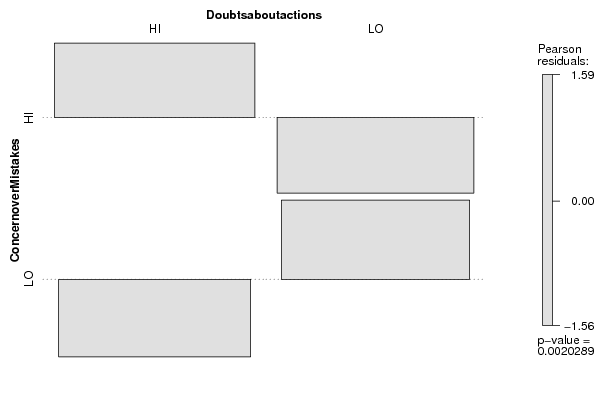
| ConcernoverMistakes x Doubtsaboutactions | ||
| HI | LO | HI | 52 | 31 | LO | 29 | 47 |
| Tabulation of Expected Results | ||
| ConcernoverMistakes x Doubtsaboutactions | ||
| HI | LO | HI | 42.28 | 40.72 | LO | 38.72 | 37.28 |
| Statistical Results | |
| Pearson's Chi-squared test with Yates' continuity correction | |
| Chi Square Statistic | 8.57 |
| Degrees of Freedom | 1 |
| P value | 0 |