Free Statistics

of Irreproducible Research!

Author's title

Author*The author of this computation has been verified*
R Software Modulerwasp_autocorrelation.wasp
Title produced by software(Partial) Autocorrelation Function
Date of computationSat, 04 Dec 2010 20:50:26 +0000
Cite this page as followsStatistical Computations at FreeStatistics.org, Office for Research Development and Education, URL https://freestatistics.org/blog/index.php?v=date/2010/Dec/04/t12914957607x8cv6l0zud5bl4.htm/, Retrieved Sat, 04 May 2024 20:36:23 +0000
Statistical Computations at FreeStatistics.org, Office for Research Development and Education, URL https://freestatistics.org/blog/index.php?pk=105268, Retrieved Sat, 04 May 2024 20:36:23 +0000
QR Codes:

Original text written by user:
IsPrivate?No (this computation is public)
User-defined keywords
Estimated Impact117
Family? (F = Feedback message, R = changed R code, M = changed R Module, P = changed Parameters, D = changed Data)
-     [(Partial) Autocorrelation Function] [W9 - autocorrelat...] [2010-12-04 20:25:47] [48146708a479232c43a8f6e52fbf83b4]
-   P   [(Partial) Autocorrelation Function] [W9 - autocorrelat...] [2010-12-04 20:36:59] [48146708a479232c43a8f6e52fbf83b4]
-   P       [(Partial) Autocorrelation Function] [W9 - autocorrelat...] [2010-12-04 20:50:26] [6f3869f9d1e39c73f93153f1f7803f84] [Current]
Feedback Forum

Post a new message
Dataseries X:
612
595
597
593
590
580
574
573
573
620
626
620
588
566
557
561
549
532
526
511
499
555
565
542
527
510
514
517
508
493
490
469
478
528
534
518
506
502
516
528
533
536
537
524
536
587
597
581
564
558
575
580
575
563
552
537
545
601
604
586
564


Summary of computational transaction
Raw Inputview raw input (R code)
Raw Outputview raw output of R engine
Computing time2 seconds
R Server'Gwilym Jenkins' @ 72.249.127.135

\begin{tabular}{lllllllll}
\hline
Summary of computational transaction \tabularnewline
Raw Input & view raw input (R code)  \tabularnewline
Raw Output & view raw output of R engine  \tabularnewline
Computing time & 2 seconds \tabularnewline
R Server & 'Gwilym Jenkins' @ 72.249.127.135 \tabularnewline
\hline
\end{tabular}
%Source: https://freestatistics.org/blog/index.php?pk=105268&T=0

[TABLE]
[ROW][C]Summary of computational transaction[/C][/ROW]
[ROW][C]Raw Input[/C][C]view raw input (R code) [/C][/ROW]
[ROW][C]Raw Output[/C][C]view raw output of R engine [/C][/ROW]
[ROW][C]Computing time[/C][C]2 seconds[/C][/ROW]
[ROW][C]R Server[/C][C]'Gwilym Jenkins' @ 72.249.127.135[/C][/ROW]
[/TABLE]
Source: https://freestatistics.org/blog/index.php?pk=105268&T=0

Globally Unique Identifier (entire table): ba.freestatistics.org/blog/index.php?pk=105268&T=0

As an alternative you can also use a QR Code:  

The GUIDs for individual cells are displayed in the table below:

Summary of computational transaction
Raw Inputview raw input (R code)
Raw Outputview raw output of R engine
Computing time2 seconds
R Server'Gwilym Jenkins' @ 72.249.127.135


Autocorrelation Function
Time lag kACF(k)T-STATP-value
10.1916751.3280.095235
20.2659131.84230.035807
30.3501452.42590.00954
40.2080481.44140.077982
50.0844950.58540.280511
60.2209361.53070.066205
7-0.023211-0.16080.436458
80.0036820.02550.489876
9-0.032023-0.22190.412682
10-0.129011-0.89380.18794
110.0618750.42870.335035
12-0.230011-1.59360.0588
13-0.158272-1.09650.139157
14-0.028275-0.19590.422761
15-0.082917-0.57450.284168
16-0.149527-1.0360.152708
17-0.014532-0.10070.460112
18-0.2091-1.44870.076963
19-0.129997-0.90060.186136
20-0.083903-0.58130.28188
21-0.25309-1.75350.042953
22-0.157286-1.08970.140641
23-0.180366-1.24960.108751
24-0.19253-1.33390.094268
25-0.049776-0.34490.365853
26-0.126512-0.87650.192561
27-0.209824-1.45370.076268
28-0.113098-0.78360.218571
29-0.035442-0.24550.403539
30-0.061547-0.42640.335859
310.0468830.32480.373366
32-0.00697-0.04830.480843
330.0739740.51250.305323
340.0385320.2670.395322
350.1290770.89430.18782
360.054840.37990.352833
370.0706860.48970.313278
380.0456340.31620.376626
390.0764730.52980.29934
400.086270.59770.276425
410.0416230.28840.387152
420.05050.34990.363982
43-0.0048-0.03330.486804
440.0249870.17310.431645
450.0075620.05240.479218
460.0202520.14030.4445
470.0079560.05510.478135
48NANANA

\begin{tabular}{lllllllll}
\hline
Autocorrelation Function \tabularnewline
Time lag k & ACF(k) & T-STAT & P-value \tabularnewline
1 & 0.191675 & 1.328 & 0.095235 \tabularnewline
2 & 0.265913 & 1.8423 & 0.035807 \tabularnewline
3 & 0.350145 & 2.4259 & 0.00954 \tabularnewline
4 & 0.208048 & 1.4414 & 0.077982 \tabularnewline
5 & 0.084495 & 0.5854 & 0.280511 \tabularnewline
6 & 0.220936 & 1.5307 & 0.066205 \tabularnewline
7 & -0.023211 & -0.1608 & 0.436458 \tabularnewline
8 & 0.003682 & 0.0255 & 0.489876 \tabularnewline
9 & -0.032023 & -0.2219 & 0.412682 \tabularnewline
10 & -0.129011 & -0.8938 & 0.18794 \tabularnewline
11 & 0.061875 & 0.4287 & 0.335035 \tabularnewline
12 & -0.230011 & -1.5936 & 0.0588 \tabularnewline
13 & -0.158272 & -1.0965 & 0.139157 \tabularnewline
14 & -0.028275 & -0.1959 & 0.422761 \tabularnewline
15 & -0.082917 & -0.5745 & 0.284168 \tabularnewline
16 & -0.149527 & -1.036 & 0.152708 \tabularnewline
17 & -0.014532 & -0.1007 & 0.460112 \tabularnewline
18 & -0.2091 & -1.4487 & 0.076963 \tabularnewline
19 & -0.129997 & -0.9006 & 0.186136 \tabularnewline
20 & -0.083903 & -0.5813 & 0.28188 \tabularnewline
21 & -0.25309 & -1.7535 & 0.042953 \tabularnewline
22 & -0.157286 & -1.0897 & 0.140641 \tabularnewline
23 & -0.180366 & -1.2496 & 0.108751 \tabularnewline
24 & -0.19253 & -1.3339 & 0.094268 \tabularnewline
25 & -0.049776 & -0.3449 & 0.365853 \tabularnewline
26 & -0.126512 & -0.8765 & 0.192561 \tabularnewline
27 & -0.209824 & -1.4537 & 0.076268 \tabularnewline
28 & -0.113098 & -0.7836 & 0.218571 \tabularnewline
29 & -0.035442 & -0.2455 & 0.403539 \tabularnewline
30 & -0.061547 & -0.4264 & 0.335859 \tabularnewline
31 & 0.046883 & 0.3248 & 0.373366 \tabularnewline
32 & -0.00697 & -0.0483 & 0.480843 \tabularnewline
33 & 0.073974 & 0.5125 & 0.305323 \tabularnewline
34 & 0.038532 & 0.267 & 0.395322 \tabularnewline
35 & 0.129077 & 0.8943 & 0.18782 \tabularnewline
36 & 0.05484 & 0.3799 & 0.352833 \tabularnewline
37 & 0.070686 & 0.4897 & 0.313278 \tabularnewline
38 & 0.045634 & 0.3162 & 0.376626 \tabularnewline
39 & 0.076473 & 0.5298 & 0.29934 \tabularnewline
40 & 0.08627 & 0.5977 & 0.276425 \tabularnewline
41 & 0.041623 & 0.2884 & 0.387152 \tabularnewline
42 & 0.0505 & 0.3499 & 0.363982 \tabularnewline
43 & -0.0048 & -0.0333 & 0.486804 \tabularnewline
44 & 0.024987 & 0.1731 & 0.431645 \tabularnewline
45 & 0.007562 & 0.0524 & 0.479218 \tabularnewline
46 & 0.020252 & 0.1403 & 0.4445 \tabularnewline
47 & 0.007956 & 0.0551 & 0.478135 \tabularnewline
48 & NA & NA & NA \tabularnewline
\hline
\end{tabular}
%Source: https://freestatistics.org/blog/index.php?pk=105268&T=1

[TABLE]
[ROW][C]Autocorrelation Function[/C][/ROW]
[ROW][C]Time lag k[/C][C]ACF(k)[/C][C]T-STAT[/C][C]P-value[/C][/ROW]
[ROW][C]1[/C][C]0.191675[/C][C]1.328[/C][C]0.095235[/C][/ROW]
[ROW][C]2[/C][C]0.265913[/C][C]1.8423[/C][C]0.035807[/C][/ROW]
[ROW][C]3[/C][C]0.350145[/C][C]2.4259[/C][C]0.00954[/C][/ROW]
[ROW][C]4[/C][C]0.208048[/C][C]1.4414[/C][C]0.077982[/C][/ROW]
[ROW][C]5[/C][C]0.084495[/C][C]0.5854[/C][C]0.280511[/C][/ROW]
[ROW][C]6[/C][C]0.220936[/C][C]1.5307[/C][C]0.066205[/C][/ROW]
[ROW][C]7[/C][C]-0.023211[/C][C]-0.1608[/C][C]0.436458[/C][/ROW]
[ROW][C]8[/C][C]0.003682[/C][C]0.0255[/C][C]0.489876[/C][/ROW]
[ROW][C]9[/C][C]-0.032023[/C][C]-0.2219[/C][C]0.412682[/C][/ROW]
[ROW][C]10[/C][C]-0.129011[/C][C]-0.8938[/C][C]0.18794[/C][/ROW]
[ROW][C]11[/C][C]0.061875[/C][C]0.4287[/C][C]0.335035[/C][/ROW]
[ROW][C]12[/C][C]-0.230011[/C][C]-1.5936[/C][C]0.0588[/C][/ROW]
[ROW][C]13[/C][C]-0.158272[/C][C]-1.0965[/C][C]0.139157[/C][/ROW]
[ROW][C]14[/C][C]-0.028275[/C][C]-0.1959[/C][C]0.422761[/C][/ROW]
[ROW][C]15[/C][C]-0.082917[/C][C]-0.5745[/C][C]0.284168[/C][/ROW]
[ROW][C]16[/C][C]-0.149527[/C][C]-1.036[/C][C]0.152708[/C][/ROW]
[ROW][C]17[/C][C]-0.014532[/C][C]-0.1007[/C][C]0.460112[/C][/ROW]
[ROW][C]18[/C][C]-0.2091[/C][C]-1.4487[/C][C]0.076963[/C][/ROW]
[ROW][C]19[/C][C]-0.129997[/C][C]-0.9006[/C][C]0.186136[/C][/ROW]
[ROW][C]20[/C][C]-0.083903[/C][C]-0.5813[/C][C]0.28188[/C][/ROW]
[ROW][C]21[/C][C]-0.25309[/C][C]-1.7535[/C][C]0.042953[/C][/ROW]
[ROW][C]22[/C][C]-0.157286[/C][C]-1.0897[/C][C]0.140641[/C][/ROW]
[ROW][C]23[/C][C]-0.180366[/C][C]-1.2496[/C][C]0.108751[/C][/ROW]
[ROW][C]24[/C][C]-0.19253[/C][C]-1.3339[/C][C]0.094268[/C][/ROW]
[ROW][C]25[/C][C]-0.049776[/C][C]-0.3449[/C][C]0.365853[/C][/ROW]
[ROW][C]26[/C][C]-0.126512[/C][C]-0.8765[/C][C]0.192561[/C][/ROW]
[ROW][C]27[/C][C]-0.209824[/C][C]-1.4537[/C][C]0.076268[/C][/ROW]
[ROW][C]28[/C][C]-0.113098[/C][C]-0.7836[/C][C]0.218571[/C][/ROW]
[ROW][C]29[/C][C]-0.035442[/C][C]-0.2455[/C][C]0.403539[/C][/ROW]
[ROW][C]30[/C][C]-0.061547[/C][C]-0.4264[/C][C]0.335859[/C][/ROW]
[ROW][C]31[/C][C]0.046883[/C][C]0.3248[/C][C]0.373366[/C][/ROW]
[ROW][C]32[/C][C]-0.00697[/C][C]-0.0483[/C][C]0.480843[/C][/ROW]
[ROW][C]33[/C][C]0.073974[/C][C]0.5125[/C][C]0.305323[/C][/ROW]
[ROW][C]34[/C][C]0.038532[/C][C]0.267[/C][C]0.395322[/C][/ROW]
[ROW][C]35[/C][C]0.129077[/C][C]0.8943[/C][C]0.18782[/C][/ROW]
[ROW][C]36[/C][C]0.05484[/C][C]0.3799[/C][C]0.352833[/C][/ROW]
[ROW][C]37[/C][C]0.070686[/C][C]0.4897[/C][C]0.313278[/C][/ROW]
[ROW][C]38[/C][C]0.045634[/C][C]0.3162[/C][C]0.376626[/C][/ROW]
[ROW][C]39[/C][C]0.076473[/C][C]0.5298[/C][C]0.29934[/C][/ROW]
[ROW][C]40[/C][C]0.08627[/C][C]0.5977[/C][C]0.276425[/C][/ROW]
[ROW][C]41[/C][C]0.041623[/C][C]0.2884[/C][C]0.387152[/C][/ROW]
[ROW][C]42[/C][C]0.0505[/C][C]0.3499[/C][C]0.363982[/C][/ROW]
[ROW][C]43[/C][C]-0.0048[/C][C]-0.0333[/C][C]0.486804[/C][/ROW]
[ROW][C]44[/C][C]0.024987[/C][C]0.1731[/C][C]0.431645[/C][/ROW]
[ROW][C]45[/C][C]0.007562[/C][C]0.0524[/C][C]0.479218[/C][/ROW]
[ROW][C]46[/C][C]0.020252[/C][C]0.1403[/C][C]0.4445[/C][/ROW]
[ROW][C]47[/C][C]0.007956[/C][C]0.0551[/C][C]0.478135[/C][/ROW]
[ROW][C]48[/C][C]NA[/C][C]NA[/C][C]NA[/C][/ROW]
[/TABLE]
Source: https://freestatistics.org/blog/index.php?pk=105268&T=1

Globally Unique Identifier (entire table): ba.freestatistics.org/blog/index.php?pk=105268&T=1

As an alternative you can also use a QR Code:  

The GUIDs for individual cells are displayed in the table below:

Autocorrelation Function
Time lag kACF(k)T-STATP-value
10.1916751.3280.095235
20.2659131.84230.035807
30.3501452.42590.00954
40.2080481.44140.077982
50.0844950.58540.280511
60.2209361.53070.066205
7-0.023211-0.16080.436458
80.0036820.02550.489876
9-0.032023-0.22190.412682
10-0.129011-0.89380.18794
110.0618750.42870.335035
12-0.230011-1.59360.0588
13-0.158272-1.09650.139157
14-0.028275-0.19590.422761
15-0.082917-0.57450.284168
16-0.149527-1.0360.152708
17-0.014532-0.10070.460112
18-0.2091-1.44870.076963
19-0.129997-0.90060.186136
20-0.083903-0.58130.28188
21-0.25309-1.75350.042953
22-0.157286-1.08970.140641
23-0.180366-1.24960.108751
24-0.19253-1.33390.094268
25-0.049776-0.34490.365853
26-0.126512-0.87650.192561
27-0.209824-1.45370.076268
28-0.113098-0.78360.218571
29-0.035442-0.24550.403539
30-0.061547-0.42640.335859
310.0468830.32480.373366
32-0.00697-0.04830.480843
330.0739740.51250.305323
340.0385320.2670.395322
350.1290770.89430.18782
360.054840.37990.352833
370.0706860.48970.313278
380.0456340.31620.376626
390.0764730.52980.29934
400.086270.59770.276425
410.0416230.28840.387152
420.05050.34990.363982
43-0.0048-0.03330.486804
440.0249870.17310.431645
450.0075620.05240.479218
460.0202520.14030.4445
470.0079560.05510.478135
48NANANA


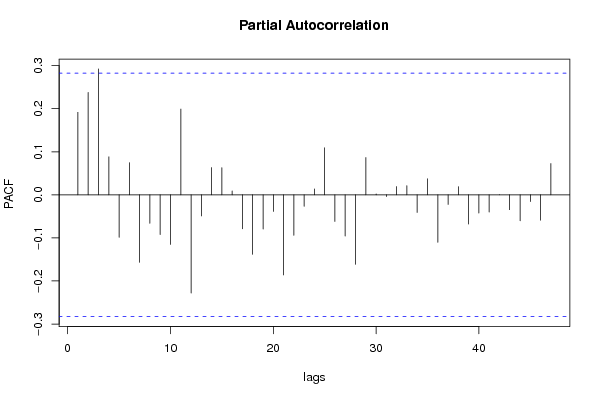
Partial Autocorrelation Function
Time lag kPACF(k)T-STATP-value
10.1916751.3280.095235
20.2379141.64830.052909
30.2923832.02570.024188
40.0882120.61110.271993
5-0.098522-0.68260.249077
60.0746750.51740.30364
7-0.156815-1.08640.141355
8-0.066255-0.4590.324144
9-0.092127-0.63830.263165
10-0.115288-0.79870.214187
110.199341.38110.086827
12-0.227996-1.57960.060383
13-0.048874-0.33860.36819
140.0633550.43890.331338
150.0630140.43660.332188
160.0091570.06340.474838
17-0.078873-0.54640.293646
18-0.138058-0.95650.171808
19-0.079381-0.550.292446
20-0.038507-0.26680.395389
21-0.185903-1.2880.101965
22-0.094102-0.6520.258769
23-0.026586-0.18420.42732
240.0138330.09580.462023
250.1092970.75720.226306
26-0.061665-0.42720.335562
27-0.095674-0.66280.2553
28-0.161351-1.11790.134593
290.0866780.60050.275491
300.0021390.01480.494119
31-0.003988-0.02760.489036
320.0191230.13250.447576
330.0213970.14820.441385
34-0.040806-0.28270.389307
350.0373690.25890.398411
36-0.110177-0.76330.224501
37-0.022329-0.15470.438853
380.0188780.13080.448245
39-0.067868-0.47020.320168
40-0.042257-0.29280.385481
41-0.039926-0.27660.391632
427.9e-055e-040.499783
43-0.034442-0.23860.406207
44-0.060298-0.41780.338993
45-0.015666-0.10850.457012
46-0.058973-0.40860.342335
470.0726920.50360.308413
48NANANA

\begin{tabular}{lllllllll}
\hline
Partial Autocorrelation Function \tabularnewline
Time lag k & PACF(k) & T-STAT & P-value \tabularnewline
1 & 0.191675 & 1.328 & 0.095235 \tabularnewline
2 & 0.237914 & 1.6483 & 0.052909 \tabularnewline
3 & 0.292383 & 2.0257 & 0.024188 \tabularnewline
4 & 0.088212 & 0.6111 & 0.271993 \tabularnewline
5 & -0.098522 & -0.6826 & 0.249077 \tabularnewline
6 & 0.074675 & 0.5174 & 0.30364 \tabularnewline
7 & -0.156815 & -1.0864 & 0.141355 \tabularnewline
8 & -0.066255 & -0.459 & 0.324144 \tabularnewline
9 & -0.092127 & -0.6383 & 0.263165 \tabularnewline
10 & -0.115288 & -0.7987 & 0.214187 \tabularnewline
11 & 0.19934 & 1.3811 & 0.086827 \tabularnewline
12 & -0.227996 & -1.5796 & 0.060383 \tabularnewline
13 & -0.048874 & -0.3386 & 0.36819 \tabularnewline
14 & 0.063355 & 0.4389 & 0.331338 \tabularnewline
15 & 0.063014 & 0.4366 & 0.332188 \tabularnewline
16 & 0.009157 & 0.0634 & 0.474838 \tabularnewline
17 & -0.078873 & -0.5464 & 0.293646 \tabularnewline
18 & -0.138058 & -0.9565 & 0.171808 \tabularnewline
19 & -0.079381 & -0.55 & 0.292446 \tabularnewline
20 & -0.038507 & -0.2668 & 0.395389 \tabularnewline
21 & -0.185903 & -1.288 & 0.101965 \tabularnewline
22 & -0.094102 & -0.652 & 0.258769 \tabularnewline
23 & -0.026586 & -0.1842 & 0.42732 \tabularnewline
24 & 0.013833 & 0.0958 & 0.462023 \tabularnewline
25 & 0.109297 & 0.7572 & 0.226306 \tabularnewline
26 & -0.061665 & -0.4272 & 0.335562 \tabularnewline
27 & -0.095674 & -0.6628 & 0.2553 \tabularnewline
28 & -0.161351 & -1.1179 & 0.134593 \tabularnewline
29 & 0.086678 & 0.6005 & 0.275491 \tabularnewline
30 & 0.002139 & 0.0148 & 0.494119 \tabularnewline
31 & -0.003988 & -0.0276 & 0.489036 \tabularnewline
32 & 0.019123 & 0.1325 & 0.447576 \tabularnewline
33 & 0.021397 & 0.1482 & 0.441385 \tabularnewline
34 & -0.040806 & -0.2827 & 0.389307 \tabularnewline
35 & 0.037369 & 0.2589 & 0.398411 \tabularnewline
36 & -0.110177 & -0.7633 & 0.224501 \tabularnewline
37 & -0.022329 & -0.1547 & 0.438853 \tabularnewline
38 & 0.018878 & 0.1308 & 0.448245 \tabularnewline
39 & -0.067868 & -0.4702 & 0.320168 \tabularnewline
40 & -0.042257 & -0.2928 & 0.385481 \tabularnewline
41 & -0.039926 & -0.2766 & 0.391632 \tabularnewline
42 & 7.9e-05 & 5e-04 & 0.499783 \tabularnewline
43 & -0.034442 & -0.2386 & 0.406207 \tabularnewline
44 & -0.060298 & -0.4178 & 0.338993 \tabularnewline
45 & -0.015666 & -0.1085 & 0.457012 \tabularnewline
46 & -0.058973 & -0.4086 & 0.342335 \tabularnewline
47 & 0.072692 & 0.5036 & 0.308413 \tabularnewline
48 & NA & NA & NA \tabularnewline
\hline
\end{tabular}
%Source: https://freestatistics.org/blog/index.php?pk=105268&T=2

[TABLE]
[ROW][C]Partial Autocorrelation Function[/C][/ROW]
[ROW][C]Time lag k[/C][C]PACF(k)[/C][C]T-STAT[/C][C]P-value[/C][/ROW]
[ROW][C]1[/C][C]0.191675[/C][C]1.328[/C][C]0.095235[/C][/ROW]
[ROW][C]2[/C][C]0.237914[/C][C]1.6483[/C][C]0.052909[/C][/ROW]
[ROW][C]3[/C][C]0.292383[/C][C]2.0257[/C][C]0.024188[/C][/ROW]
[ROW][C]4[/C][C]0.088212[/C][C]0.6111[/C][C]0.271993[/C][/ROW]
[ROW][C]5[/C][C]-0.098522[/C][C]-0.6826[/C][C]0.249077[/C][/ROW]
[ROW][C]6[/C][C]0.074675[/C][C]0.5174[/C][C]0.30364[/C][/ROW]
[ROW][C]7[/C][C]-0.156815[/C][C]-1.0864[/C][C]0.141355[/C][/ROW]
[ROW][C]8[/C][C]-0.066255[/C][C]-0.459[/C][C]0.324144[/C][/ROW]
[ROW][C]9[/C][C]-0.092127[/C][C]-0.6383[/C][C]0.263165[/C][/ROW]
[ROW][C]10[/C][C]-0.115288[/C][C]-0.7987[/C][C]0.214187[/C][/ROW]
[ROW][C]11[/C][C]0.19934[/C][C]1.3811[/C][C]0.086827[/C][/ROW]
[ROW][C]12[/C][C]-0.227996[/C][C]-1.5796[/C][C]0.060383[/C][/ROW]
[ROW][C]13[/C][C]-0.048874[/C][C]-0.3386[/C][C]0.36819[/C][/ROW]
[ROW][C]14[/C][C]0.063355[/C][C]0.4389[/C][C]0.331338[/C][/ROW]
[ROW][C]15[/C][C]0.063014[/C][C]0.4366[/C][C]0.332188[/C][/ROW]
[ROW][C]16[/C][C]0.009157[/C][C]0.0634[/C][C]0.474838[/C][/ROW]
[ROW][C]17[/C][C]-0.078873[/C][C]-0.5464[/C][C]0.293646[/C][/ROW]
[ROW][C]18[/C][C]-0.138058[/C][C]-0.9565[/C][C]0.171808[/C][/ROW]
[ROW][C]19[/C][C]-0.079381[/C][C]-0.55[/C][C]0.292446[/C][/ROW]
[ROW][C]20[/C][C]-0.038507[/C][C]-0.2668[/C][C]0.395389[/C][/ROW]
[ROW][C]21[/C][C]-0.185903[/C][C]-1.288[/C][C]0.101965[/C][/ROW]
[ROW][C]22[/C][C]-0.094102[/C][C]-0.652[/C][C]0.258769[/C][/ROW]
[ROW][C]23[/C][C]-0.026586[/C][C]-0.1842[/C][C]0.42732[/C][/ROW]
[ROW][C]24[/C][C]0.013833[/C][C]0.0958[/C][C]0.462023[/C][/ROW]
[ROW][C]25[/C][C]0.109297[/C][C]0.7572[/C][C]0.226306[/C][/ROW]
[ROW][C]26[/C][C]-0.061665[/C][C]-0.4272[/C][C]0.335562[/C][/ROW]
[ROW][C]27[/C][C]-0.095674[/C][C]-0.6628[/C][C]0.2553[/C][/ROW]
[ROW][C]28[/C][C]-0.161351[/C][C]-1.1179[/C][C]0.134593[/C][/ROW]
[ROW][C]29[/C][C]0.086678[/C][C]0.6005[/C][C]0.275491[/C][/ROW]
[ROW][C]30[/C][C]0.002139[/C][C]0.0148[/C][C]0.494119[/C][/ROW]
[ROW][C]31[/C][C]-0.003988[/C][C]-0.0276[/C][C]0.489036[/C][/ROW]
[ROW][C]32[/C][C]0.019123[/C][C]0.1325[/C][C]0.447576[/C][/ROW]
[ROW][C]33[/C][C]0.021397[/C][C]0.1482[/C][C]0.441385[/C][/ROW]
[ROW][C]34[/C][C]-0.040806[/C][C]-0.2827[/C][C]0.389307[/C][/ROW]
[ROW][C]35[/C][C]0.037369[/C][C]0.2589[/C][C]0.398411[/C][/ROW]
[ROW][C]36[/C][C]-0.110177[/C][C]-0.7633[/C][C]0.224501[/C][/ROW]
[ROW][C]37[/C][C]-0.022329[/C][C]-0.1547[/C][C]0.438853[/C][/ROW]
[ROW][C]38[/C][C]0.018878[/C][C]0.1308[/C][C]0.448245[/C][/ROW]
[ROW][C]39[/C][C]-0.067868[/C][C]-0.4702[/C][C]0.320168[/C][/ROW]
[ROW][C]40[/C][C]-0.042257[/C][C]-0.2928[/C][C]0.385481[/C][/ROW]
[ROW][C]41[/C][C]-0.039926[/C][C]-0.2766[/C][C]0.391632[/C][/ROW]
[ROW][C]42[/C][C]7.9e-05[/C][C]5e-04[/C][C]0.499783[/C][/ROW]
[ROW][C]43[/C][C]-0.034442[/C][C]-0.2386[/C][C]0.406207[/C][/ROW]
[ROW][C]44[/C][C]-0.060298[/C][C]-0.4178[/C][C]0.338993[/C][/ROW]
[ROW][C]45[/C][C]-0.015666[/C][C]-0.1085[/C][C]0.457012[/C][/ROW]
[ROW][C]46[/C][C]-0.058973[/C][C]-0.4086[/C][C]0.342335[/C][/ROW]
[ROW][C]47[/C][C]0.072692[/C][C]0.5036[/C][C]0.308413[/C][/ROW]
[ROW][C]48[/C][C]NA[/C][C]NA[/C][C]NA[/C][/ROW]
[/TABLE]
Source: https://freestatistics.org/blog/index.php?pk=105268&T=2

Globally Unique Identifier (entire table): ba.freestatistics.org/blog/index.php?pk=105268&T=2

As an alternative you can also use a QR Code:  

The GUIDs for individual cells are displayed in the table below:

Partial Autocorrelation Function
Time lag kPACF(k)T-STATP-value
10.1916751.3280.095235
20.2379141.64830.052909
30.2923832.02570.024188
40.0882120.61110.271993
5-0.098522-0.68260.249077
60.0746750.51740.30364
7-0.156815-1.08640.141355
8-0.066255-0.4590.324144
9-0.092127-0.63830.263165
10-0.115288-0.79870.214187
110.199341.38110.086827
12-0.227996-1.57960.060383
13-0.048874-0.33860.36819
140.0633550.43890.331338
150.0630140.43660.332188
160.0091570.06340.474838
17-0.078873-0.54640.293646
18-0.138058-0.95650.171808
19-0.079381-0.550.292446
20-0.038507-0.26680.395389
21-0.185903-1.2880.101965
22-0.094102-0.6520.258769
23-0.026586-0.18420.42732
240.0138330.09580.462023
250.1092970.75720.226306
26-0.061665-0.42720.335562
27-0.095674-0.66280.2553
28-0.161351-1.11790.134593
290.0866780.60050.275491
300.0021390.01480.494119
31-0.003988-0.02760.489036
320.0191230.13250.447576
330.0213970.14820.441385
34-0.040806-0.28270.389307
350.0373690.25890.398411
36-0.110177-0.76330.224501
37-0.022329-0.15470.438853
380.0188780.13080.448245
39-0.067868-0.47020.320168
40-0.042257-0.29280.385481
41-0.039926-0.27660.391632
427.9e-055e-040.499783
43-0.034442-0.23860.406207
44-0.060298-0.41780.338993
45-0.015666-0.10850.457012
46-0.058973-0.40860.342335
470.0726920.50360.308413
48NANANA


Parameters (Session):
par1 = 48 ; par2 = 1 ; par3 = 1 ; par4 = 1 ; par5 = 12 ; par6 = White Noise ; par7 = 0.95 ;
Parameters (R input):
par1 = 48 ; par2 = 1 ; par3 = 1 ; par4 = 1 ; par5 = 12 ; par6 = White Noise ; par7 = 0.95 ;
R code (references can be found in the software module):
if (par1 == 'Default') {
par1 = 10*log10(length(x))
} else {
par1 <- as.numeric(par1)
}
par2 <- as.numeric(par2)
par3 <- as.numeric(par3)
par4 <- as.numeric(par4)
par5 <- as.numeric(par5)
if (par6 == 'White Noise') par6 <- 'white' else par6 <- 'ma'
par7 <- as.numeric(par7)
if (par2 == 0) {
x <- log(x)
} else {
x <- (x ^ par2 - 1) / par2
}
if (par3 > 0) x <- diff(x,lag=1,difference=par3)
if (par4 > 0) x <- diff(x,lag=par5,difference=par4)
bitmap(file='pic1.png')
racf <- acf(x, par1, main='Autocorrelation', xlab='time lag', ylab='ACF', ci.type=par6, ci=par7, sub=paste('(lambda=',par2,', d=',par3,', D=',par4,', CI=', par7, ', CI type=',par6,')',sep=''))
dev.off()
bitmap(file='pic2.png')
rpacf <- pacf(x,par1,main='Partial Autocorrelation',xlab='lags',ylab='PACF')
dev.off()
(myacf <- c(racf$acf))
(mypacf <- c(rpacf$acf))
lengthx <- length(x)
sqrtn <- sqrt(lengthx)
load(file='createtable')
a<-table.start()
a<-table.row.start(a)
a<-table.element(a,'Autocorrelation Function',4,TRUE)
a<-table.row.end(a)
a<-table.row.start(a)
a<-table.element(a,'Time lag k',header=TRUE)
a<-table.element(a,hyperlink('basics.htm','ACF(k)','click here for more information about the Autocorrelation Function'),header=TRUE)
a<-table.element(a,'T-STAT',header=TRUE)
a<-table.element(a,'P-value',header=TRUE)
a<-table.row.end(a)
for (i in 2:(par1+1)) {
a<-table.row.start(a)
a<-table.element(a,i-1,header=TRUE)
a<-table.element(a,round(myacf[i],6))
mytstat <- myacf[i]*sqrtn
a<-table.element(a,round(mytstat,4))
a<-table.element(a,round(1-pt(abs(mytstat),lengthx),6))
a<-table.row.end(a)
}
a<-table.end(a)
table.save(a,file='mytable.tab')
a<-table.start()
a<-table.row.start(a)
a<-table.element(a,'Partial Autocorrelation Function',4,TRUE)
a<-table.row.end(a)
a<-table.row.start(a)
a<-table.element(a,'Time lag k',header=TRUE)
a<-table.element(a,hyperlink('basics.htm','PACF(k)','click here for more information about the Partial Autocorrelation Function'),header=TRUE)
a<-table.element(a,'T-STAT',header=TRUE)
a<-table.element(a,'P-value',header=TRUE)
a<-table.row.end(a)
for (i in 1:par1) {
a<-table.row.start(a)
a<-table.element(a,i,header=TRUE)
a<-table.element(a,round(mypacf[i],6))
mytstat <- mypacf[i]*sqrtn
a<-table.element(a,round(mytstat,4))
a<-table.element(a,round(1-pt(abs(mytstat),lengthx),6))
a<-table.row.end(a)
}
a<-table.end(a)
table.save(a,file='mytable1.tab')