| Multiple Linear Regression - Estimated Regression Equation |
| Y[t] = + 15832703.2737956 -5049990.48431708X[t] + 111445.020763520t + e[t] |
| Multiple Linear Regression - Ordinary Least Squares | |||||
| Variable | Parameter | S.D. | T-STAT H0: parameter = 0 | 2-tail p-value | 1-tail p-value |
| (Intercept) | 15832703.2737956 | 437948.932719 | 36.1519 | 0 | 0 |
| X | -5049990.48431708 | 687682.616591 | -7.3435 | 0 | 0 |
| t | 111445.020763520 | 19135.492057 | 5.824 | 0 | 0 |
| Multiple Linear Regression - Regression Statistics | |
| Multiple R | 0.69826695104146 |
| R-squared | 0.487576734916737 |
| Adjusted R-squared | 0.469596971229605 |
| F-TEST (value) | 27.1180836078336 |
| F-TEST (DF numerator) | 2 |
| F-TEST (DF denominator) | 57 |
| p-value | 5.3017826795454e-09 |
| Multiple Linear Regression - Residual Statistics | |
| Residual Standard Deviation | 1413308.63293638 |
| Sum Squared Residuals | 113854153640153 |
| Multiple Linear Regression - Actuals, Interpolation, and Residuals | |||
| Time or Index | Actuals | Interpolation Forecast | Residuals Prediction Error |
| 1 | 14731798.37 | 15944148.2945591 | -1212349.92455909 |
| 2 | 16471559.62 | 16055593.3153226 | 415966.304677383 |
| 3 | 15213975.95 | 16167038.3360861 | -953062.38608614 |
| 4 | 17637387.4 | 16278483.3568497 | 1358904.04315034 |
| 5 | 17972385.83 | 16389928.3776132 | 1582457.45238682 |
| 6 | 16896235.55 | 16501373.3983767 | 394862.151623307 |
| 7 | 16697955.94 | 16612818.4191402 | 85137.520859786 |
| 8 | 19691579.52 | 16724263.4399037 | 2967316.08009627 |
| 9 | 15930700.75 | 16835708.4606673 | -905007.710667253 |
| 10 | 17444615.98 | 16947153.4814308 | 497462.498569228 |
| 11 | 17699369.88 | 17058598.5021943 | 640771.377805706 |
| 12 | 15189796.81 | 17170043.5229578 | -1980246.71295781 |
| 13 | 15672722.75 | 17281488.5437213 | -1608765.79372133 |
| 14 | 17180794.3 | 17392933.5644849 | -212139.264484851 |
| 15 | 17664893.45 | 17504378.5852484 | 160514.864751628 |
| 16 | 17862884.98 | 17615823.6060119 | 247061.373988109 |
| 17 | 16162288.88 | 17727268.6267754 | -1564979.74677541 |
| 18 | 17463628.82 | 17838713.6475389 | -375084.82753893 |
| 19 | 16772112.17 | 17950158.6683025 | -1178046.49830245 |
| 20 | 19106861.48 | 18061603.6890660 | 1045257.79093403 |
| 21 | 16721314.25 | 18173048.7098295 | -1451734.45982949 |
| 22 | 18161267.85 | 18284493.730593 | -123225.880593008 |
| 23 | 18509941.2 | 18395938.7513565 | 114002.44864347 |
| 24 | 17802737.97 | 18507383.7721200 | -704645.80212005 |
| 25 | 16409869.75 | 18618828.7928836 | -2208959.04288357 |
| 26 | 17967742.04 | 18730273.8136471 | -762531.773647089 |
| 27 | 20286602.27 | 18841718.8344106 | 1444883.43558939 |
| 28 | 19537280.81 | 18953163.8551741 | 584116.954825871 |
| 29 | 18021889.62 | 19064608.8759376 | -1042719.25593765 |
| 30 | 20194317.23 | 19176053.8967012 | 1018263.33329883 |
| 31 | 19049596.62 | 19287498.9174647 | -237902.297464686 |
| 32 | 20244720.94 | 19398943.9382282 | 845777.001771794 |
| 33 | 21473302.24 | 19510388.9589917 | 1962913.28100827 |
| 34 | 19673603.19 | 19621833.9797552 | 51769.2102447548 |
| 35 | 21053177.29 | 19733279.0005188 | 1319898.28948123 |
| 36 | 20159479.84 | 19844724.0212823 | 314755.818717714 |
| 37 | 18203628.31 | 19956169.0420458 | -1752540.73204581 |
| 38 | 21289464.94 | 20067614.0628093 | 1221850.87719068 |
| 39 | 20432335.71 | 15129068.5992558 | 5303267.11074423 |
| 40 | 17180395.07 | 15240513.6200193 | 1939881.44998071 |
| 41 | 15816786.32 | 15351958.6407828 | 464827.679217191 |
| 42 | 15071819.75 | 15463403.6615463 | -391583.911546329 |
| 43 | 14521120.61 | 15574848.6823098 | -1053728.07230985 |
| 44 | 15668789.39 | 15686293.7030734 | -17504.3130733681 |
| 45 | 14346884.11 | 15797738.7238369 | -1450854.61383689 |
| 46 | 13881008.13 | 15909183.7446004 | -2028175.61460041 |
| 47 | 15465943.69 | 16020628.7653639 | -554685.075363928 |
| 48 | 14238232.92 | 16132073.7861274 | -1893840.86612745 |
| 49 | 13557713.21 | 16243518.8068910 | -2685805.59689097 |
| 50 | 16127590.29 | 16354963.8276545 | -227373.537654488 |
| 51 | 16793894.2 | 16466408.848418 | 327485.351581992 |
| 52 | 16014007.43 | 16577853.8691815 | -563846.439181527 |
| 53 | 16867867.15 | 16689298.8899450 | 178568.260054952 |
| 54 | 16014583.21 | 16800743.9107086 | -786160.700708565 |
| 55 | 15878594.85 | 16912188.9314721 | -1033594.08147209 |
| 56 | 18664899.14 | 17023633.9522356 | 1641265.18776439 |
| 57 | 17962530.06 | 17135078.9729991 | 827451.087000873 |
| 58 | 17332692.2 | 17246523.9937626 | 86168.2062373542 |
| 59 | 19542066.35 | 17357969.0145262 | 2184097.33547384 |
| 60 | 17203555.19 | 17469414.0352897 | -265858.845289683 |
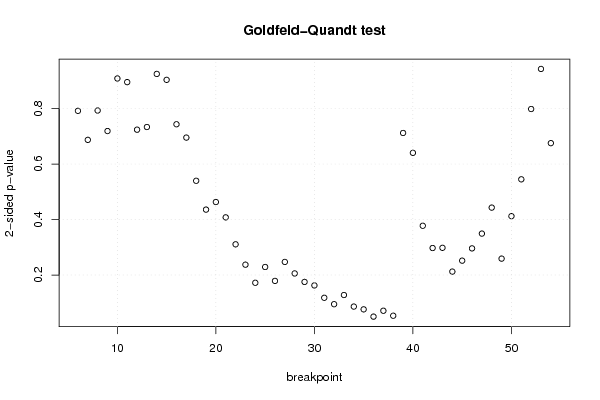
| Goldfeld-Quandt test for Heteroskedasticity | |||
| p-values | Alternative Hypothesis | ||
| breakpoint index | greater | 2-sided | less |
| 6 | 0.395952952820355 | 0.79190590564071 | 0.604047047179645 |
| 7 | 0.343639941753300 | 0.687279883506599 | 0.6563600582467 |
| 8 | 0.396535050270518 | 0.793070100541036 | 0.603464949729482 |
| 9 | 0.64045095906928 | 0.719098081861441 | 0.359549040930720 |
| 10 | 0.54568310679667 | 0.908633786406661 | 0.454316893203331 |
| 11 | 0.447748425164294 | 0.895496850328588 | 0.552251574835706 |
| 12 | 0.638000942284861 | 0.723998115430277 | 0.361999057715139 |
| 13 | 0.633184034369504 | 0.733631931260992 | 0.366815965630496 |
| 14 | 0.53749484680553 | 0.92501030638894 | 0.46250515319447 |
| 15 | 0.45186871925493 | 0.90373743850986 | 0.54813128074507 |
| 16 | 0.371761388510067 | 0.743522777020133 | 0.628238611489933 |
| 17 | 0.347718392972109 | 0.695436785944217 | 0.652281607027891 |
| 18 | 0.269865289664015 | 0.53973057932803 | 0.730134710335985 |
| 19 | 0.217895638688138 | 0.435791277376276 | 0.782104361311862 |
| 20 | 0.231587117575958 | 0.463174235151915 | 0.768412882424042 |
| 21 | 0.203949618849137 | 0.407899237698274 | 0.796050381150863 |
| 22 | 0.155344566909174 | 0.310689133818348 | 0.844655433090826 |
| 23 | 0.118622831454250 | 0.237245662908499 | 0.88137716854575 |
| 24 | 0.0859976480673072 | 0.171995296134614 | 0.914002351932693 |
| 25 | 0.114449600796436 | 0.228899201592872 | 0.885550399203564 |
| 26 | 0.0893406238846096 | 0.178681247769219 | 0.91065937611539 |
| 27 | 0.123560088673160 | 0.247120177346319 | 0.87643991132684 |
| 28 | 0.102819128340260 | 0.205638256680520 | 0.89718087165974 |
| 29 | 0.0875332915757036 | 0.175066583151407 | 0.912466708424296 |
| 30 | 0.081239533025637 | 0.162479066051274 | 0.918760466974363 |
| 31 | 0.0589228921471106 | 0.117845784294221 | 0.94107710785289 |
| 32 | 0.0473968438170745 | 0.094793687634149 | 0.952603156182926 |
| 33 | 0.0639366334797418 | 0.127873266959484 | 0.936063366520258 |
| 34 | 0.0431056863435291 | 0.0862113726870581 | 0.956894313656471 |
| 35 | 0.0380748359821163 | 0.0761496719642326 | 0.961925164017884 |
| 36 | 0.0249247257046326 | 0.0498494514092652 | 0.975075274295367 |
| 37 | 0.0355658696979820 | 0.0711317393959641 | 0.964434130302018 |
| 38 | 0.0265710969967705 | 0.053142193993541 | 0.973428903003229 |
| 39 | 0.356060240736597 | 0.712120481473193 | 0.643939759263403 |
| 40 | 0.679746320857043 | 0.640507358285913 | 0.320253679142957 |
| 41 | 0.81122583274558 | 0.377548334508840 | 0.188774167254420 |
| 42 | 0.851364771485272 | 0.297270457029455 | 0.148635228514728 |
| 43 | 0.850970498200076 | 0.298059003599848 | 0.149029501799924 |
| 44 | 0.893857909139186 | 0.212284181721628 | 0.106142090860814 |
| 45 | 0.874141209334459 | 0.251717581331083 | 0.125858790665541 |
| 46 | 0.85199828741185 | 0.296003425176298 | 0.148001712588149 |
| 47 | 0.82535330062374 | 0.349293398752519 | 0.174646699376260 |
| 48 | 0.778484414254024 | 0.443031171491953 | 0.221515585745976 |
| 49 | 0.870471206928291 | 0.259057586143418 | 0.129528793071709 |
| 50 | 0.793926304345994 | 0.412147391308012 | 0.206073695654006 |
| 51 | 0.727469051864264 | 0.545061896271471 | 0.272530948135736 |
| 52 | 0.600744404811698 | 0.798511190376605 | 0.399255595188302 |
| 53 | 0.471485429953469 | 0.942970859906938 | 0.528514570046531 |
| 54 | 0.337713650920769 | 0.675427301841539 | 0.662286349079231 |
| Meta Analysis of Goldfeld-Quandt test for Heteroskedasticity | |||
| Description | # significant tests | % significant tests | OK/NOK |
| 1% type I error level | 0 | 0 | OK |
| 5% type I error level | 1 | 0.0204081632653061 | OK |
| 10% type I error level | 6 | 0.122448979591837 | NOK |