| Multiple Linear Regression - Estimated Regression Equation |
| Y[t] = + 17654549.7169412 -1839472.92735294X[t] -1571508.65347059M1[t] + 520775.106529412M2[t] + 1159579.77M3[t] + 727630.592M4[t] + 49483.014M5[t] + 209356.366000001M6[t] -334884.508M7[t] + 1756609.548M8[t] + 368185.735999999M9[t] + 379876.924000001M10[t] + 1535339.136M11[t] + e[t] |
| Multiple Linear Regression - Ordinary Least Squares | |||||
| Variable | Parameter | S.D. | T-STAT H0: parameter = 0 | 2-tail p-value | 1-tail p-value |
| (Intercept) | 17654549.7169412 | 791300.81047 | 22.3108 | 0 | 0 |
| X | -1839472.92735294 | 466278.474202 | -3.945 | 0.000265 | 0.000132 |
| M1 | -1571508.65347059 | 1091529.923072 | -1.4397 | 0.156572 | 0.078286 |
| M2 | 520775.106529412 | 1091529.923072 | 0.4771 | 0.635498 | 0.317749 |
| M3 | 1159579.77 | 1087538.941069 | 1.0662 | 0.291761 | 0.14588 |
| M4 | 727630.592 | 1087538.941069 | 0.6691 | 0.506729 | 0.253365 |
| M5 | 49483.014 | 1087538.941069 | 0.0455 | 0.963902 | 0.481951 |
| M6 | 209356.366000001 | 1087538.941069 | 0.1925 | 0.848176 | 0.424088 |
| M7 | -334884.508 | 1087538.941069 | -0.3079 | 0.759497 | 0.379749 |
| M8 | 1756609.548 | 1087538.941069 | 1.6152 | 0.112958 | 0.056479 |
| M9 | 368185.735999999 | 1087538.941069 | 0.3385 | 0.736457 | 0.368228 |
| M10 | 379876.924000001 | 1087538.941069 | 0.3493 | 0.728425 | 0.364212 |
| M11 | 1535339.136 | 1087538.941069 | 1.4118 | 0.164608 | 0.082304 |
| Multiple Linear Regression - Regression Statistics | |
| Multiple R | 0.61198741386414 |
| R-squared | 0.374528594728118 |
| Adjusted R-squared | 0.214833767850191 |
| F-TEST (value) | 2.34527693883543 |
| F-TEST (DF numerator) | 12 |
| F-TEST (DF denominator) | 47 |
| p-value | 0.0187656331272622 |
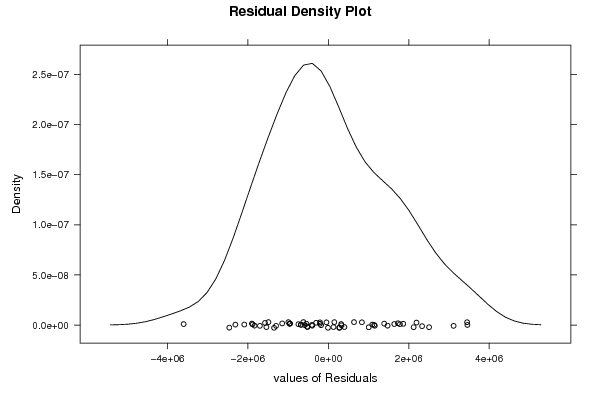
| Multiple Linear Regression - Residual Statistics | |
| Residual Standard Deviation | 1719550.04895249 |
| Sum Squared Residuals | 138972061430068 |
| Multiple Linear Regression - Actuals, Interpolation, and Residuals | |||
| Time or Index | Actuals | Interpolation Forecast | Residuals Prediction Error |
| 1 | 14731798.37 | 16083041.0634706 | -1351242.69347061 |
| 2 | 16471559.62 | 18175324.8234706 | -1703765.20347059 |
| 3 | 15213975.95 | 18814129.4869412 | -3600153.53694118 |
| 4 | 17637387.4 | 18382180.3089412 | -744792.908941177 |
| 5 | 17972385.83 | 17704032.7309412 | 268353.099058822 |
| 6 | 16896235.55 | 17863906.0829412 | -967670.532941176 |
| 7 | 16697955.94 | 17319665.2089412 | -621709.268941176 |
| 8 | 19691579.52 | 19411159.2649412 | 280420.255058822 |
| 9 | 15930700.75 | 18022735.4529412 | -2092034.70294118 |
| 10 | 17444615.98 | 18034426.6409412 | -589810.660941177 |
| 11 | 17699369.88 | 19189888.8529412 | -1490518.97294118 |
| 12 | 15189796.81 | 17654549.7169412 | -2464752.90694118 |
| 13 | 15672722.75 | 16083041.0634706 | -410318.313470583 |
| 14 | 17180794.3 | 18175324.8234706 | -994530.523470587 |
| 15 | 17664893.45 | 18814129.4869412 | -1149236.03694118 |
| 16 | 17862884.98 | 18382180.3089412 | -519295.328941175 |
| 17 | 16162288.88 | 17704032.7309412 | -1541743.85094118 |
| 18 | 17463628.82 | 17863906.0829412 | -400277.262941176 |
| 19 | 16772112.17 | 17319665.2089412 | -547553.038941176 |
| 20 | 19106861.48 | 19411159.2649412 | -304297.784941176 |
| 21 | 16721314.25 | 18022735.4529412 | -1301421.20294118 |
| 22 | 18161267.85 | 18034426.6409412 | 126841.209058824 |
| 23 | 18509941.2 | 19189888.8529412 | -679947.652941177 |
| 24 | 17802737.97 | 17654549.7169412 | 148188.253058822 |
| 25 | 16409869.75 | 16083041.0634706 | 326828.686529417 |
| 26 | 17967742.04 | 18175324.8234706 | -207582.783470589 |
| 27 | 20286602.27 | 18814129.4869412 | 1472472.78305882 |
| 28 | 19537280.81 | 18382180.3089412 | 1155100.50105882 |
| 29 | 18021889.62 | 17704032.7309412 | 317856.889058825 |
| 30 | 20194317.23 | 17863906.0829412 | 2330411.14705882 |
| 31 | 19049596.62 | 17319665.2089412 | 1729931.41105882 |
| 32 | 20244720.94 | 19411159.2649412 | 833561.675058825 |
| 33 | 21473302.24 | 18022735.4529412 | 3450566.78705882 |
| 34 | 19673603.19 | 18034426.6409412 | 1639176.54905882 |
| 35 | 21053177.29 | 19189888.8529412 | 1863288.43705882 |
| 36 | 20159479.84 | 17654549.7169412 | 2504930.12305882 |
| 37 | 18203628.31 | 16083041.0634706 | 2120587.24652941 |
| 38 | 21289464.94 | 18175324.8234706 | 3114140.11652941 |
| 39 | 20432335.71 | 16974656.5595882 | 3457679.15041176 |
| 40 | 17180395.07 | 16542707.3815882 | 637687.688411765 |
| 41 | 15816786.32 | 15864559.8035882 | -47773.4835882354 |
| 42 | 15071819.75 | 16024433.1555882 | -952613.405588236 |
| 43 | 14521120.61 | 15480192.2815882 | -959071.671588236 |
| 44 | 15668789.39 | 17571686.3375882 | -1902896.94758824 |
| 45 | 14346884.11 | 16183262.5255882 | -1836378.41558824 |
| 46 | 13881008.13 | 16194953.7135882 | -2313945.58358823 |
| 47 | 15465943.69 | 17350415.9255882 | -1884472.23558824 |
| 48 | 14238232.92 | 15815076.7895882 | -1576843.86958824 |
| 49 | 13557713.21 | 14243568.1361176 | -685854.926117641 |
| 50 | 16127590.29 | 16335851.8961176 | -208261.606117648 |
| 51 | 16793894.2 | 16974656.5595882 | -180762.359588236 |
| 52 | 16014007.43 | 16542707.3815882 | -528699.951588235 |
| 53 | 16867867.15 | 15864559.8035882 | 1003307.34641176 |
| 54 | 16014583.21 | 16024433.1555882 | -9849.94558823517 |
| 55 | 15878594.85 | 15480192.2815882 | 398402.568411764 |
| 56 | 18664899.14 | 17571686.3375882 | 1093212.80241176 |
| 57 | 17962530.06 | 16183262.5255882 | 1779267.53441176 |
| 58 | 17332692.2 | 16194953.7135882 | 1137738.48641176 |
| 59 | 19542066.35 | 17350415.9255882 | 2191650.42441177 |
| 60 | 17203555.19 | 15815076.7895882 | 1388478.40041177 |
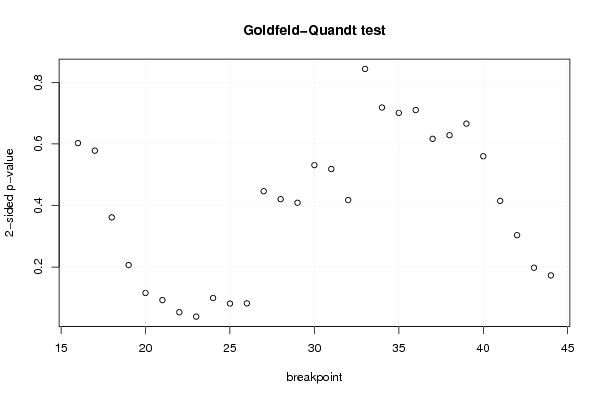
| Goldfeld-Quandt test for Heteroskedasticity | |||
| p-values | Alternative Hypothesis | ||
| breakpoint index | greater | 2-sided | less |
| 16 | 0.301331064069983 | 0.602662128139965 | 0.698668935930017 |
| 17 | 0.28902424451173 | 0.57804848902346 | 0.71097575548827 |
| 18 | 0.180771016615290 | 0.361542033230580 | 0.81922898338471 |
| 19 | 0.103325426111989 | 0.206650852223978 | 0.896674573888011 |
| 20 | 0.0580449651091736 | 0.116089930218347 | 0.941955034890826 |
| 21 | 0.0465192451673856 | 0.0930384903347712 | 0.953480754832614 |
| 22 | 0.0267803470574853 | 0.0535606941149707 | 0.973219652942515 |
| 23 | 0.0196407136732036 | 0.0392814273464072 | 0.980359286326796 |
| 24 | 0.0499196996722279 | 0.0998393993444557 | 0.950080300327772 |
| 25 | 0.0408439449637583 | 0.0816878899275165 | 0.959156055036242 |
| 26 | 0.0412322784614852 | 0.0824645569229704 | 0.958767721538515 |
| 27 | 0.223201854978901 | 0.446403709957801 | 0.7767981450211 |
| 28 | 0.210355786129538 | 0.420711572259077 | 0.789644213870462 |
| 29 | 0.204475249591487 | 0.408950499182973 | 0.795524750408513 |
| 30 | 0.265586603232438 | 0.531173206464875 | 0.734413396767562 |
| 31 | 0.259206771690627 | 0.518413543381253 | 0.740793228309373 |
| 32 | 0.208891909361914 | 0.417783818723828 | 0.791108090638086 |
| 33 | 0.421682335948256 | 0.843364671896512 | 0.578317664051744 |
| 34 | 0.359093527440682 | 0.718187054881363 | 0.640906472559318 |
| 35 | 0.350277704097373 | 0.700555408194747 | 0.649722295902627 |
| 36 | 0.354960308361630 | 0.709920616723259 | 0.64503969163837 |
| 37 | 0.308260247553751 | 0.616520495107501 | 0.69173975244625 |
| 38 | 0.314098943567352 | 0.628197887134704 | 0.685901056432648 |
| 39 | 0.332893834181616 | 0.665787668363233 | 0.667106165818384 |
| 40 | 0.280017416767602 | 0.560034833535204 | 0.719982583232398 |
| 41 | 0.207595726209381 | 0.415191452418762 | 0.792404273790619 |
| 42 | 0.151835552230888 | 0.303671104461776 | 0.848164447769112 |
| 43 | 0.0990481622854388 | 0.198096324570878 | 0.900951837714561 |
| 44 | 0.086598930068725 | 0.17319786013745 | 0.913401069931275 |
| Meta Analysis of Goldfeld-Quandt test for Heteroskedasticity | |||
| Description | # significant tests | % significant tests | OK/NOK |
| 1% type I error level | 0 | 0 | OK |
| 5% type I error level | 1 | 0.0344827586206897 | OK |
| 10% type I error level | 6 | 0.206896551724138 | NOK |