| Multiple Linear Regression - Estimated Regression Equation |
| uitvoer[t] = + 5955.77107260798 + 0.900208484398036invoer[t] -867.895942836455crisis[t] -0.0883075849666572`y-1t`[t] -0.138612433670325`y-2t`[t] + 47.9932567530819M1[t] + 12.2726899811716M2[t] + 442.313077321896M3[t] + 699.792225468448M4[t] + 886.719663826503M5[t] -701.240818544068M6[t] + 326.178227477193M7[t] + 336.934312118696M8[t] + 477.992501240360M9[t] -333.713518950042M10[t] -664.563611004632M11[t] -16.2181101813024t + e[t] |
| Multiple Linear Regression - Ordinary Least Squares | |||||
| Variable | Parameter | S.D. | T-STAT H0: parameter = 0 | 2-tail p-value | 1-tail p-value |
| (Intercept) | 5955.77107260798 | 846.151316 | 7.0387 | 0 | 0 |
| invoer | 0.900208484398036 | 0.060331 | 14.9211 | 0 | 0 |
| crisis | -867.895942836455 | 195.974054 | -4.4286 | 8.5e-05 | 4.2e-05 |
| `y-1t` | -0.0883075849666572 | 0.059826 | -1.4761 | 0.148615 | 0.074308 |
| `y-2t` | -0.138612433670325 | 0.061502 | -2.2538 | 0.030394 | 0.015197 |
| M1 | 47.9932567530819 | 278.291626 | 0.1725 | 0.864044 | 0.432022 |
| M2 | 12.2726899811716 | 275.367336 | 0.0446 | 0.964698 | 0.482349 |
| M3 | 442.313077321896 | 290.448953 | 1.5229 | 0.136531 | 0.068265 |
| M4 | 699.792225468448 | 264.841537 | 2.6423 | 0.012111 | 0.006055 |
| M5 | 886.719663826503 | 288.613652 | 3.0723 | 0.004032 | 0.002016 |
| M6 | -701.240818544068 | 326.830462 | -2.1456 | 0.038724 | 0.019362 |
| M7 | 326.178227477193 | 314.451323 | 1.0373 | 0.306517 | 0.153258 |
| M8 | 336.934312118696 | 342.157035 | 0.9847 | 0.331326 | 0.165663 |
| M9 | 477.992501240360 | 316.019554 | 1.5125 | 0.139126 | 0.069563 |
| M10 | -333.713518950042 | 324.548101 | -1.0282 | 0.310696 | 0.155348 |
| M11 | -664.563611004632 | 289.250609 | -2.2975 | 0.027508 | 0.013754 |
| t | -16.2181101813024 | 4.361496 | -3.7185 | 0.00068 | 0.00034 |
| Multiple Linear Regression - Regression Statistics | |
| Multiple R | 0.98801967954049 |
| R-squared | 0.976182887159291 |
| Adjusted R-squared | 0.965597503674532 |
| F-TEST (value) | 92.2198887328718 |
| F-TEST (DF numerator) | 16 |
| F-TEST (DF denominator) | 36 |
| p-value | 0 |
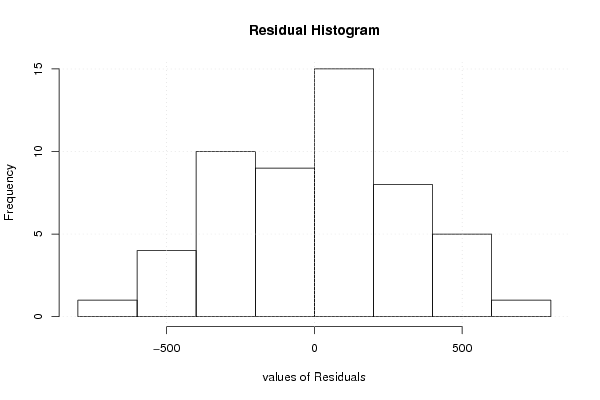
| Multiple Linear Regression - Residual Statistics | |
| Residual Standard Deviation | 380.234952554574 |
| Sum Squared Residuals | 5204830.28919044 |
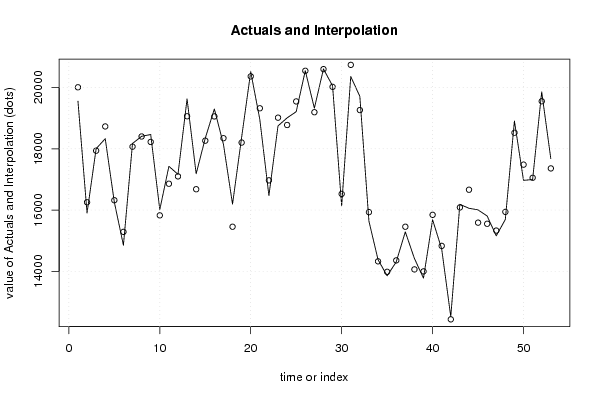
| Multiple Linear Regression - Actuals, Interpolation, and Residuals | |||
| Time or Index | Actuals | Interpolation Forecast | Residuals Prediction Error |
| 1 | 19554.2 | 20006.8612357149 | -452.661235714887 |
| 2 | 15903.8 | 16255.1567172060 | -351.356717206033 |
| 3 | 18003.8 | 17938.3253260470 | 65.4746739530497 |
| 4 | 18329.6 | 18729.504385277 | -399.904385276993 |
| 5 | 16260.7 | 16321.1937791186 | -60.4937791186145 |
| 6 | 14851.9 | 15289.2654953303 | -437.365495330281 |
| 7 | 18174.1 | 18069.2538362125 | 104.846163787522 |
| 8 | 18406.6 | 18401.4844757483 | 5.1155242517048 |
| 9 | 18466.5 | 18223.5360939552 | 242.963906044835 |
| 10 | 16016.5 | 15827.2003998483 | 189.299600151695 |
| 11 | 17428.5 | 16859.6241967510 | 568.875803248966 |
| 12 | 17167.2 | 17100.3856831325 | 66.8143168675023 |
| 13 | 19630 | 19061.3216146861 | 568.678385313898 |
| 14 | 17183.6 | 16680.5810860151 | 503.018913984892 |
| 15 | 18344.7 | 18265.3645549269 | 79.3354450731468 |
| 16 | 19301.4 | 19057.0057913796 | 244.394208620444 |
| 17 | 18147.5 | 18345.6609161178 | -198.160916117803 |
| 18 | 16192.9 | 15456.9595534970 | 735.940446503026 |
| 19 | 18374.4 | 18203.0561591202 | 171.343840879794 |
| 20 | 20515.2 | 20363.3764542983 | 151.823545701736 |
| 21 | 18957.2 | 19322.2584139307 | -365.058413930744 |
| 22 | 16471.5 | 16971.0000656789 | -499.50006567888 |
| 23 | 18746.8 | 19015.0091105593 | -268.209110559266 |
| 24 | 19009.5 | 18776.5086375919 | 232.991362408146 |
| 25 | 19211.2 | 19545.5396709669 | -334.339670966895 |
| 26 | 20547.7 | 20545.3720117321 | 2.32798826786109 |
| 27 | 19325.8 | 19193.1078643412 | 132.692135658825 |
| 28 | 20605.5 | 20598.9440478523 | 6.55595214767582 |
| 29 | 20056.9 | 20021.5003697425 | 35.3996302575103 |
| 30 | 16141.4 | 16527.6672123013 | -386.267212301292 |
| 31 | 20359.8 | 20738.6326401936 | -378.832640193638 |
| 32 | 19711.6 | 19263.8362266042 | 447.763773395803 |
| 33 | 15638.6 | 15933.8066215111 | -295.206621511076 |
| 34 | 14384.5 | 14327.8835748885 | 56.6164251114918 |
| 35 | 13855.6 | 13985.475036422 | -129.875036421998 |
| 36 | 14308.3 | 14358.6154596421 | -50.3154596421506 |
| 37 | 15290.6 | 15456.8951562114 | -166.295156211382 |
| 38 | 14423.8 | 14065.4764942971 | 358.323505702895 |
| 39 | 13779.7 | 14000.2776596302 | -220.577659630219 |
| 40 | 15686.3 | 15845.3072975004 | -159.007297500377 |
| 41 | 14733.8 | 14831.7436964113 | -97.9436964112903 |
| 42 | 12522.5 | 12434.8077388715 | 87.6922611285465 |
| 43 | 16189.4 | 16086.7573644737 | 102.642635526322 |
| 44 | 16059.1 | 16663.8028433492 | -604.702843349243 |
| 45 | 16007.1 | 15589.7988706030 | 417.301129396984 |
| 46 | 15806.8 | 15553.2159595843 | 253.584040415694 |
| 47 | 15160 | 15330.7916562677 | -170.791656267702 |
| 48 | 15692.1 | 15941.5902196335 | -249.490219633498 |
| 49 | 18908.9 | 18524.2823224207 | 384.617677579268 |
| 50 | 16969.9 | 17482.2136907496 | -512.313690749615 |
| 51 | 16997.5 | 17054.4245950548 | -56.924595054803 |
| 52 | 19858.9 | 19550.9384779908 | 307.961522009251 |
| 53 | 17681.2 | 17360.0012386098 | 321.198761390197 |
| Goldfeld-Quandt test for Heteroskedasticity | |||
| p-values | Alternative Hypothesis | ||
| breakpoint index | greater | 2-sided | less |
| 20 | 0.794176875529977 | 0.411646248940046 | 0.205823124470023 |
| 21 | 0.755399573385654 | 0.489200853228692 | 0.244600426614346 |
| 22 | 0.804104763825089 | 0.391790472349822 | 0.195895236174911 |
| 23 | 0.75066526745761 | 0.498669465084778 | 0.249334732542389 |
| 24 | 0.719601358831505 | 0.56079728233699 | 0.280398641168495 |
| 25 | 0.755940667016647 | 0.488118665966707 | 0.244059332983353 |
| 26 | 0.675324236071908 | 0.649351527856184 | 0.324675763928092 |
| 27 | 0.660683421727873 | 0.678633156544253 | 0.339316578272127 |
| 28 | 0.586501284779378 | 0.826997430441244 | 0.413498715220622 |
| 29 | 0.479844294973393 | 0.959688589946786 | 0.520155705026607 |
| 30 | 0.373334514281935 | 0.74666902856387 | 0.626665485718065 |
| 31 | 0.322947253826737 | 0.645894507653473 | 0.677052746173263 |
| 32 | 0.505678935217407 | 0.988642129565187 | 0.494321064782593 |
| 33 | 0.432018698394426 | 0.864037396788852 | 0.567981301605574 |
| Meta Analysis of Goldfeld-Quandt test for Heteroskedasticity | |||
| Description | # significant tests | % significant tests | OK/NOK |
| 1% type I error level | 0 | 0 | OK |
| 5% type I error level | 0 | 0 | OK |
| 10% type I error level | 0 | 0 | OK |