| Multiple Linear Regression - Estimated Regression Equation |
| Wealth[t] = -504114.977829084 + 662967.306012224Group[t] + 24.5611272824609Costs[t] -41.5957333099101Trades[t] + 5.32130251682934Dividends[t] + e[t] |
| Multiple Linear Regression - Ordinary Least Squares | |||||
| Variable | Parameter | S.D. | T-STAT H0: parameter = 0 | 2-tail p-value | 1-tail p-value |
| (Intercept) | -504114.977829084 | 268975.73522 | -1.8742 | 0.067552 | 0.033776 |
| Group | 662967.306012224 | 233076.812238 | 2.8444 | 0.006727 | 0.003364 |
| Costs | 24.5611272824609 | 6.190525 | 3.9675 | 0.000264 | 0.000132 |
| Trades | -41.5957333099101 | 789.29099 | -0.0527 | 0.958209 | 0.479105 |
| Dividends | 5.32130251682934 | 1.690371 | 3.148 | 0.00295 | 0.001475 |
| Multiple Linear Regression - Regression Statistics | |
| Multiple R | 0.76894626336554 |
| R-squared | 0.591278355943827 |
| Adjusted R-squared | 0.554121842847811 |
| F-TEST (value) | 15.9131820151130 |
| F-TEST (DF numerator) | 4 |
| F-TEST (DF denominator) | 44 |
| p-value | 3.96084618436987e-08 |
| Multiple Linear Regression - Residual Statistics | |
| Residual Standard Deviation | 792391.601716665 |
| Sum Squared Residuals | 27626915820728.5 |
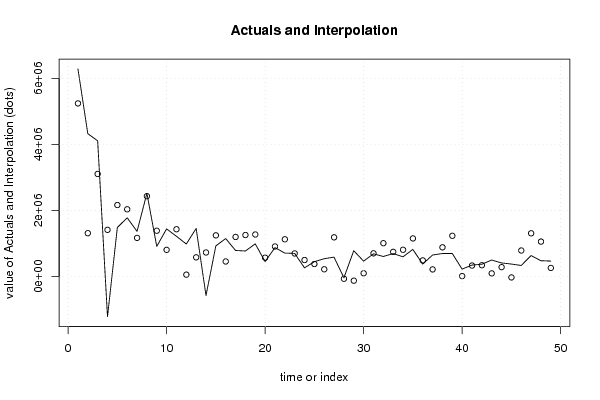
| Multiple Linear Regression - Actuals, Interpolation, and Residuals | |||
| Time or Index | Actuals | Interpolation Forecast | Residuals Prediction Error |
| 1 | 6282929 | 5240511.29678447 | 1042417.70321553 |
| 2 | 4324047 | 1312782.17122847 | 3011264.82877153 |
| 3 | 4108272 | 3105341.07887987 | 1002930.92112013 |
| 4 | -1212617 | 1414296.42009068 | -2626913.42009068 |
| 5 | 1485329 | 2164423.20527414 | -679094.205274138 |
| 6 | 1779876 | 2036085.74822804 | -256209.748228038 |
| 7 | 1367203 | 1169952.19869525 | 197250.801304752 |
| 8 | 2519076 | 2434179.61699384 | 84896.383006163 |
| 9 | 912684 | 1387765.89432226 | -475081.894322265 |
| 10 | 1443586 | 808504.783524156 | 635081.216475844 |
| 11 | 1220017 | 1432139.97834362 | -212122.978343617 |
| 12 | 984885 | 58248.9711792924 | 926636.028820708 |
| 13 | 1457425 | 582255.667484544 | 875169.332515456 |
| 14 | -572920 | 729125.220527678 | -1302045.22052768 |
| 15 | 929144 | 1247902.52918286 | -318758.529182862 |
| 16 | 1151176 | 457423.723576184 | 693752.276423816 |
| 17 | 790090 | 1199739.74314781 | -409649.743147815 |
| 18 | 774497 | 1257583.77805814 | -483086.778058139 |
| 19 | 990576 | 1273553.51330853 | -282977.513308526 |
| 20 | 454195 | 571763.749324438 | -117568.749324438 |
| 21 | 876607 | 911058.40629959 | -34451.4062995899 |
| 22 | 711969 | 1128453.52094796 | -416484.520947956 |
| 23 | 702380 | 699874.828595442 | 2505.17140455813 |
| 24 | 264449 | 500548.842538917 | -236099.842538917 |
| 25 | 450033 | 380234.819459443 | 69798.1805405567 |
| 26 | 541063 | 221579.483426094 | 319483.516573906 |
| 27 | 588864 | 1187573.35948637 | -598709.359486366 |
| 28 | -37216 | -65915.4176018545 | 28699.4176018545 |
| 29 | 783310 | -124038.622044060 | 907348.62204406 |
| 30 | 467359 | 100246.352931555 | 367112.647068445 |
| 31 | 688779 | 704244.134134435 | -15465.1341344350 |
| 32 | 608419 | 1010264.02817151 | -401845.028171514 |
| 33 | 696348 | 748354.122308335 | -52006.1223083347 |
| 34 | 597793 | 811265.176181658 | -213472.176181658 |
| 35 | 821730 | 1154772.94885707 | -333042.948857067 |
| 36 | 377934 | 489779.752529279 | -111845.752529279 |
| 37 | 651939 | 217087.58491888 | 434851.41508112 |
| 38 | 697458 | 885065.392149662 | -187607.392149662 |
| 39 | 700368 | 1234162.08534717 | -533794.085347173 |
| 40 | 225986 | 14454.0938063610 | 211531.906193639 |
| 41 | 348695 | 334000.380231905 | 14694.6197680950 |
| 42 | 373683 | 343506.211642966 | 30176.7883570342 |
| 43 | 501709 | 96820.1978022888 | 404888.802197711 |
| 44 | 413743 | 285587.325254383 | 128155.674745617 |
| 45 | 379825 | -25009.0554696691 | 404834.055469669 |
| 46 | 336260 | 789241.854339624 | -452981.854339624 |
| 47 | 636765 | 1309336.69349311 | -672571.693493115 |
| 48 | 481231 | 1058393.94387125 | -577162.94387125 |
| 49 | 469107 | 261538.268236057 | 207568.731763943 |
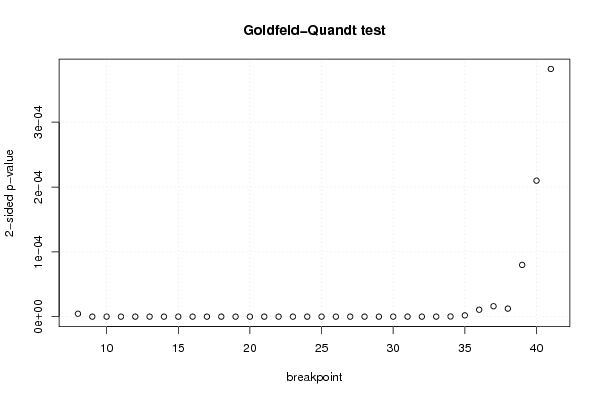
| Goldfeld-Quandt test for Heteroskedasticity | |||
| p-values | Alternative Hypothesis | ||
| breakpoint index | greater | 2-sided | less |
| 8 | 0.99999776552202 | 4.46895596018079e-06 | 2.23447798009039e-06 |
| 9 | 0.999999997104694 | 5.79061141253223e-09 | 2.89530570626611e-09 |
| 10 | 0.999999997833657 | 4.33268589712414e-09 | 2.16634294856207e-09 |
| 11 | 0.999999997810177 | 4.37964600785177e-09 | 2.18982300392588e-09 |
| 12 | 0.999999999852327 | 2.95345996691483e-10 | 1.47672998345741e-10 |
| 13 | 0.999999999983704 | 3.25922187753303e-11 | 1.62961093876652e-11 |
| 14 | 0.999999999999971 | 5.76174671813783e-14 | 2.88087335906892e-14 |
| 15 | 0.99999999999998 | 3.88583823724936e-14 | 1.94291911862468e-14 |
| 16 | 1 | 1.16482526544679e-15 | 5.82412632723397e-16 |
| 17 | 0.999999999999997 | 5.21714082293867e-15 | 2.60857041146933e-15 |
| 18 | 0.999999999999992 | 1.53111720049049e-14 | 7.65558600245243e-15 |
| 19 | 0.999999999999984 | 3.19786807605004e-14 | 1.59893403802502e-14 |
| 20 | 0.99999999999989 | 2.18734511392418e-13 | 1.09367255696209e-13 |
| 21 | 0.99999999999981 | 3.80806001867231e-13 | 1.90403000933615e-13 |
| 22 | 0.999999999999147 | 1.7057508495589e-12 | 8.5287542477945e-13 |
| 23 | 0.999999999996103 | 7.79313730849583e-12 | 3.89656865424791e-12 |
| 24 | 0.999999999985118 | 2.97633028648754e-11 | 1.48816514324377e-11 |
| 25 | 0.999999999914337 | 1.71325549419838e-10 | 8.5662774709919e-11 |
| 26 | 0.999999999631446 | 7.37107824852936e-10 | 3.68553912426468e-10 |
| 27 | 0.99999999843926 | 3.12148166031589e-09 | 1.56074083015795e-09 |
| 28 | 0.999999999640903 | 7.18194955130118e-10 | 3.59097477565059e-10 |
| 29 | 0.999999999921718 | 1.56563171009302e-10 | 7.82815855046509e-11 |
| 30 | 0.99999999964679 | 7.06419283817127e-10 | 3.53209641908564e-10 |
| 31 | 0.999999998491513 | 3.01697368991477e-09 | 1.50848684495739e-09 |
| 32 | 0.99999999014443 | 1.97111400926475e-08 | 9.85557004632377e-09 |
| 33 | 0.999999974618775 | 5.07624498408896e-08 | 2.53812249204448e-08 |
| 34 | 0.999999856353748 | 2.87292503126202e-07 | 1.43646251563101e-07 |
| 35 | 0.999999009858187 | 1.98028362498962e-06 | 9.9014181249481e-07 |
| 36 | 0.999994659329696 | 1.06813406085621e-05 | 5.34067030428106e-06 |
| 37 | 0.999991956191167 | 1.60876176657871e-05 | 8.04380883289354e-06 |
| 38 | 0.999993811715211 | 1.23765695774905e-05 | 6.18828478874526e-06 |
| 39 | 0.999960094048658 | 7.9811902684315e-05 | 3.99059513421575e-05 |
| 40 | 0.99989513382035 | 0.00020973235929899 | 0.000104866179649495 |
| 41 | 0.999808944851918 | 0.0003821102961638 | 0.0001910551480819 |
| Meta Analysis of Goldfeld-Quandt test for Heteroskedasticity | |||
| Description | # significant tests | % significant tests | OK/NOK |
| 1% type I error level | 34 | 1 | NOK |
| 5% type I error level | 34 | 1 | NOK |
| 10% type I error level | 34 | 1 | NOK |