Free Statistics

of Irreproducible Research!

Author's title

Author*The author of this computation has been verified*
R Software Modulerwasp_autocorrelation.wasp
Title produced by software(Partial) Autocorrelation Function
Date of computationFri, 03 Dec 2010 14:33:49 +0000
Cite this page as followsStatistical Computations at FreeStatistics.org, Office for Research Development and Education, URL https://freestatistics.org/blog/index.php?v=date/2010/Dec/03/t1291386742rg4pujix7xk6rco.htm/, Retrieved Wed, 08 May 2024 00:34:39 +0000
Statistical Computations at FreeStatistics.org, Office for Research Development and Education, URL https://freestatistics.org/blog/index.php?pk=104826, Retrieved Wed, 08 May 2024 00:34:39 +0000
QR Codes:

Original text written by user:
IsPrivate?No (this computation is public)
User-defined keywords
Estimated Impact132
Family? (F = Feedback message, R = changed R code, M = changed R Module, P = changed Parameters, D = changed Data)
-     [Univariate Data Series] [data set] [2008-12-01 19:54:57] [b98453cac15ba1066b407e146608df68]
- RMP   [(Partial) Autocorrelation Function] [Unemployment] [2010-11-29 09:05:21] [b98453cac15ba1066b407e146608df68]
-   PD    [(Partial) Autocorrelation Function] [Stationarity in t...] [2010-12-03 14:19:39] [aeb27d5c05332f2e597ad139ee63fbe4]
-   P         [(Partial) Autocorrelation Function] [Stationarity in t...] [2010-12-03 14:33:49] [18ef3d986e8801a4b28404e69e5bf56b] [Current]
-   P           [(Partial) Autocorrelation Function] [Stationarity in t...] [2010-12-03 14:41:54] [aeb27d5c05332f2e597ad139ee63fbe4]
Feedback Forum

Post a new message
Dataseries X:
44164
40399
36763
37903
35532
35533
32110
33374
35462
33508
36080
34560
38737
38144
37594
36424
36843
37246
38661
40454
44928
48441
48140
45998
47369
49554
47510
44873
45344
42413
36912
43452
42142
44382
43636
44167
44423
42868
43908
42013
38846
35087
33026
34646
37135
37985
43121
43722
43630
42234
39351
39327
35704
30466
28155
29257
29998
32529
34787
33855
34556
31348
30805
28353
24514
21106
21346
23335
24379
26290
30084
29429
30632
27349
27264
27474
24482
21453
18788
19282
19713
21917
23812
23785
24696
24562
23580
24939
23899
21454
19761
19815
20780
23462
25005
24725
26198
27543
26471
26558
25317
22896


Summary of computational transaction
Raw Inputview raw input (R code)
Raw Outputview raw output of R engine
Computing time1 seconds
R Server'Gwilym Jenkins' @ 72.249.127.135

\begin{tabular}{lllllllll}
\hline
Summary of computational transaction \tabularnewline
Raw Input & view raw input (R code)  \tabularnewline
Raw Output & view raw output of R engine  \tabularnewline
Computing time & 1 seconds \tabularnewline
R Server & 'Gwilym Jenkins' @ 72.249.127.135 \tabularnewline
\hline
\end{tabular}
%Source: https://freestatistics.org/blog/index.php?pk=104826&T=0

[TABLE]
[ROW][C]Summary of computational transaction[/C][/ROW]
[ROW][C]Raw Input[/C][C]view raw input (R code) [/C][/ROW]
[ROW][C]Raw Output[/C][C]view raw output of R engine [/C][/ROW]
[ROW][C]Computing time[/C][C]1 seconds[/C][/ROW]
[ROW][C]R Server[/C][C]'Gwilym Jenkins' @ 72.249.127.135[/C][/ROW]
[/TABLE]
Source: https://freestatistics.org/blog/index.php?pk=104826&T=0

Globally Unique Identifier (entire table): ba.freestatistics.org/blog/index.php?pk=104826&T=0

As an alternative you can also use a QR Code:  

The GUIDs for individual cells are displayed in the table below:

Summary of computational transaction
Raw Inputview raw input (R code)
Raw Outputview raw output of R engine
Computing time1 seconds
R Server'Gwilym Jenkins' @ 72.249.127.135


Autocorrelation Function
Time lag kACF(k)T-STATP-value
10.948359.57790
20.8911168.99980
30.8294648.37720
40.7654587.73070
50.7167367.23870
60.6796966.86460
70.6716326.78320
80.6756066.82330
90.6875486.94390
100.7040427.11050
110.7103967.17470
120.7005917.07560
130.655386.6190
140.5901155.95990
150.5218125.270
160.4518414.56347e-06
170.3990664.03045.4e-05
180.3644193.68050.000187
190.3462893.49730.000349
200.343073.46480.000389

\begin{tabular}{lllllllll}
\hline
Autocorrelation Function \tabularnewline
Time lag k & ACF(k) & T-STAT & P-value \tabularnewline
1 & 0.94835 & 9.5779 & 0 \tabularnewline
2 & 0.891116 & 8.9998 & 0 \tabularnewline
3 & 0.829464 & 8.3772 & 0 \tabularnewline
4 & 0.765458 & 7.7307 & 0 \tabularnewline
5 & 0.716736 & 7.2387 & 0 \tabularnewline
6 & 0.679696 & 6.8646 & 0 \tabularnewline
7 & 0.671632 & 6.7832 & 0 \tabularnewline
8 & 0.675606 & 6.8233 & 0 \tabularnewline
9 & 0.687548 & 6.9439 & 0 \tabularnewline
10 & 0.704042 & 7.1105 & 0 \tabularnewline
11 & 0.710396 & 7.1747 & 0 \tabularnewline
12 & 0.700591 & 7.0756 & 0 \tabularnewline
13 & 0.65538 & 6.619 & 0 \tabularnewline
14 & 0.590115 & 5.9599 & 0 \tabularnewline
15 & 0.521812 & 5.27 & 0 \tabularnewline
16 & 0.451841 & 4.5634 & 7e-06 \tabularnewline
17 & 0.399066 & 4.0304 & 5.4e-05 \tabularnewline
18 & 0.364419 & 3.6805 & 0.000187 \tabularnewline
19 & 0.346289 & 3.4973 & 0.000349 \tabularnewline
20 & 0.34307 & 3.4648 & 0.000389 \tabularnewline
\hline
\end{tabular}
%Source: https://freestatistics.org/blog/index.php?pk=104826&T=1

[TABLE]
[ROW][C]Autocorrelation Function[/C][/ROW]
[ROW][C]Time lag k[/C][C]ACF(k)[/C][C]T-STAT[/C][C]P-value[/C][/ROW]
[ROW][C]1[/C][C]0.94835[/C][C]9.5779[/C][C]0[/C][/ROW]
[ROW][C]2[/C][C]0.891116[/C][C]8.9998[/C][C]0[/C][/ROW]
[ROW][C]3[/C][C]0.829464[/C][C]8.3772[/C][C]0[/C][/ROW]
[ROW][C]4[/C][C]0.765458[/C][C]7.7307[/C][C]0[/C][/ROW]
[ROW][C]5[/C][C]0.716736[/C][C]7.2387[/C][C]0[/C][/ROW]
[ROW][C]6[/C][C]0.679696[/C][C]6.8646[/C][C]0[/C][/ROW]
[ROW][C]7[/C][C]0.671632[/C][C]6.7832[/C][C]0[/C][/ROW]
[ROW][C]8[/C][C]0.675606[/C][C]6.8233[/C][C]0[/C][/ROW]
[ROW][C]9[/C][C]0.687548[/C][C]6.9439[/C][C]0[/C][/ROW]
[ROW][C]10[/C][C]0.704042[/C][C]7.1105[/C][C]0[/C][/ROW]
[ROW][C]11[/C][C]0.710396[/C][C]7.1747[/C][C]0[/C][/ROW]
[ROW][C]12[/C][C]0.700591[/C][C]7.0756[/C][C]0[/C][/ROW]
[ROW][C]13[/C][C]0.65538[/C][C]6.619[/C][C]0[/C][/ROW]
[ROW][C]14[/C][C]0.590115[/C][C]5.9599[/C][C]0[/C][/ROW]
[ROW][C]15[/C][C]0.521812[/C][C]5.27[/C][C]0[/C][/ROW]
[ROW][C]16[/C][C]0.451841[/C][C]4.5634[/C][C]7e-06[/C][/ROW]
[ROW][C]17[/C][C]0.399066[/C][C]4.0304[/C][C]5.4e-05[/C][/ROW]
[ROW][C]18[/C][C]0.364419[/C][C]3.6805[/C][C]0.000187[/C][/ROW]
[ROW][C]19[/C][C]0.346289[/C][C]3.4973[/C][C]0.000349[/C][/ROW]
[ROW][C]20[/C][C]0.34307[/C][C]3.4648[/C][C]0.000389[/C][/ROW]
[/TABLE]
Source: https://freestatistics.org/blog/index.php?pk=104826&T=1

Globally Unique Identifier (entire table): ba.freestatistics.org/blog/index.php?pk=104826&T=1

As an alternative you can also use a QR Code:  

The GUIDs for individual cells are displayed in the table below:

Autocorrelation Function
Time lag kACF(k)T-STATP-value
10.948359.57790
20.8911168.99980
30.8294648.37720
40.7654587.73070
50.7167367.23870
60.6796966.86460
70.6716326.78320
80.6756066.82330
90.6875486.94390
100.7040427.11050
110.7103967.17470
120.7005917.07560
130.655386.6190
140.5901155.95990
150.5218125.270
160.4518414.56347e-06
170.3990664.03045.4e-05
180.3644193.68050.000187
190.3462893.49730.000349
200.343073.46480.000389


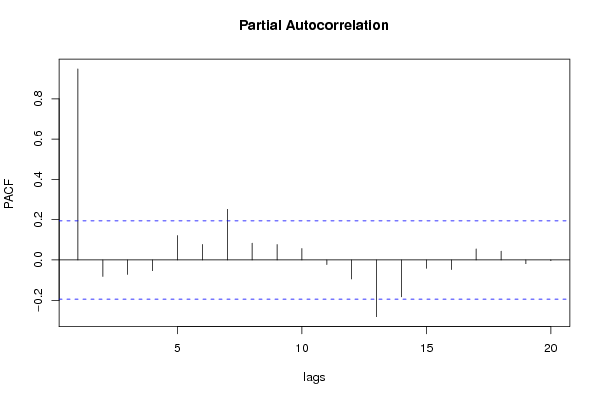
Partial Autocorrelation Function
Time lag kPACF(k)T-STATP-value
10.948359.57790
2-0.082003-0.82820.204747
3-0.071624-0.72340.235556
4-0.053213-0.53740.296074
50.1214551.22660.111392
60.0769510.77720.219429
70.2513252.53830.006326
80.0832320.84060.201268
90.0763510.77110.221213
100.0566860.57250.28412
11-0.0228-0.23030.409171
12-0.094063-0.950.17218
13-0.281325-2.84120.002713
14-0.182624-1.84440.034013
15-0.041416-0.41830.338311
16-0.047341-0.47810.316792
170.0549570.5550.290043
180.0438230.44260.329501
19-0.018621-0.18810.4256
20-0.00349-0.03520.485976

\begin{tabular}{lllllllll}
\hline
Partial Autocorrelation Function \tabularnewline
Time lag k & PACF(k) & T-STAT & P-value \tabularnewline
1 & 0.94835 & 9.5779 & 0 \tabularnewline
2 & -0.082003 & -0.8282 & 0.204747 \tabularnewline
3 & -0.071624 & -0.7234 & 0.235556 \tabularnewline
4 & -0.053213 & -0.5374 & 0.296074 \tabularnewline
5 & 0.121455 & 1.2266 & 0.111392 \tabularnewline
6 & 0.076951 & 0.7772 & 0.219429 \tabularnewline
7 & 0.251325 & 2.5383 & 0.006326 \tabularnewline
8 & 0.083232 & 0.8406 & 0.201268 \tabularnewline
9 & 0.076351 & 0.7711 & 0.221213 \tabularnewline
10 & 0.056686 & 0.5725 & 0.28412 \tabularnewline
11 & -0.0228 & -0.2303 & 0.409171 \tabularnewline
12 & -0.094063 & -0.95 & 0.17218 \tabularnewline
13 & -0.281325 & -2.8412 & 0.002713 \tabularnewline
14 & -0.182624 & -1.8444 & 0.034013 \tabularnewline
15 & -0.041416 & -0.4183 & 0.338311 \tabularnewline
16 & -0.047341 & -0.4781 & 0.316792 \tabularnewline
17 & 0.054957 & 0.555 & 0.290043 \tabularnewline
18 & 0.043823 & 0.4426 & 0.329501 \tabularnewline
19 & -0.018621 & -0.1881 & 0.4256 \tabularnewline
20 & -0.00349 & -0.0352 & 0.485976 \tabularnewline
\hline
\end{tabular}
%Source: https://freestatistics.org/blog/index.php?pk=104826&T=2

[TABLE]
[ROW][C]Partial Autocorrelation Function[/C][/ROW]
[ROW][C]Time lag k[/C][C]PACF(k)[/C][C]T-STAT[/C][C]P-value[/C][/ROW]
[ROW][C]1[/C][C]0.94835[/C][C]9.5779[/C][C]0[/C][/ROW]
[ROW][C]2[/C][C]-0.082003[/C][C]-0.8282[/C][C]0.204747[/C][/ROW]
[ROW][C]3[/C][C]-0.071624[/C][C]-0.7234[/C][C]0.235556[/C][/ROW]
[ROW][C]4[/C][C]-0.053213[/C][C]-0.5374[/C][C]0.296074[/C][/ROW]
[ROW][C]5[/C][C]0.121455[/C][C]1.2266[/C][C]0.111392[/C][/ROW]
[ROW][C]6[/C][C]0.076951[/C][C]0.7772[/C][C]0.219429[/C][/ROW]
[ROW][C]7[/C][C]0.251325[/C][C]2.5383[/C][C]0.006326[/C][/ROW]
[ROW][C]8[/C][C]0.083232[/C][C]0.8406[/C][C]0.201268[/C][/ROW]
[ROW][C]9[/C][C]0.076351[/C][C]0.7711[/C][C]0.221213[/C][/ROW]
[ROW][C]10[/C][C]0.056686[/C][C]0.5725[/C][C]0.28412[/C][/ROW]
[ROW][C]11[/C][C]-0.0228[/C][C]-0.2303[/C][C]0.409171[/C][/ROW]
[ROW][C]12[/C][C]-0.094063[/C][C]-0.95[/C][C]0.17218[/C][/ROW]
[ROW][C]13[/C][C]-0.281325[/C][C]-2.8412[/C][C]0.002713[/C][/ROW]
[ROW][C]14[/C][C]-0.182624[/C][C]-1.8444[/C][C]0.034013[/C][/ROW]
[ROW][C]15[/C][C]-0.041416[/C][C]-0.4183[/C][C]0.338311[/C][/ROW]
[ROW][C]16[/C][C]-0.047341[/C][C]-0.4781[/C][C]0.316792[/C][/ROW]
[ROW][C]17[/C][C]0.054957[/C][C]0.555[/C][C]0.290043[/C][/ROW]
[ROW][C]18[/C][C]0.043823[/C][C]0.4426[/C][C]0.329501[/C][/ROW]
[ROW][C]19[/C][C]-0.018621[/C][C]-0.1881[/C][C]0.4256[/C][/ROW]
[ROW][C]20[/C][C]-0.00349[/C][C]-0.0352[/C][C]0.485976[/C][/ROW]
[/TABLE]
Source: https://freestatistics.org/blog/index.php?pk=104826&T=2

Globally Unique Identifier (entire table): ba.freestatistics.org/blog/index.php?pk=104826&T=2

As an alternative you can also use a QR Code:  

The GUIDs for individual cells are displayed in the table below:

Partial Autocorrelation Function
Time lag kPACF(k)T-STATP-value
10.948359.57790
2-0.082003-0.82820.204747
3-0.071624-0.72340.235556
4-0.053213-0.53740.296074
50.1214551.22660.111392
60.0769510.77720.219429
70.2513252.53830.006326
80.0832320.84060.201268
90.0763510.77110.221213
100.0566860.57250.28412
11-0.0228-0.23030.409171
12-0.094063-0.950.17218
13-0.281325-2.84120.002713
14-0.182624-1.84440.034013
15-0.041416-0.41830.338311
16-0.047341-0.47810.316792
170.0549570.5550.290043
180.0438230.44260.329501
19-0.018621-0.18810.4256
20-0.00349-0.03520.485976


Parameters (Session):
par1 = Default ; par2 = 1 ; par3 = 0 ; par4 = 0 ; par5 = 12 ; par6 = White Noise ; par7 = 0.95 ;
Parameters (R input):
par1 = Default ; par2 = 1 ; par3 = 0 ; par4 = 0 ; par5 = 12 ; par6 = White Noise ; par7 = 0.95 ;
R code (references can be found in the software module):
if (par1 == 'Default') {
par1 = 10*log10(length(x))
} else {
par1 <- as.numeric(par1)
}
par2 <- as.numeric(par2)
par3 <- as.numeric(par3)
par4 <- as.numeric(par4)
par5 <- as.numeric(par5)
if (par6 == 'White Noise') par6 <- 'white' else par6 <- 'ma'
par7 <- as.numeric(par7)
if (par2 == 0) {
x <- log(x)
} else {
x <- (x ^ par2 - 1) / par2
}
if (par3 > 0) x <- diff(x,lag=1,difference=par3)
if (par4 > 0) x <- diff(x,lag=par5,difference=par4)
bitmap(file='pic1.png')
racf <- acf(x, par1, main='Autocorrelation', xlab='time lag', ylab='ACF', ci.type=par6, ci=par7, sub=paste('(lambda=',par2,', d=',par3,', D=',par4,', CI=', par7, ', CI type=',par6,')',sep=''))
dev.off()
bitmap(file='pic2.png')
rpacf <- pacf(x,par1,main='Partial Autocorrelation',xlab='lags',ylab='PACF')
dev.off()
(myacf <- c(racf$acf))
(mypacf <- c(rpacf$acf))
lengthx <- length(x)
sqrtn <- sqrt(lengthx)
load(file='createtable')
a<-table.start()
a<-table.row.start(a)
a<-table.element(a,'Autocorrelation Function',4,TRUE)
a<-table.row.end(a)
a<-table.row.start(a)
a<-table.element(a,'Time lag k',header=TRUE)
a<-table.element(a,hyperlink('basics.htm','ACF(k)','click here for more information about the Autocorrelation Function'),header=TRUE)
a<-table.element(a,'T-STAT',header=TRUE)
a<-table.element(a,'P-value',header=TRUE)
a<-table.row.end(a)
for (i in 2:(par1+1)) {
a<-table.row.start(a)
a<-table.element(a,i-1,header=TRUE)
a<-table.element(a,round(myacf[i],6))
mytstat <- myacf[i]*sqrtn
a<-table.element(a,round(mytstat,4))
a<-table.element(a,round(1-pt(abs(mytstat),lengthx),6))
a<-table.row.end(a)
}
a<-table.end(a)
table.save(a,file='mytable.tab')
a<-table.start()
a<-table.row.start(a)
a<-table.element(a,'Partial Autocorrelation Function',4,TRUE)
a<-table.row.end(a)
a<-table.row.start(a)
a<-table.element(a,'Time lag k',header=TRUE)
a<-table.element(a,hyperlink('basics.htm','PACF(k)','click here for more information about the Partial Autocorrelation Function'),header=TRUE)
a<-table.element(a,'T-STAT',header=TRUE)
a<-table.element(a,'P-value',header=TRUE)
a<-table.row.end(a)
for (i in 1:par1) {
a<-table.row.start(a)
a<-table.element(a,i,header=TRUE)
a<-table.element(a,round(mypacf[i],6))
mytstat <- mypacf[i]*sqrtn
a<-table.element(a,round(mytstat,4))
a<-table.element(a,round(1-pt(abs(mytstat),lengthx),6))
a<-table.row.end(a)
}
a<-table.end(a)
table.save(a,file='mytable1.tab')