Free Statistics

of Irreproducible Research!

Author's title

Author*The author of this computation has been verified*
R Software Modulerwasp_autocorrelation.wasp
Title produced by software(Partial) Autocorrelation Function
Date of computationFri, 03 Dec 2010 12:33:46 +0000
Cite this page as followsStatistical Computations at FreeStatistics.org, Office for Research Development and Education, URL https://freestatistics.org/blog/index.php?v=date/2010/Dec/03/t1291379566qene785su5wpnwq.htm/, Retrieved Wed, 08 May 2024 02:26:35 +0000
Statistical Computations at FreeStatistics.org, Office for Research Development and Education, URL https://freestatistics.org/blog/index.php?pk=104688, Retrieved Wed, 08 May 2024 02:26:35 +0000
QR Codes:

Original text written by user:
IsPrivate?No (this computation is public)
User-defined keywords
Estimated Impact152
Family? (F = Feedback message, R = changed R code, M = changed R Module, P = changed Parameters, D = changed Data)
-     [Univariate Data Series] [data set] [2008-12-01 19:54:57] [b98453cac15ba1066b407e146608df68]
- RMP   [(Partial) Autocorrelation Function] [Unemployment] [2010-11-29 09:05:21] [b98453cac15ba1066b407e146608df68]
-   PD      [(Partial) Autocorrelation Function] [ACF zonder seizoe...] [2010-12-03 12:33:46] [7b4029fa8534fd52dfa7d68267386cff] [Current]
Feedback Forum

Post a new message
Dataseries X:
62.027
56.493
65.566
62.653
53.470
59.600
42.542
42.018
44.038
44.988
43.309
26.843
69.770
64.886
79.354
63.025
54.003
55.926
45.629
40.361
43.039
44.570
43.269
25.563
68.707
60.223
74.283
61.232
61.531
65.305
51.699
44.599
35.221
55.066
45.335
28.702
69.517
69.240
71.525
77.740
62.107
65.450
51.493
43.067
49.172
54.483
38.158
27.898
58.648
56.000
62.381
59.849
48.345
55.376
45.400
38.389
44.098
48.290
41.267
31.238


Summary of computational transaction
Raw Inputview raw input (R code)
Raw Outputview raw output of R engine
Computing time1 seconds
R Server'George Udny Yule' @ 72.249.76.132

\begin{tabular}{lllllllll}
\hline
Summary of computational transaction \tabularnewline
Raw Input & view raw input (R code)  \tabularnewline
Raw Output & view raw output of R engine  \tabularnewline
Computing time & 1 seconds \tabularnewline
R Server & 'George Udny Yule' @ 72.249.76.132 \tabularnewline
\hline
\end{tabular}
%Source: https://freestatistics.org/blog/index.php?pk=104688&T=0

[TABLE]
[ROW][C]Summary of computational transaction[/C][/ROW]
[ROW][C]Raw Input[/C][C]view raw input (R code) [/C][/ROW]
[ROW][C]Raw Output[/C][C]view raw output of R engine [/C][/ROW]
[ROW][C]Computing time[/C][C]1 seconds[/C][/ROW]
[ROW][C]R Server[/C][C]'George Udny Yule' @ 72.249.76.132[/C][/ROW]
[/TABLE]
Source: https://freestatistics.org/blog/index.php?pk=104688&T=0

Globally Unique Identifier (entire table): ba.freestatistics.org/blog/index.php?pk=104688&T=0

As an alternative you can also use a QR Code:  

The GUIDs for individual cells are displayed in the table below:

Summary of computational transaction
Raw Inputview raw input (R code)
Raw Outputview raw output of R engine
Computing time1 seconds
R Server'George Udny Yule' @ 72.249.76.132


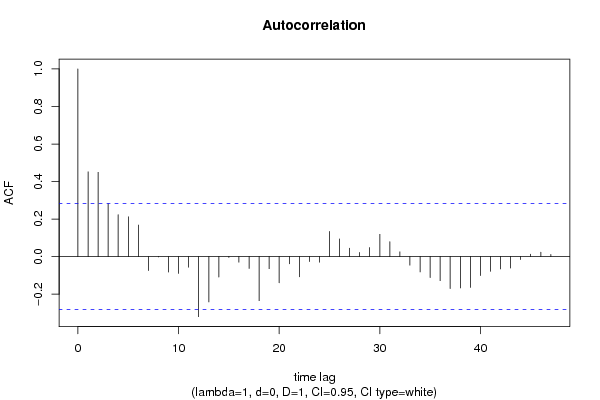
Autocorrelation Function
Time lag kACF(k)T-STATP-value
10.4521493.13260.001475
20.4495593.11460.001552
30.2817761.95220.02838
40.2237511.55020.063832
50.2119571.46850.074249
60.1680841.16450.124984
7-0.07462-0.5170.303772
8-0.001694-0.01170.495341
9-0.08244-0.57120.285278
10-0.089797-0.62210.268399
11-0.056428-0.39090.348784
12-0.319891-2.21630.015723
13-0.241563-1.67360.050358
14-0.108713-0.75320.227508
15-0.004293-0.02970.488199
16-0.02973-0.2060.418842
17-0.063121-0.43730.331923
18-0.234749-1.62640.055208
19-0.064146-0.44440.329368
20-0.139695-0.96780.168989
21-0.038597-0.26740.395152
22-0.107506-0.74480.230004
23-0.026425-0.18310.427754
24-0.02943-0.20390.419647
250.1341390.92930.178681
260.0941580.65230.258646
270.0446960.30970.379079
280.0223660.1550.438754
290.0482360.33420.369846
300.1187090.82240.207448
310.0798340.55310.29138
320.025690.1780.429743
33-0.045526-0.31540.376907
34-0.081882-0.56730.286579
35-0.111849-0.77490.221096
36-0.128399-0.88960.189065
37-0.170234-1.17940.122023
38-0.166765-1.15540.126827
39-0.164184-1.13750.130487
40-0.101062-0.70020.243598
41-0.078376-0.5430.29482
42-0.065464-0.45360.326098
43-0.06116-0.42370.336829
44-0.015532-0.10760.457377
450.0132350.09170.463662
460.0233570.16180.436064
470.0115780.08020.4682
48NANANA

\begin{tabular}{lllllllll}
\hline
Autocorrelation Function \tabularnewline
Time lag k & ACF(k) & T-STAT & P-value \tabularnewline
1 & 0.452149 & 3.1326 & 0.001475 \tabularnewline
2 & 0.449559 & 3.1146 & 0.001552 \tabularnewline
3 & 0.281776 & 1.9522 & 0.02838 \tabularnewline
4 & 0.223751 & 1.5502 & 0.063832 \tabularnewline
5 & 0.211957 & 1.4685 & 0.074249 \tabularnewline
6 & 0.168084 & 1.1645 & 0.124984 \tabularnewline
7 & -0.07462 & -0.517 & 0.303772 \tabularnewline
8 & -0.001694 & -0.0117 & 0.495341 \tabularnewline
9 & -0.08244 & -0.5712 & 0.285278 \tabularnewline
10 & -0.089797 & -0.6221 & 0.268399 \tabularnewline
11 & -0.056428 & -0.3909 & 0.348784 \tabularnewline
12 & -0.319891 & -2.2163 & 0.015723 \tabularnewline
13 & -0.241563 & -1.6736 & 0.050358 \tabularnewline
14 & -0.108713 & -0.7532 & 0.227508 \tabularnewline
15 & -0.004293 & -0.0297 & 0.488199 \tabularnewline
16 & -0.02973 & -0.206 & 0.418842 \tabularnewline
17 & -0.063121 & -0.4373 & 0.331923 \tabularnewline
18 & -0.234749 & -1.6264 & 0.055208 \tabularnewline
19 & -0.064146 & -0.4444 & 0.329368 \tabularnewline
20 & -0.139695 & -0.9678 & 0.168989 \tabularnewline
21 & -0.038597 & -0.2674 & 0.395152 \tabularnewline
22 & -0.107506 & -0.7448 & 0.230004 \tabularnewline
23 & -0.026425 & -0.1831 & 0.427754 \tabularnewline
24 & -0.02943 & -0.2039 & 0.419647 \tabularnewline
25 & 0.134139 & 0.9293 & 0.178681 \tabularnewline
26 & 0.094158 & 0.6523 & 0.258646 \tabularnewline
27 & 0.044696 & 0.3097 & 0.379079 \tabularnewline
28 & 0.022366 & 0.155 & 0.438754 \tabularnewline
29 & 0.048236 & 0.3342 & 0.369846 \tabularnewline
30 & 0.118709 & 0.8224 & 0.207448 \tabularnewline
31 & 0.079834 & 0.5531 & 0.29138 \tabularnewline
32 & 0.02569 & 0.178 & 0.429743 \tabularnewline
33 & -0.045526 & -0.3154 & 0.376907 \tabularnewline
34 & -0.081882 & -0.5673 & 0.286579 \tabularnewline
35 & -0.111849 & -0.7749 & 0.221096 \tabularnewline
36 & -0.128399 & -0.8896 & 0.189065 \tabularnewline
37 & -0.170234 & -1.1794 & 0.122023 \tabularnewline
38 & -0.166765 & -1.1554 & 0.126827 \tabularnewline
39 & -0.164184 & -1.1375 & 0.130487 \tabularnewline
40 & -0.101062 & -0.7002 & 0.243598 \tabularnewline
41 & -0.078376 & -0.543 & 0.29482 \tabularnewline
42 & -0.065464 & -0.4536 & 0.326098 \tabularnewline
43 & -0.06116 & -0.4237 & 0.336829 \tabularnewline
44 & -0.015532 & -0.1076 & 0.457377 \tabularnewline
45 & 0.013235 & 0.0917 & 0.463662 \tabularnewline
46 & 0.023357 & 0.1618 & 0.436064 \tabularnewline
47 & 0.011578 & 0.0802 & 0.4682 \tabularnewline
48 & NA & NA & NA \tabularnewline
\hline
\end{tabular}
%Source: https://freestatistics.org/blog/index.php?pk=104688&T=1

[TABLE]
[ROW][C]Autocorrelation Function[/C][/ROW]
[ROW][C]Time lag k[/C][C]ACF(k)[/C][C]T-STAT[/C][C]P-value[/C][/ROW]
[ROW][C]1[/C][C]0.452149[/C][C]3.1326[/C][C]0.001475[/C][/ROW]
[ROW][C]2[/C][C]0.449559[/C][C]3.1146[/C][C]0.001552[/C][/ROW]
[ROW][C]3[/C][C]0.281776[/C][C]1.9522[/C][C]0.02838[/C][/ROW]
[ROW][C]4[/C][C]0.223751[/C][C]1.5502[/C][C]0.063832[/C][/ROW]
[ROW][C]5[/C][C]0.211957[/C][C]1.4685[/C][C]0.074249[/C][/ROW]
[ROW][C]6[/C][C]0.168084[/C][C]1.1645[/C][C]0.124984[/C][/ROW]
[ROW][C]7[/C][C]-0.07462[/C][C]-0.517[/C][C]0.303772[/C][/ROW]
[ROW][C]8[/C][C]-0.001694[/C][C]-0.0117[/C][C]0.495341[/C][/ROW]
[ROW][C]9[/C][C]-0.08244[/C][C]-0.5712[/C][C]0.285278[/C][/ROW]
[ROW][C]10[/C][C]-0.089797[/C][C]-0.6221[/C][C]0.268399[/C][/ROW]
[ROW][C]11[/C][C]-0.056428[/C][C]-0.3909[/C][C]0.348784[/C][/ROW]
[ROW][C]12[/C][C]-0.319891[/C][C]-2.2163[/C][C]0.015723[/C][/ROW]
[ROW][C]13[/C][C]-0.241563[/C][C]-1.6736[/C][C]0.050358[/C][/ROW]
[ROW][C]14[/C][C]-0.108713[/C][C]-0.7532[/C][C]0.227508[/C][/ROW]
[ROW][C]15[/C][C]-0.004293[/C][C]-0.0297[/C][C]0.488199[/C][/ROW]
[ROW][C]16[/C][C]-0.02973[/C][C]-0.206[/C][C]0.418842[/C][/ROW]
[ROW][C]17[/C][C]-0.063121[/C][C]-0.4373[/C][C]0.331923[/C][/ROW]
[ROW][C]18[/C][C]-0.234749[/C][C]-1.6264[/C][C]0.055208[/C][/ROW]
[ROW][C]19[/C][C]-0.064146[/C][C]-0.4444[/C][C]0.329368[/C][/ROW]
[ROW][C]20[/C][C]-0.139695[/C][C]-0.9678[/C][C]0.168989[/C][/ROW]
[ROW][C]21[/C][C]-0.038597[/C][C]-0.2674[/C][C]0.395152[/C][/ROW]
[ROW][C]22[/C][C]-0.107506[/C][C]-0.7448[/C][C]0.230004[/C][/ROW]
[ROW][C]23[/C][C]-0.026425[/C][C]-0.1831[/C][C]0.427754[/C][/ROW]
[ROW][C]24[/C][C]-0.02943[/C][C]-0.2039[/C][C]0.419647[/C][/ROW]
[ROW][C]25[/C][C]0.134139[/C][C]0.9293[/C][C]0.178681[/C][/ROW]
[ROW][C]26[/C][C]0.094158[/C][C]0.6523[/C][C]0.258646[/C][/ROW]
[ROW][C]27[/C][C]0.044696[/C][C]0.3097[/C][C]0.379079[/C][/ROW]
[ROW][C]28[/C][C]0.022366[/C][C]0.155[/C][C]0.438754[/C][/ROW]
[ROW][C]29[/C][C]0.048236[/C][C]0.3342[/C][C]0.369846[/C][/ROW]
[ROW][C]30[/C][C]0.118709[/C][C]0.8224[/C][C]0.207448[/C][/ROW]
[ROW][C]31[/C][C]0.079834[/C][C]0.5531[/C][C]0.29138[/C][/ROW]
[ROW][C]32[/C][C]0.02569[/C][C]0.178[/C][C]0.429743[/C][/ROW]
[ROW][C]33[/C][C]-0.045526[/C][C]-0.3154[/C][C]0.376907[/C][/ROW]
[ROW][C]34[/C][C]-0.081882[/C][C]-0.5673[/C][C]0.286579[/C][/ROW]
[ROW][C]35[/C][C]-0.111849[/C][C]-0.7749[/C][C]0.221096[/C][/ROW]
[ROW][C]36[/C][C]-0.128399[/C][C]-0.8896[/C][C]0.189065[/C][/ROW]
[ROW][C]37[/C][C]-0.170234[/C][C]-1.1794[/C][C]0.122023[/C][/ROW]
[ROW][C]38[/C][C]-0.166765[/C][C]-1.1554[/C][C]0.126827[/C][/ROW]
[ROW][C]39[/C][C]-0.164184[/C][C]-1.1375[/C][C]0.130487[/C][/ROW]
[ROW][C]40[/C][C]-0.101062[/C][C]-0.7002[/C][C]0.243598[/C][/ROW]
[ROW][C]41[/C][C]-0.078376[/C][C]-0.543[/C][C]0.29482[/C][/ROW]
[ROW][C]42[/C][C]-0.065464[/C][C]-0.4536[/C][C]0.326098[/C][/ROW]
[ROW][C]43[/C][C]-0.06116[/C][C]-0.4237[/C][C]0.336829[/C][/ROW]
[ROW][C]44[/C][C]-0.015532[/C][C]-0.1076[/C][C]0.457377[/C][/ROW]
[ROW][C]45[/C][C]0.013235[/C][C]0.0917[/C][C]0.463662[/C][/ROW]
[ROW][C]46[/C][C]0.023357[/C][C]0.1618[/C][C]0.436064[/C][/ROW]
[ROW][C]47[/C][C]0.011578[/C][C]0.0802[/C][C]0.4682[/C][/ROW]
[ROW][C]48[/C][C]NA[/C][C]NA[/C][C]NA[/C][/ROW]
[/TABLE]
Source: https://freestatistics.org/blog/index.php?pk=104688&T=1

Globally Unique Identifier (entire table): ba.freestatistics.org/blog/index.php?pk=104688&T=1

As an alternative you can also use a QR Code:  

The GUIDs for individual cells are displayed in the table below:

Autocorrelation Function
Time lag kACF(k)T-STATP-value
10.4521493.13260.001475
20.4495593.11460.001552
30.2817761.95220.02838
40.2237511.55020.063832
50.2119571.46850.074249
60.1680841.16450.124984
7-0.07462-0.5170.303772
8-0.001694-0.01170.495341
9-0.08244-0.57120.285278
10-0.089797-0.62210.268399
11-0.056428-0.39090.348784
12-0.319891-2.21630.015723
13-0.241563-1.67360.050358
14-0.108713-0.75320.227508
15-0.004293-0.02970.488199
16-0.02973-0.2060.418842
17-0.063121-0.43730.331923
18-0.234749-1.62640.055208
19-0.064146-0.44440.329368
20-0.139695-0.96780.168989
21-0.038597-0.26740.395152
22-0.107506-0.74480.230004
23-0.026425-0.18310.427754
24-0.02943-0.20390.419647
250.1341390.92930.178681
260.0941580.65230.258646
270.0446960.30970.379079
280.0223660.1550.438754
290.0482360.33420.369846
300.1187090.82240.207448
310.0798340.55310.29138
320.025690.1780.429743
33-0.045526-0.31540.376907
34-0.081882-0.56730.286579
35-0.111849-0.77490.221096
36-0.128399-0.88960.189065
37-0.170234-1.17940.122023
38-0.166765-1.15540.126827
39-0.164184-1.13750.130487
40-0.101062-0.70020.243598
41-0.078376-0.5430.29482
42-0.065464-0.45360.326098
43-0.06116-0.42370.336829
44-0.015532-0.10760.457377
450.0132350.09170.463662
460.0233570.16180.436064
470.0115780.08020.4682
48NANANA


Partial Autocorrelation Function
Time lag kPACF(k)T-STATP-value
10.4521493.13260.001475
20.308112.13460.018962
30.0025360.01760.493029
4-0.004837-0.03350.486704
50.0770620.53390.297936
60.0231130.16010.436725
7-0.307185-2.12820.019239
80.0330740.22910.409865
90.0271260.18790.425861
10-0.074812-0.51830.30331
110.0249780.17310.43167
12-0.323708-2.24270.014785
130.0006780.00470.498136
140.2512761.74090.044055
150.2107311.460.075404
16-0.157215-1.08920.140748
17-0.15507-1.07440.144017
18-0.173177-1.19980.118052
190.0206020.14270.443549
20-0.062048-0.42990.334603
210.0866790.60050.27549
22-0.003507-0.02430.490359
230.1810451.25430.107901
24-0.059894-0.4150.340011
25-0.038662-0.26790.394979
260.1170990.81130.210602
270.0283540.19640.422546
28-0.009174-0.06360.474792
29-0.094346-0.65360.25823
30-0.103321-0.71580.238782
31-0.100877-0.69890.243994
32-0.020349-0.1410.444237
330.066230.45890.324205
34-0.109832-0.76090.225207
350.0245650.17020.432788
36-0.098776-0.68430.248526
370.0018330.01270.494961
380.0353880.24520.403684
390.0033720.02340.490729
40-0.077711-0.53840.296396
410.0257690.17850.429528
420.0202770.14050.444432
430.0246570.17080.432539
44-0.007008-0.04850.48074
450.0387880.26870.394645
46-0.090011-0.62360.267917
47-0.054275-0.3760.354277
48NANANA

\begin{tabular}{lllllllll}
\hline
Partial Autocorrelation Function \tabularnewline
Time lag k & PACF(k) & T-STAT & P-value \tabularnewline
1 & 0.452149 & 3.1326 & 0.001475 \tabularnewline
2 & 0.30811 & 2.1346 & 0.018962 \tabularnewline
3 & 0.002536 & 0.0176 & 0.493029 \tabularnewline
4 & -0.004837 & -0.0335 & 0.486704 \tabularnewline
5 & 0.077062 & 0.5339 & 0.297936 \tabularnewline
6 & 0.023113 & 0.1601 & 0.436725 \tabularnewline
7 & -0.307185 & -2.1282 & 0.019239 \tabularnewline
8 & 0.033074 & 0.2291 & 0.409865 \tabularnewline
9 & 0.027126 & 0.1879 & 0.425861 \tabularnewline
10 & -0.074812 & -0.5183 & 0.30331 \tabularnewline
11 & 0.024978 & 0.1731 & 0.43167 \tabularnewline
12 & -0.323708 & -2.2427 & 0.014785 \tabularnewline
13 & 0.000678 & 0.0047 & 0.498136 \tabularnewline
14 & 0.251276 & 1.7409 & 0.044055 \tabularnewline
15 & 0.210731 & 1.46 & 0.075404 \tabularnewline
16 & -0.157215 & -1.0892 & 0.140748 \tabularnewline
17 & -0.15507 & -1.0744 & 0.144017 \tabularnewline
18 & -0.173177 & -1.1998 & 0.118052 \tabularnewline
19 & 0.020602 & 0.1427 & 0.443549 \tabularnewline
20 & -0.062048 & -0.4299 & 0.334603 \tabularnewline
21 & 0.086679 & 0.6005 & 0.27549 \tabularnewline
22 & -0.003507 & -0.0243 & 0.490359 \tabularnewline
23 & 0.181045 & 1.2543 & 0.107901 \tabularnewline
24 & -0.059894 & -0.415 & 0.340011 \tabularnewline
25 & -0.038662 & -0.2679 & 0.394979 \tabularnewline
26 & 0.117099 & 0.8113 & 0.210602 \tabularnewline
27 & 0.028354 & 0.1964 & 0.422546 \tabularnewline
28 & -0.009174 & -0.0636 & 0.474792 \tabularnewline
29 & -0.094346 & -0.6536 & 0.25823 \tabularnewline
30 & -0.103321 & -0.7158 & 0.238782 \tabularnewline
31 & -0.100877 & -0.6989 & 0.243994 \tabularnewline
32 & -0.020349 & -0.141 & 0.444237 \tabularnewline
33 & 0.06623 & 0.4589 & 0.324205 \tabularnewline
34 & -0.109832 & -0.7609 & 0.225207 \tabularnewline
35 & 0.024565 & 0.1702 & 0.432788 \tabularnewline
36 & -0.098776 & -0.6843 & 0.248526 \tabularnewline
37 & 0.001833 & 0.0127 & 0.494961 \tabularnewline
38 & 0.035388 & 0.2452 & 0.403684 \tabularnewline
39 & 0.003372 & 0.0234 & 0.490729 \tabularnewline
40 & -0.077711 & -0.5384 & 0.296396 \tabularnewline
41 & 0.025769 & 0.1785 & 0.429528 \tabularnewline
42 & 0.020277 & 0.1405 & 0.444432 \tabularnewline
43 & 0.024657 & 0.1708 & 0.432539 \tabularnewline
44 & -0.007008 & -0.0485 & 0.48074 \tabularnewline
45 & 0.038788 & 0.2687 & 0.394645 \tabularnewline
46 & -0.090011 & -0.6236 & 0.267917 \tabularnewline
47 & -0.054275 & -0.376 & 0.354277 \tabularnewline
48 & NA & NA & NA \tabularnewline
\hline
\end{tabular}
%Source: https://freestatistics.org/blog/index.php?pk=104688&T=2

[TABLE]
[ROW][C]Partial Autocorrelation Function[/C][/ROW]
[ROW][C]Time lag k[/C][C]PACF(k)[/C][C]T-STAT[/C][C]P-value[/C][/ROW]
[ROW][C]1[/C][C]0.452149[/C][C]3.1326[/C][C]0.001475[/C][/ROW]
[ROW][C]2[/C][C]0.30811[/C][C]2.1346[/C][C]0.018962[/C][/ROW]
[ROW][C]3[/C][C]0.002536[/C][C]0.0176[/C][C]0.493029[/C][/ROW]
[ROW][C]4[/C][C]-0.004837[/C][C]-0.0335[/C][C]0.486704[/C][/ROW]
[ROW][C]5[/C][C]0.077062[/C][C]0.5339[/C][C]0.297936[/C][/ROW]
[ROW][C]6[/C][C]0.023113[/C][C]0.1601[/C][C]0.436725[/C][/ROW]
[ROW][C]7[/C][C]-0.307185[/C][C]-2.1282[/C][C]0.019239[/C][/ROW]
[ROW][C]8[/C][C]0.033074[/C][C]0.2291[/C][C]0.409865[/C][/ROW]
[ROW][C]9[/C][C]0.027126[/C][C]0.1879[/C][C]0.425861[/C][/ROW]
[ROW][C]10[/C][C]-0.074812[/C][C]-0.5183[/C][C]0.30331[/C][/ROW]
[ROW][C]11[/C][C]0.024978[/C][C]0.1731[/C][C]0.43167[/C][/ROW]
[ROW][C]12[/C][C]-0.323708[/C][C]-2.2427[/C][C]0.014785[/C][/ROW]
[ROW][C]13[/C][C]0.000678[/C][C]0.0047[/C][C]0.498136[/C][/ROW]
[ROW][C]14[/C][C]0.251276[/C][C]1.7409[/C][C]0.044055[/C][/ROW]
[ROW][C]15[/C][C]0.210731[/C][C]1.46[/C][C]0.075404[/C][/ROW]
[ROW][C]16[/C][C]-0.157215[/C][C]-1.0892[/C][C]0.140748[/C][/ROW]
[ROW][C]17[/C][C]-0.15507[/C][C]-1.0744[/C][C]0.144017[/C][/ROW]
[ROW][C]18[/C][C]-0.173177[/C][C]-1.1998[/C][C]0.118052[/C][/ROW]
[ROW][C]19[/C][C]0.020602[/C][C]0.1427[/C][C]0.443549[/C][/ROW]
[ROW][C]20[/C][C]-0.062048[/C][C]-0.4299[/C][C]0.334603[/C][/ROW]
[ROW][C]21[/C][C]0.086679[/C][C]0.6005[/C][C]0.27549[/C][/ROW]
[ROW][C]22[/C][C]-0.003507[/C][C]-0.0243[/C][C]0.490359[/C][/ROW]
[ROW][C]23[/C][C]0.181045[/C][C]1.2543[/C][C]0.107901[/C][/ROW]
[ROW][C]24[/C][C]-0.059894[/C][C]-0.415[/C][C]0.340011[/C][/ROW]
[ROW][C]25[/C][C]-0.038662[/C][C]-0.2679[/C][C]0.394979[/C][/ROW]
[ROW][C]26[/C][C]0.117099[/C][C]0.8113[/C][C]0.210602[/C][/ROW]
[ROW][C]27[/C][C]0.028354[/C][C]0.1964[/C][C]0.422546[/C][/ROW]
[ROW][C]28[/C][C]-0.009174[/C][C]-0.0636[/C][C]0.474792[/C][/ROW]
[ROW][C]29[/C][C]-0.094346[/C][C]-0.6536[/C][C]0.25823[/C][/ROW]
[ROW][C]30[/C][C]-0.103321[/C][C]-0.7158[/C][C]0.238782[/C][/ROW]
[ROW][C]31[/C][C]-0.100877[/C][C]-0.6989[/C][C]0.243994[/C][/ROW]
[ROW][C]32[/C][C]-0.020349[/C][C]-0.141[/C][C]0.444237[/C][/ROW]
[ROW][C]33[/C][C]0.06623[/C][C]0.4589[/C][C]0.324205[/C][/ROW]
[ROW][C]34[/C][C]-0.109832[/C][C]-0.7609[/C][C]0.225207[/C][/ROW]
[ROW][C]35[/C][C]0.024565[/C][C]0.1702[/C][C]0.432788[/C][/ROW]
[ROW][C]36[/C][C]-0.098776[/C][C]-0.6843[/C][C]0.248526[/C][/ROW]
[ROW][C]37[/C][C]0.001833[/C][C]0.0127[/C][C]0.494961[/C][/ROW]
[ROW][C]38[/C][C]0.035388[/C][C]0.2452[/C][C]0.403684[/C][/ROW]
[ROW][C]39[/C][C]0.003372[/C][C]0.0234[/C][C]0.490729[/C][/ROW]
[ROW][C]40[/C][C]-0.077711[/C][C]-0.5384[/C][C]0.296396[/C][/ROW]
[ROW][C]41[/C][C]0.025769[/C][C]0.1785[/C][C]0.429528[/C][/ROW]
[ROW][C]42[/C][C]0.020277[/C][C]0.1405[/C][C]0.444432[/C][/ROW]
[ROW][C]43[/C][C]0.024657[/C][C]0.1708[/C][C]0.432539[/C][/ROW]
[ROW][C]44[/C][C]-0.007008[/C][C]-0.0485[/C][C]0.48074[/C][/ROW]
[ROW][C]45[/C][C]0.038788[/C][C]0.2687[/C][C]0.394645[/C][/ROW]
[ROW][C]46[/C][C]-0.090011[/C][C]-0.6236[/C][C]0.267917[/C][/ROW]
[ROW][C]47[/C][C]-0.054275[/C][C]-0.376[/C][C]0.354277[/C][/ROW]
[ROW][C]48[/C][C]NA[/C][C]NA[/C][C]NA[/C][/ROW]
[/TABLE]
Source: https://freestatistics.org/blog/index.php?pk=104688&T=2

Globally Unique Identifier (entire table): ba.freestatistics.org/blog/index.php?pk=104688&T=2

As an alternative you can also use a QR Code:  

The GUIDs for individual cells are displayed in the table below:

Partial Autocorrelation Function
Time lag kPACF(k)T-STATP-value
10.4521493.13260.001475
20.308112.13460.018962
30.0025360.01760.493029
4-0.004837-0.03350.486704
50.0770620.53390.297936
60.0231130.16010.436725
7-0.307185-2.12820.019239
80.0330740.22910.409865
90.0271260.18790.425861
10-0.074812-0.51830.30331
110.0249780.17310.43167
12-0.323708-2.24270.014785
130.0006780.00470.498136
140.2512761.74090.044055
150.2107311.460.075404
16-0.157215-1.08920.140748
17-0.15507-1.07440.144017
18-0.173177-1.19980.118052
190.0206020.14270.443549
20-0.062048-0.42990.334603
210.0866790.60050.27549
22-0.003507-0.02430.490359
230.1810451.25430.107901
24-0.059894-0.4150.340011
25-0.038662-0.26790.394979
260.1170990.81130.210602
270.0283540.19640.422546
28-0.009174-0.06360.474792
29-0.094346-0.65360.25823
30-0.103321-0.71580.238782
31-0.100877-0.69890.243994
32-0.020349-0.1410.444237
330.066230.45890.324205
34-0.109832-0.76090.225207
350.0245650.17020.432788
36-0.098776-0.68430.248526
370.0018330.01270.494961
380.0353880.24520.403684
390.0033720.02340.490729
40-0.077711-0.53840.296396
410.0257690.17850.429528
420.0202770.14050.444432
430.0246570.17080.432539
44-0.007008-0.04850.48074
450.0387880.26870.394645
46-0.090011-0.62360.267917
47-0.054275-0.3760.354277
48NANANA


Parameters (Session):
par1 = 48 ; par2 = 1 ; par3 = 0 ; par4 = 1 ; par5 = 12 ; par6 = White Noise ; par7 = 0.95 ;
Parameters (R input):
par1 = 48 ; par2 = 1 ; par3 = 0 ; par4 = 1 ; par5 = 12 ; par6 = White Noise ; par7 = 0.95 ;
R code (references can be found in the software module):
if (par1 == 'Default') {
par1 = 10*log10(length(x))
} else {
par1 <- as.numeric(par1)
}
par2 <- as.numeric(par2)
par3 <- as.numeric(par3)
par4 <- as.numeric(par4)
par5 <- as.numeric(par5)
if (par6 == 'White Noise') par6 <- 'white' else par6 <- 'ma'
par7 <- as.numeric(par7)
if (par2 == 0) {
x <- log(x)
} else {
x <- (x ^ par2 - 1) / par2
}
if (par3 > 0) x <- diff(x,lag=1,difference=par3)
if (par4 > 0) x <- diff(x,lag=par5,difference=par4)
bitmap(file='pic1.png')
racf <- acf(x, par1, main='Autocorrelation', xlab='time lag', ylab='ACF', ci.type=par6, ci=par7, sub=paste('(lambda=',par2,', d=',par3,', D=',par4,', CI=', par7, ', CI type=',par6,')',sep=''))
dev.off()
bitmap(file='pic2.png')
rpacf <- pacf(x,par1,main='Partial Autocorrelation',xlab='lags',ylab='PACF')
dev.off()
(myacf <- c(racf$acf))
(mypacf <- c(rpacf$acf))
lengthx <- length(x)
sqrtn <- sqrt(lengthx)
load(file='createtable')
a<-table.start()
a<-table.row.start(a)
a<-table.element(a,'Autocorrelation Function',4,TRUE)
a<-table.row.end(a)
a<-table.row.start(a)
a<-table.element(a,'Time lag k',header=TRUE)
a<-table.element(a,hyperlink('basics.htm','ACF(k)','click here for more information about the Autocorrelation Function'),header=TRUE)
a<-table.element(a,'T-STAT',header=TRUE)
a<-table.element(a,'P-value',header=TRUE)
a<-table.row.end(a)
for (i in 2:(par1+1)) {
a<-table.row.start(a)
a<-table.element(a,i-1,header=TRUE)
a<-table.element(a,round(myacf[i],6))
mytstat <- myacf[i]*sqrtn
a<-table.element(a,round(mytstat,4))
a<-table.element(a,round(1-pt(abs(mytstat),lengthx),6))
a<-table.row.end(a)
}
a<-table.end(a)
table.save(a,file='mytable.tab')
a<-table.start()
a<-table.row.start(a)
a<-table.element(a,'Partial Autocorrelation Function',4,TRUE)
a<-table.row.end(a)
a<-table.row.start(a)
a<-table.element(a,'Time lag k',header=TRUE)
a<-table.element(a,hyperlink('basics.htm','PACF(k)','click here for more information about the Partial Autocorrelation Function'),header=TRUE)
a<-table.element(a,'T-STAT',header=TRUE)
a<-table.element(a,'P-value',header=TRUE)
a<-table.row.end(a)
for (i in 1:par1) {
a<-table.row.start(a)
a<-table.element(a,i,header=TRUE)
a<-table.element(a,round(mypacf[i],6))
mytstat <- mypacf[i]*sqrtn
a<-table.element(a,round(mytstat,4))
a<-table.element(a,round(1-pt(abs(mytstat),lengthx),6))
a<-table.row.end(a)
}
a<-table.end(a)
table.save(a,file='mytable1.tab')