Free Statistics

of Irreproducible Research!

Author's title

Author*The author of this computation has been verified*
R Software Modulerwasp_arimabackwardselection.wasp
Title produced by softwareARIMA Backward Selection
Date of computationFri, 03 Dec 2010 12:31:57 +0000
Cite this page as followsStatistical Computations at FreeStatistics.org, Office for Research Development and Education, URL https://freestatistics.org/blog/index.php?v=date/2010/Dec/03/t1291379391sw5hzqtjhngqwr8.htm/, Retrieved Tue, 07 May 2024 19:03:13 +0000
Statistical Computations at FreeStatistics.org, Office for Research Development and Education, URL https://freestatistics.org/blog/index.php?pk=104685, Retrieved Tue, 07 May 2024 19:03:13 +0000
QR Codes:

Original text written by user:
IsPrivate?No (this computation is public)
User-defined keywords
Estimated Impact180
Family? (F = Feedback message, R = changed R code, M = changed R Module, P = changed Parameters, D = changed Data)
-     [Univariate Data Series] [data set] [2008-12-01 19:54:57] [b98453cac15ba1066b407e146608df68]
- RMP   [Standard Deviation-Mean Plot] [Unemployment] [2010-11-29 10:34:47] [b98453cac15ba1066b407e146608df68]
- RMP     [ARIMA Backward Selection] [Unemployment] [2010-11-29 17:10:28] [b98453cac15ba1066b407e146608df68]
-   PD        [ARIMA Backward Selection] [Paper - Werkloosh...] [2010-12-03 12:31:57] [cfd788255f1b1b5389e58d7f218c70bf] [Current]
-               [ARIMA Backward Selection] [Paper - Werkloosh...] [2010-12-03 14:00:52] [4a7069087cf9e0eda253aeed7d8c30d6]
Feedback Forum

Post a new message
Dataseries X:
376.974
377.632
378.205
370.861
369.167
371.551
382.842
381.903
384.502
392.058
384.359
388.884
386.586
387.495
385.705
378.67
377.367
376.911
389.827
387.82
387.267
380.575
372.402
376.74
377.795
376.126
370.804
367.98
367.866
366.121
379.421
378.519
372.423
355.072
344.693
342.892
344.178
337.606
327.103
323.953
316.532
306.307
327.225
329.573
313.761
307.836
300.074
304.198
306.122
300.414
292.133
290.616
280.244
285.179
305.486
305.957
293.886
289.441
288.776
299.149
306.532
309.914
313.468
314.901
309.16
316.15
336.544
339.196
326.738
320.838
318.62
331.533
335.378


Summary of computational transaction
Raw Inputview raw input (R code)
Raw Outputview raw output of R engine
Computing time12 seconds
R Server'Sir Ronald Aylmer Fisher' @ 193.190.124.24

\begin{tabular}{lllllllll}
\hline
Summary of computational transaction \tabularnewline
Raw Input & view raw input (R code)  \tabularnewline
Raw Output & view raw output of R engine  \tabularnewline
Computing time & 12 seconds \tabularnewline
R Server & 'Sir Ronald Aylmer Fisher' @ 193.190.124.24 \tabularnewline
\hline
\end{tabular}
%Source: https://freestatistics.org/blog/index.php?pk=104685&T=0

[TABLE]
[ROW][C]Summary of computational transaction[/C][/ROW]
[ROW][C]Raw Input[/C][C]view raw input (R code) [/C][/ROW]
[ROW][C]Raw Output[/C][C]view raw output of R engine [/C][/ROW]
[ROW][C]Computing time[/C][C]12 seconds[/C][/ROW]
[ROW][C]R Server[/C][C]'Sir Ronald Aylmer Fisher' @ 193.190.124.24[/C][/ROW]
[/TABLE]
Source: https://freestatistics.org/blog/index.php?pk=104685&T=0

Globally Unique Identifier (entire table): ba.freestatistics.org/blog/index.php?pk=104685&T=0

As an alternative you can also use a QR Code:  

The GUIDs for individual cells are displayed in the table below:

Summary of computational transaction
Raw Inputview raw input (R code)
Raw Outputview raw output of R engine
Computing time12 seconds
R Server'Sir Ronald Aylmer Fisher' @ 193.190.124.24


ARIMA Parameter Estimation and Backward Selection
Iterationar1ar2ar3ma1sar1sar2sma1
Estimates ( 1 )0.5750.02760.154-0.49220.2955-0.2487-0.3713
(p-val)(0.1569 )(0.8661 )(0.3326 )(0.2198 )(0.655 )(0.1243 )(0.5956 )
Estimates ( 2 )0.60900.1596-0.51540.2954-0.2506-0.3807
(p-val)(0.0822 )(NA )(0.2978 )(0.159 )(0.6526 )(0.123 )(0.582 )
Estimates ( 3 )0.624800.1681-0.53990-0.2635-0.0752
(p-val)(0.0537 )(NA )(0.2638 )(0.1068 )(NA )(0.0842 )(0.6341 )
Estimates ( 4 )0.602200.1711-0.51830-0.24970
(p-val)(0.0674 )(NA )(0.2568 )(0.1232 )(NA )(0.0992 )(NA )
Estimates ( 5 )0.90200-0.77480-0.26390
(p-val)(0 )(NA )(NA )(0 )(NA )(0.0722 )(NA )
Estimates ( 6 )0.885800-0.7304000
(p-val)(0 )(NA )(NA )(0 )(NA )(NA )(NA )
Estimates ( 7 )NANANANANANANA
(p-val)(NA )(NA )(NA )(NA )(NA )(NA )(NA )
Estimates ( 8 )NANANANANANANA
(p-val)(NA )(NA )(NA )(NA )(NA )(NA )(NA )
Estimates ( 9 )NANANANANANANA
(p-val)(NA )(NA )(NA )(NA )(NA )(NA )(NA )
Estimates ( 10 )NANANANANANANA
(p-val)(NA )(NA )(NA )(NA )(NA )(NA )(NA )
Estimates ( 11 )NANANANANANANA
(p-val)(NA )(NA )(NA )(NA )(NA )(NA )(NA )
Estimates ( 12 )NANANANANANANA
(p-val)(NA )(NA )(NA )(NA )(NA )(NA )(NA )
Estimates ( 13 )NANANANANANANA
(p-val)(NA )(NA )(NA )(NA )(NA )(NA )(NA )

\begin{tabular}{lllllllll}
\hline
ARIMA Parameter Estimation and Backward Selection \tabularnewline
Iteration & ar1 & ar2 & ar3 & ma1 & sar1 & sar2 & sma1 \tabularnewline
Estimates ( 1 ) & 0.575 & 0.0276 & 0.154 & -0.4922 & 0.2955 & -0.2487 & -0.3713 \tabularnewline
(p-val) & (0.1569 ) & (0.8661 ) & (0.3326 ) & (0.2198 ) & (0.655 ) & (0.1243 ) & (0.5956 ) \tabularnewline
Estimates ( 2 ) & 0.609 & 0 & 0.1596 & -0.5154 & 0.2954 & -0.2506 & -0.3807 \tabularnewline
(p-val) & (0.0822 ) & (NA ) & (0.2978 ) & (0.159 ) & (0.6526 ) & (0.123 ) & (0.582 ) \tabularnewline
Estimates ( 3 ) & 0.6248 & 0 & 0.1681 & -0.5399 & 0 & -0.2635 & -0.0752 \tabularnewline
(p-val) & (0.0537 ) & (NA ) & (0.2638 ) & (0.1068 ) & (NA ) & (0.0842 ) & (0.6341 ) \tabularnewline
Estimates ( 4 ) & 0.6022 & 0 & 0.1711 & -0.5183 & 0 & -0.2497 & 0 \tabularnewline
(p-val) & (0.0674 ) & (NA ) & (0.2568 ) & (0.1232 ) & (NA ) & (0.0992 ) & (NA ) \tabularnewline
Estimates ( 5 ) & 0.902 & 0 & 0 & -0.7748 & 0 & -0.2639 & 0 \tabularnewline
(p-val) & (0 ) & (NA ) & (NA ) & (0 ) & (NA ) & (0.0722 ) & (NA ) \tabularnewline
Estimates ( 6 ) & 0.8858 & 0 & 0 & -0.7304 & 0 & 0 & 0 \tabularnewline
(p-val) & (0 ) & (NA ) & (NA ) & (0 ) & (NA ) & (NA ) & (NA ) \tabularnewline
Estimates ( 7 ) & NA & NA & NA & NA & NA & NA & NA \tabularnewline
(p-val) & (NA ) & (NA ) & (NA ) & (NA ) & (NA ) & (NA ) & (NA ) \tabularnewline
Estimates ( 8 ) & NA & NA & NA & NA & NA & NA & NA \tabularnewline
(p-val) & (NA ) & (NA ) & (NA ) & (NA ) & (NA ) & (NA ) & (NA ) \tabularnewline
Estimates ( 9 ) & NA & NA & NA & NA & NA & NA & NA \tabularnewline
(p-val) & (NA ) & (NA ) & (NA ) & (NA ) & (NA ) & (NA ) & (NA ) \tabularnewline
Estimates ( 10 ) & NA & NA & NA & NA & NA & NA & NA \tabularnewline
(p-val) & (NA ) & (NA ) & (NA ) & (NA ) & (NA ) & (NA ) & (NA ) \tabularnewline
Estimates ( 11 ) & NA & NA & NA & NA & NA & NA & NA \tabularnewline
(p-val) & (NA ) & (NA ) & (NA ) & (NA ) & (NA ) & (NA ) & (NA ) \tabularnewline
Estimates ( 12 ) & NA & NA & NA & NA & NA & NA & NA \tabularnewline
(p-val) & (NA ) & (NA ) & (NA ) & (NA ) & (NA ) & (NA ) & (NA ) \tabularnewline
Estimates ( 13 ) & NA & NA & NA & NA & NA & NA & NA \tabularnewline
(p-val) & (NA ) & (NA ) & (NA ) & (NA ) & (NA ) & (NA ) & (NA ) \tabularnewline
\hline
\end{tabular}
%Source: https://freestatistics.org/blog/index.php?pk=104685&T=1

[TABLE]
[ROW][C]ARIMA Parameter Estimation and Backward Selection[/C][/ROW]
[ROW][C]Iteration[/C][C]ar1[/C][C]ar2[/C][C]ar3[/C][C]ma1[/C][C]sar1[/C][C]sar2[/C][C]sma1[/C][/ROW]
[ROW][C]Estimates ( 1 )[/C][C]0.575[/C][C]0.0276[/C][C]0.154[/C][C]-0.4922[/C][C]0.2955[/C][C]-0.2487[/C][C]-0.3713[/C][/ROW]
[ROW][C](p-val)[/C][C](0.1569 )[/C][C](0.8661 )[/C][C](0.3326 )[/C][C](0.2198 )[/C][C](0.655 )[/C][C](0.1243 )[/C][C](0.5956 )[/C][/ROW]
[ROW][C]Estimates ( 2 )[/C][C]0.609[/C][C]0[/C][C]0.1596[/C][C]-0.5154[/C][C]0.2954[/C][C]-0.2506[/C][C]-0.3807[/C][/ROW]
[ROW][C](p-val)[/C][C](0.0822 )[/C][C](NA )[/C][C](0.2978 )[/C][C](0.159 )[/C][C](0.6526 )[/C][C](0.123 )[/C][C](0.582 )[/C][/ROW]
[ROW][C]Estimates ( 3 )[/C][C]0.6248[/C][C]0[/C][C]0.1681[/C][C]-0.5399[/C][C]0[/C][C]-0.2635[/C][C]-0.0752[/C][/ROW]
[ROW][C](p-val)[/C][C](0.0537 )[/C][C](NA )[/C][C](0.2638 )[/C][C](0.1068 )[/C][C](NA )[/C][C](0.0842 )[/C][C](0.6341 )[/C][/ROW]
[ROW][C]Estimates ( 4 )[/C][C]0.6022[/C][C]0[/C][C]0.1711[/C][C]-0.5183[/C][C]0[/C][C]-0.2497[/C][C]0[/C][/ROW]
[ROW][C](p-val)[/C][C](0.0674 )[/C][C](NA )[/C][C](0.2568 )[/C][C](0.1232 )[/C][C](NA )[/C][C](0.0992 )[/C][C](NA )[/C][/ROW]
[ROW][C]Estimates ( 5 )[/C][C]0.902[/C][C]0[/C][C]0[/C][C]-0.7748[/C][C]0[/C][C]-0.2639[/C][C]0[/C][/ROW]
[ROW][C](p-val)[/C][C](0 )[/C][C](NA )[/C][C](NA )[/C][C](0 )[/C][C](NA )[/C][C](0.0722 )[/C][C](NA )[/C][/ROW]
[ROW][C]Estimates ( 6 )[/C][C]0.8858[/C][C]0[/C][C]0[/C][C]-0.7304[/C][C]0[/C][C]0[/C][C]0[/C][/ROW]
[ROW][C](p-val)[/C][C](0 )[/C][C](NA )[/C][C](NA )[/C][C](0 )[/C][C](NA )[/C][C](NA )[/C][C](NA )[/C][/ROW]
[ROW][C]Estimates ( 7 )[/C][C]NA[/C][C]NA[/C][C]NA[/C][C]NA[/C][C]NA[/C][C]NA[/C][C]NA[/C][/ROW]
[ROW][C](p-val)[/C][C](NA )[/C][C](NA )[/C][C](NA )[/C][C](NA )[/C][C](NA )[/C][C](NA )[/C][C](NA )[/C][/ROW]
[ROW][C]Estimates ( 8 )[/C][C]NA[/C][C]NA[/C][C]NA[/C][C]NA[/C][C]NA[/C][C]NA[/C][C]NA[/C][/ROW]
[ROW][C](p-val)[/C][C](NA )[/C][C](NA )[/C][C](NA )[/C][C](NA )[/C][C](NA )[/C][C](NA )[/C][C](NA )[/C][/ROW]
[ROW][C]Estimates ( 9 )[/C][C]NA[/C][C]NA[/C][C]NA[/C][C]NA[/C][C]NA[/C][C]NA[/C][C]NA[/C][/ROW]
[ROW][C](p-val)[/C][C](NA )[/C][C](NA )[/C][C](NA )[/C][C](NA )[/C][C](NA )[/C][C](NA )[/C][C](NA )[/C][/ROW]
[ROW][C]Estimates ( 10 )[/C][C]NA[/C][C]NA[/C][C]NA[/C][C]NA[/C][C]NA[/C][C]NA[/C][C]NA[/C][/ROW]
[ROW][C](p-val)[/C][C](NA )[/C][C](NA )[/C][C](NA )[/C][C](NA )[/C][C](NA )[/C][C](NA )[/C][C](NA )[/C][/ROW]
[ROW][C]Estimates ( 11 )[/C][C]NA[/C][C]NA[/C][C]NA[/C][C]NA[/C][C]NA[/C][C]NA[/C][C]NA[/C][/ROW]
[ROW][C](p-val)[/C][C](NA )[/C][C](NA )[/C][C](NA )[/C][C](NA )[/C][C](NA )[/C][C](NA )[/C][C](NA )[/C][/ROW]
[ROW][C]Estimates ( 12 )[/C][C]NA[/C][C]NA[/C][C]NA[/C][C]NA[/C][C]NA[/C][C]NA[/C][C]NA[/C][/ROW]
[ROW][C](p-val)[/C][C](NA )[/C][C](NA )[/C][C](NA )[/C][C](NA )[/C][C](NA )[/C][C](NA )[/C][C](NA )[/C][/ROW]
[ROW][C]Estimates ( 13 )[/C][C]NA[/C][C]NA[/C][C]NA[/C][C]NA[/C][C]NA[/C][C]NA[/C][C]NA[/C][/ROW]
[ROW][C](p-val)[/C][C](NA )[/C][C](NA )[/C][C](NA )[/C][C](NA )[/C][C](NA )[/C][C](NA )[/C][C](NA )[/C][/ROW]
[/TABLE]
Source: https://freestatistics.org/blog/index.php?pk=104685&T=1

Globally Unique Identifier (entire table): ba.freestatistics.org/blog/index.php?pk=104685&T=1

As an alternative you can also use a QR Code:  

The GUIDs for individual cells are displayed in the table below:

ARIMA Parameter Estimation and Backward Selection
Iterationar1ar2ar3ma1sar1sar2sma1
Estimates ( 1 )0.5750.02760.154-0.49220.2955-0.2487-0.3713
(p-val)(0.1569 )(0.8661 )(0.3326 )(0.2198 )(0.655 )(0.1243 )(0.5956 )
Estimates ( 2 )0.60900.1596-0.51540.2954-0.2506-0.3807
(p-val)(0.0822 )(NA )(0.2978 )(0.159 )(0.6526 )(0.123 )(0.582 )
Estimates ( 3 )0.624800.1681-0.53990-0.2635-0.0752
(p-val)(0.0537 )(NA )(0.2638 )(0.1068 )(NA )(0.0842 )(0.6341 )
Estimates ( 4 )0.602200.1711-0.51830-0.24970
(p-val)(0.0674 )(NA )(0.2568 )(0.1232 )(NA )(0.0992 )(NA )
Estimates ( 5 )0.90200-0.77480-0.26390
(p-val)(0 )(NA )(NA )(0 )(NA )(0.0722 )(NA )
Estimates ( 6 )0.885800-0.7304000
(p-val)(0 )(NA )(NA )(0 )(NA )(NA )(NA )
Estimates ( 7 )NANANANANANANA
(p-val)(NA )(NA )(NA )(NA )(NA )(NA )(NA )
Estimates ( 8 )NANANANANANANA
(p-val)(NA )(NA )(NA )(NA )(NA )(NA )(NA )
Estimates ( 9 )NANANANANANANA
(p-val)(NA )(NA )(NA )(NA )(NA )(NA )(NA )
Estimates ( 10 )NANANANANANANA
(p-val)(NA )(NA )(NA )(NA )(NA )(NA )(NA )
Estimates ( 11 )NANANANANANANA
(p-val)(NA )(NA )(NA )(NA )(NA )(NA )(NA )
Estimates ( 12 )NANANANANANANA
(p-val)(NA )(NA )(NA )(NA )(NA )(NA )(NA )
Estimates ( 13 )NANANANANANANA
(p-val)(NA )(NA )(NA )(NA )(NA )(NA )(NA )


Estimated ARIMA Residuals
Value
-479.356262605896
194.145478005273
-1751.87733807488
364.838644188769
427.113372745987
-1934.49080306807
1673.10732386674
-724.786315756258
-2164.66125777221
-10192.1727434332
1500.90932392907
1070.54024329451
3527.90083246713
-1408.14129632939
-1892.66234057567
3954.19774997086
1062.39681241087
-874.620969453868
137.913383758922
930.038990157556
-4060.21706131713
-6778.77858634586
164.513797026259
-3263.82868419063
1431.02785773364
-2037.20553964804
-2199.68894284213
1509.25473052606
-3489.56759812531
-4197.84243065681
5540.93487607549
2956.06341731868
-5750.06569176112
7202.36369841547
2634.30656114512
3452.67377987503
340.780188855808
-111.118941618168
852.904862281937
1441.84930359132
-1648.81122609111
8473.02947617536
-2727.53714403016
-2004.62934853521
1205.88985479501
-1607.54105991328
3594.41761800848
1561.62174837107
2345.94270881039
3518.9665216651
4819.31505744846
-180.744392159901
-652.15397274594
-1265.02850128227
1002.41249795826
886.53779948381
-3731.72097627028
524.2285325365
-976.86186982241
2851.3463796792
-2581.3222153057

\begin{tabular}{lllllllll}
\hline
Estimated ARIMA Residuals \tabularnewline
Value \tabularnewline
-479.356262605896 \tabularnewline
194.145478005273 \tabularnewline
-1751.87733807488 \tabularnewline
364.838644188769 \tabularnewline
427.113372745987 \tabularnewline
-1934.49080306807 \tabularnewline
1673.10732386674 \tabularnewline
-724.786315756258 \tabularnewline
-2164.66125777221 \tabularnewline
-10192.1727434332 \tabularnewline
1500.90932392907 \tabularnewline
1070.54024329451 \tabularnewline
3527.90083246713 \tabularnewline
-1408.14129632939 \tabularnewline
-1892.66234057567 \tabularnewline
3954.19774997086 \tabularnewline
1062.39681241087 \tabularnewline
-874.620969453868 \tabularnewline
137.913383758922 \tabularnewline
930.038990157556 \tabularnewline
-4060.21706131713 \tabularnewline
-6778.77858634586 \tabularnewline
164.513797026259 \tabularnewline
-3263.82868419063 \tabularnewline
1431.02785773364 \tabularnewline
-2037.20553964804 \tabularnewline
-2199.68894284213 \tabularnewline
1509.25473052606 \tabularnewline
-3489.56759812531 \tabularnewline
-4197.84243065681 \tabularnewline
5540.93487607549 \tabularnewline
2956.06341731868 \tabularnewline
-5750.06569176112 \tabularnewline
7202.36369841547 \tabularnewline
2634.30656114512 \tabularnewline
3452.67377987503 \tabularnewline
340.780188855808 \tabularnewline
-111.118941618168 \tabularnewline
852.904862281937 \tabularnewline
1441.84930359132 \tabularnewline
-1648.81122609111 \tabularnewline
8473.02947617536 \tabularnewline
-2727.53714403016 \tabularnewline
-2004.62934853521 \tabularnewline
1205.88985479501 \tabularnewline
-1607.54105991328 \tabularnewline
3594.41761800848 \tabularnewline
1561.62174837107 \tabularnewline
2345.94270881039 \tabularnewline
3518.9665216651 \tabularnewline
4819.31505744846 \tabularnewline
-180.744392159901 \tabularnewline
-652.15397274594 \tabularnewline
-1265.02850128227 \tabularnewline
1002.41249795826 \tabularnewline
886.53779948381 \tabularnewline
-3731.72097627028 \tabularnewline
524.2285325365 \tabularnewline
-976.86186982241 \tabularnewline
2851.3463796792 \tabularnewline
-2581.3222153057 \tabularnewline
\hline
\end{tabular}
%Source: https://freestatistics.org/blog/index.php?pk=104685&T=2

[TABLE]
[ROW][C]Estimated ARIMA Residuals[/C][/ROW]
[ROW][C]Value[/C][/ROW]
[ROW][C]-479.356262605896[/C][/ROW]
[ROW][C]194.145478005273[/C][/ROW]
[ROW][C]-1751.87733807488[/C][/ROW]
[ROW][C]364.838644188769[/C][/ROW]
[ROW][C]427.113372745987[/C][/ROW]
[ROW][C]-1934.49080306807[/C][/ROW]
[ROW][C]1673.10732386674[/C][/ROW]
[ROW][C]-724.786315756258[/C][/ROW]
[ROW][C]-2164.66125777221[/C][/ROW]
[ROW][C]-10192.1727434332[/C][/ROW]
[ROW][C]1500.90932392907[/C][/ROW]
[ROW][C]1070.54024329451[/C][/ROW]
[ROW][C]3527.90083246713[/C][/ROW]
[ROW][C]-1408.14129632939[/C][/ROW]
[ROW][C]-1892.66234057567[/C][/ROW]
[ROW][C]3954.19774997086[/C][/ROW]
[ROW][C]1062.39681241087[/C][/ROW]
[ROW][C]-874.620969453868[/C][/ROW]
[ROW][C]137.913383758922[/C][/ROW]
[ROW][C]930.038990157556[/C][/ROW]
[ROW][C]-4060.21706131713[/C][/ROW]
[ROW][C]-6778.77858634586[/C][/ROW]
[ROW][C]164.513797026259[/C][/ROW]
[ROW][C]-3263.82868419063[/C][/ROW]
[ROW][C]1431.02785773364[/C][/ROW]
[ROW][C]-2037.20553964804[/C][/ROW]
[ROW][C]-2199.68894284213[/C][/ROW]
[ROW][C]1509.25473052606[/C][/ROW]
[ROW][C]-3489.56759812531[/C][/ROW]
[ROW][C]-4197.84243065681[/C][/ROW]
[ROW][C]5540.93487607549[/C][/ROW]
[ROW][C]2956.06341731868[/C][/ROW]
[ROW][C]-5750.06569176112[/C][/ROW]
[ROW][C]7202.36369841547[/C][/ROW]
[ROW][C]2634.30656114512[/C][/ROW]
[ROW][C]3452.67377987503[/C][/ROW]
[ROW][C]340.780188855808[/C][/ROW]
[ROW][C]-111.118941618168[/C][/ROW]
[ROW][C]852.904862281937[/C][/ROW]
[ROW][C]1441.84930359132[/C][/ROW]
[ROW][C]-1648.81122609111[/C][/ROW]
[ROW][C]8473.02947617536[/C][/ROW]
[ROW][C]-2727.53714403016[/C][/ROW]
[ROW][C]-2004.62934853521[/C][/ROW]
[ROW][C]1205.88985479501[/C][/ROW]
[ROW][C]-1607.54105991328[/C][/ROW]
[ROW][C]3594.41761800848[/C][/ROW]
[ROW][C]1561.62174837107[/C][/ROW]
[ROW][C]2345.94270881039[/C][/ROW]
[ROW][C]3518.9665216651[/C][/ROW]
[ROW][C]4819.31505744846[/C][/ROW]
[ROW][C]-180.744392159901[/C][/ROW]
[ROW][C]-652.15397274594[/C][/ROW]
[ROW][C]-1265.02850128227[/C][/ROW]
[ROW][C]1002.41249795826[/C][/ROW]
[ROW][C]886.53779948381[/C][/ROW]
[ROW][C]-3731.72097627028[/C][/ROW]
[ROW][C]524.2285325365[/C][/ROW]
[ROW][C]-976.86186982241[/C][/ROW]
[ROW][C]2851.3463796792[/C][/ROW]
[ROW][C]-2581.3222153057[/C][/ROW]
[/TABLE]
Source: https://freestatistics.org/blog/index.php?pk=104685&T=2

Globally Unique Identifier (entire table): ba.freestatistics.org/blog/index.php?pk=104685&T=2

As an alternative you can also use a QR Code:  

The GUIDs for individual cells are displayed in the table below:

Estimated ARIMA Residuals
Value
-479.356262605896
194.145478005273
-1751.87733807488
364.838644188769
427.113372745987
-1934.49080306807
1673.10732386674
-724.786315756258
-2164.66125777221
-10192.1727434332
1500.90932392907
1070.54024329451
3527.90083246713
-1408.14129632939
-1892.66234057567
3954.19774997086
1062.39681241087
-874.620969453868
137.913383758922
930.038990157556
-4060.21706131713
-6778.77858634586
164.513797026259
-3263.82868419063
1431.02785773364
-2037.20553964804
-2199.68894284213
1509.25473052606
-3489.56759812531
-4197.84243065681
5540.93487607549
2956.06341731868
-5750.06569176112
7202.36369841547
2634.30656114512
3452.67377987503
340.780188855808
-111.118941618168
852.904862281937
1441.84930359132
-1648.81122609111
8473.02947617536
-2727.53714403016
-2004.62934853521
1205.88985479501
-1607.54105991328
3594.41761800848
1561.62174837107
2345.94270881039
3518.9665216651
4819.31505744846
-180.744392159901
-652.15397274594
-1265.02850128227
1002.41249795826
886.53779948381
-3731.72097627028
524.2285325365
-976.86186982241
2851.3463796792
-2581.3222153057


Parameters (Session):
par1 = FALSE ; par2 = 1 ; par3 = 1 ; par4 = 1 ; par5 = 12 ; par6 = 3 ; par7 = 1 ; par8 = 2 ; par9 = 1 ;
Parameters (R input):
par1 = FALSE ; par2 = 2.0 ; par3 = 1 ; par4 = 1 ; par5 = 12 ; par6 = 3 ; par7 = 1 ; par8 = 2 ; par9 = 1 ;
R code (references can be found in the software module):
library(lattice)
if (par1 == 'TRUE') par1 <- TRUE
if (par1 == 'FALSE') par1 <- FALSE
par2 <- as.numeric(par2) #Box-Cox lambda transformation parameter
par3 <- as.numeric(par3) #degree of non-seasonal differencing
par4 <- as.numeric(par4) #degree of seasonal differencing
par5 <- as.numeric(par5) #seasonal period
par6 <- as.numeric(par6) #degree (p) of the non-seasonal AR(p) polynomial
par7 <- as.numeric(par7) #degree (q) of the non-seasonal MA(q) polynomial
par8 <- as.numeric(par8) #degree (P) of the seasonal AR(P) polynomial
par9 <- as.numeric(par9) #degree (Q) of the seasonal MA(Q) polynomial
armaGR <- function(arima.out, names, n){
try1 <- arima.out$coef
try2 <- sqrt(diag(arima.out$var.coef))
try.data.frame <- data.frame(matrix(NA,ncol=4,nrow=length(names)))
dimnames(try.data.frame) <- list(names,c('coef','std','tstat','pv'))
try.data.frame[,1] <- try1
for(i in 1:length(try2)) try.data.frame[which(rownames(try.data.frame)==names(try2)[i]),2] <- try2[i]
try.data.frame[,3] <- try.data.frame[,1] / try.data.frame[,2]
try.data.frame[,4] <- round((1-pt(abs(try.data.frame[,3]),df=n-(length(try2)+1)))*2,5)
vector <- rep(NA,length(names))
vector[is.na(try.data.frame[,4])] <- 0
maxi <- which.max(try.data.frame[,4])
continue <- max(try.data.frame[,4],na.rm=TRUE) > .05
vector[maxi] <- 0
list(summary=try.data.frame,next.vector=vector,continue=continue)
}
arimaSelect <- function(series, order=c(13,0,0), seasonal=list(order=c(2,0,0),period=12), include.mean=F){
nrc <- order[1]+order[3]+seasonal$order[1]+seasonal$order[3]
coeff <- matrix(NA, nrow=nrc*2, ncol=nrc)
pval <- matrix(NA, nrow=nrc*2, ncol=nrc)
mylist <- rep(list(NULL), nrc)
names <- NULL
if(order[1] > 0) names <- paste('ar',1:order[1],sep='')
if(order[3] > 0) names <- c( names , paste('ma',1:order[3],sep='') )
if(seasonal$order[1] > 0) names <- c(names, paste('sar',1:seasonal$order[1],sep=''))
if(seasonal$order[3] > 0) names <- c(names, paste('sma',1:seasonal$order[3],sep=''))
arima.out <- arima(series, order=order, seasonal=seasonal, include.mean=include.mean, method='ML')
mylist[[1]] <- arima.out
last.arma <- armaGR(arima.out, names, length(series))
mystop <- FALSE
i <- 1
coeff[i,] <- last.arma[[1]][,1]
pval [i,] <- last.arma[[1]][,4]
i <- 2
aic <- arima.out$aic
while(!mystop){
mylist[[i]] <- arima.out
arima.out <- arima(series, order=order, seasonal=seasonal, include.mean=include.mean, method='ML', fixed=last.arma$next.vector)
aic <- c(aic, arima.out$aic)
last.arma <- armaGR(arima.out, names, length(series))
mystop <- !last.arma$continue
coeff[i,] <- last.arma[[1]][,1]
pval [i,] <- last.arma[[1]][,4]
i <- i+1
}
list(coeff, pval, mylist, aic=aic)
}
arimaSelectplot <- function(arimaSelect.out,noms,choix){
noms <- names(arimaSelect.out[[3]][[1]]$coef)
coeff <- arimaSelect.out[[1]]
k <- min(which(is.na(coeff[,1])))-1
coeff <- coeff[1:k,]
pval <- arimaSelect.out[[2]][1:k,]
aic <- arimaSelect.out$aic[1:k]
coeff[coeff==0] <- NA
n <- ncol(coeff)
if(missing(choix)) choix <- k
layout(matrix(c(1,1,1,2,
3,3,3,2,
3,3,3,4,
5,6,7,7),nr=4),
widths=c(10,35,45,15),
heights=c(30,30,15,15))
couleurs <- rainbow(75)[1:50]#(50)
ticks <- pretty(coeff)
par(mar=c(1,1,3,1))
plot(aic,k:1-.5,type='o',pch=21,bg='blue',cex=2,axes=F,lty=2,xpd=NA)
points(aic[choix],k-choix+.5,pch=21,cex=4,bg=2,xpd=NA)
title('aic',line=2)
par(mar=c(3,0,0,0))
plot(0,axes=F,xlab='',ylab='',xlim=range(ticks),ylim=c(.1,1))
rect(xleft = min(ticks) + (0:49)/50*(max(ticks)-min(ticks)),
xright = min(ticks) + (1:50)/50*(max(ticks)-min(ticks)),
ytop = rep(1,50),
ybottom= rep(0,50),col=couleurs,border=NA)
axis(1,ticks)
rect(xleft=min(ticks),xright=max(ticks),ytop=1,ybottom=0)
text(mean(coeff,na.rm=T),.5,'coefficients',cex=2,font=2)
par(mar=c(1,1,3,1))
image(1:n,1:k,t(coeff[k:1,]),axes=F,col=couleurs,zlim=range(ticks))
for(i in 1:n) for(j in 1:k) if(!is.na(coeff[j,i])) {
if(pval[j,i]<.01) symb = 'green'
else if( (pval[j,i]<.05) & (pval[j,i]>=.01)) symb = 'orange'
else if( (pval[j,i]<.1) & (pval[j,i]>=.05)) symb = 'red'
else symb = 'black'
polygon(c(i+.5 ,i+.2 ,i+.5 ,i+.5),
c(k-j+0.5,k-j+0.5,k-j+0.8,k-j+0.5),
col=symb)
if(j==choix) {
rect(xleft=i-.5,
xright=i+.5,
ybottom=k-j+1.5,
ytop=k-j+.5,
lwd=4)
text(i,
k-j+1,
round(coeff[j,i],2),
cex=1.2,
font=2)
}
else{
rect(xleft=i-.5,xright=i+.5,ybottom=k-j+1.5,ytop=k-j+.5)
text(i,k-j+1,round(coeff[j,i],2),cex=1.2,font=1)
}
}
axis(3,1:n,noms)
par(mar=c(0.5,0,0,0.5))
plot(0,axes=F,xlab='',ylab='',type='n',xlim=c(0,8),ylim=c(-.2,.8))
cols <- c('green','orange','red','black')
niv <- c('0','0.01','0.05','0.1')
for(i in 0:3){
polygon(c(1+2*i ,1+2*i ,1+2*i-.5 ,1+2*i),
c(.4 ,.7 , .4 , .4),
col=cols[i+1])
text(2*i,0.5,niv[i+1],cex=1.5)
}
text(8,.5,1,cex=1.5)
text(4,0,'p-value',cex=2)
box()
residus <- arimaSelect.out[[3]][[choix]]$res
par(mar=c(1,2,4,1))
acf(residus,main='')
title('acf',line=.5)
par(mar=c(1,2,4,1))
pacf(residus,main='')
title('pacf',line=.5)
par(mar=c(2,2,4,1))
qqnorm(residus,main='')
title('qq-norm',line=.5)
qqline(residus)
residus
}
if (par2 == 0) x <- log(x)
if (par2 != 0) x <- x^par2
(selection <- arimaSelect(x, order=c(par6,par3,par7), seasonal=list(order=c(par8,par4,par9), period=par5)))
bitmap(file='test1.png')
resid <- arimaSelectplot(selection)
dev.off()
resid
bitmap(file='test2.png')
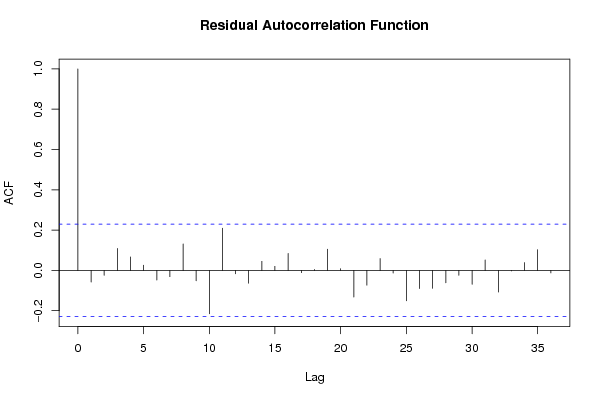
acf(resid,length(resid)/2, main='Residual Autocorrelation Function')
dev.off()
bitmap(file='test3.png')
pacf(resid,length(resid)/2, main='Residual Partial Autocorrelation Function')
dev.off()
bitmap(file='test4.png')
cpgram(resid, main='Residual Cumulative Periodogram')
dev.off()
bitmap(file='test5.png')
hist(resid, main='Residual Histogram', xlab='values of Residuals')
dev.off()
bitmap(file='test6.png')
densityplot(~resid,col='black',main='Residual Density Plot', xlab='values of Residuals')
dev.off()
bitmap(file='test7.png')
qqnorm(resid, main='Residual Normal Q-Q Plot')
qqline(resid)
dev.off()
ncols <- length(selection[[1]][1,])
nrows <- length(selection[[2]][,1])-1
load(file='createtable')
a<-table.start()
a<-table.row.start(a)
a<-table.element(a,'ARIMA Parameter Estimation and Backward Selection', ncols+1,TRUE)
a<-table.row.end(a)
a<-table.row.start(a)
a<-table.element(a,'Iteration', header=TRUE)
for (i in 1:ncols) {
a<-table.element(a,names(selection[[3]][[1]]$coef)[i],header=TRUE)
}
a<-table.row.end(a)
for (j in 1:nrows) {
a<-table.row.start(a)
mydum <- 'Estimates ('
mydum <- paste(mydum,j)
mydum <- paste(mydum,')')
a<-table.element(a,mydum, header=TRUE)
for (i in 1:ncols) {
a<-table.element(a,round(selection[[1]][j,i],4))
}
a<-table.row.end(a)
a<-table.row.start(a)
a<-table.element(a,'(p-val)', header=TRUE)
for (i in 1:ncols) {
mydum <- '('
mydum <- paste(mydum,round(selection[[2]][j,i],4),sep='')
mydum <- paste(mydum,')')
a<-table.element(a,mydum)
}
a<-table.row.end(a)
}
a<-table.end(a)
table.save(a,file='mytable.tab')
a<-table.start()
a<-table.row.start(a)
a<-table.element(a,'Estimated ARIMA Residuals', 1,TRUE)
a<-table.row.end(a)
a<-table.row.start(a)
a<-table.element(a,'Value', 1,TRUE)
a<-table.row.end(a)
for (i in (par4*par5+par3):length(resid)) {
a<-table.row.start(a)
a<-table.element(a,resid[i])
a<-table.row.end(a)
}
a<-table.end(a)
table.save(a,file='mytable1.tab')