Free Statistics

of Irreproducible Research!

Author's title

Author*The author of this computation has been verified*
R Software Modulerwasp_autocorrelation.wasp
Title produced by software(Partial) Autocorrelation Function
Date of computationFri, 03 Dec 2010 09:41:48 +0000
Cite this page as followsStatistical Computations at FreeStatistics.org, Office for Research Development and Education, URL https://freestatistics.org/blog/index.php?v=date/2010/Dec/03/t1291369486b5ymuighelguaoa.htm/, Retrieved Tue, 07 May 2024 20:37:37 +0000
Statistical Computations at FreeStatistics.org, Office for Research Development and Education, URL https://freestatistics.org/blog/index.php?pk=104571, Retrieved Tue, 07 May 2024 20:37:37 +0000
QR Codes:

Original text written by user:
IsPrivate?No (this computation is public)
User-defined keywords
Estimated Impact153
Family? (F = Feedback message, R = changed R code, M = changed R Module, P = changed Parameters, D = changed Data)
-     [Univariate Data Series] [data set] [2008-12-01 19:54:57] [b98453cac15ba1066b407e146608df68]
- RMP   [(Partial) Autocorrelation Function] [Unemployment] [2010-11-29 09:05:21] [b98453cac15ba1066b407e146608df68]
-    D    [(Partial) Autocorrelation Function] [W9 autocorrelatie] [2010-12-03 08:22:12] [56d90b683fcd93137645f9226b43c62b]
-    D        [(Partial) Autocorrelation Function] [W9 ACF d=1 D=0] [2010-12-03 09:41:48] [59f7d3e7fcb6374015f4e6b9053b0f01] [Current]
Feedback Forum

Post a new message
Dataseries X:
17848
19592
21092
20889
25890
24965
22225
20977
22897
22785
22769
19637
20203
20450
23083
21738
26766
25280
22574
22729
21378
22902
24989
21116
15169
15846
20927
18273
22538
15596
14034
11366
14861
15149
13577
13026
13190
13196
15826
14733
16307
15703
14589
12043
15057
14053
12698
10888
10045
11549
13767
12424
13116
14211
12266
12602
15714
13742
12745
10491
10057
10900
11771
11992
11993
14504
11727
11477
13578
11555
11846
11397
10066
10269
14279
13870
13695
14420
11424
9704
12464
14301
13464
9893
11572
12380
16692
16052
16459
14761
13654
13480
18068
16560
14530
10650
11651
13735
13360
17818
20613
16231
13862
12004
17734
15034
12609
12320
10833
11350
13648
14890
16325
18045
15616
11926
16855
15083
12520
12355


Summary of computational transaction
Raw Inputview raw input (R code)
Raw Outputview raw output of R engine
Computing time2 seconds
R Server'Gwilym Jenkins' @ 72.249.127.135

\begin{tabular}{lllllllll}
\hline
Summary of computational transaction \tabularnewline
Raw Input & view raw input (R code)  \tabularnewline
Raw Output & view raw output of R engine  \tabularnewline
Computing time & 2 seconds \tabularnewline
R Server & 'Gwilym Jenkins' @ 72.249.127.135 \tabularnewline
\hline
\end{tabular}
%Source: https://freestatistics.org/blog/index.php?pk=104571&T=0

[TABLE]
[ROW][C]Summary of computational transaction[/C][/ROW]
[ROW][C]Raw Input[/C][C]view raw input (R code) [/C][/ROW]
[ROW][C]Raw Output[/C][C]view raw output of R engine [/C][/ROW]
[ROW][C]Computing time[/C][C]2 seconds[/C][/ROW]
[ROW][C]R Server[/C][C]'Gwilym Jenkins' @ 72.249.127.135[/C][/ROW]
[/TABLE]
Source: https://freestatistics.org/blog/index.php?pk=104571&T=0

Globally Unique Identifier (entire table): ba.freestatistics.org/blog/index.php?pk=104571&T=0

As an alternative you can also use a QR Code:  

The GUIDs for individual cells are displayed in the table below:

Summary of computational transaction
Raw Inputview raw input (R code)
Raw Outputview raw output of R engine
Computing time2 seconds
R Server'Gwilym Jenkins' @ 72.249.127.135


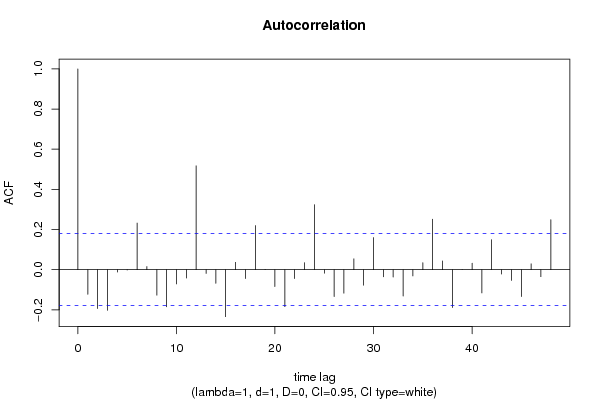
Autocorrelation Function
Time lag kACF(k)T-STATP-value
1-0.122616-1.33760.091791
2-0.193619-2.11210.018383
3-0.202678-2.2110.014475
4-0.012103-0.1320.447592
5-0.002106-0.0230.490855
60.2321312.53230.006318
70.0151420.16520.434541
8-0.127109-1.38660.084078
9-0.185287-2.02120.022749
10-0.071027-0.77480.219993
11-0.04161-0.45390.325359
120.5172395.64240
13-0.019102-0.20840.417646
14-0.067878-0.74050.230239
15-0.234136-2.55410.005954
160.0363190.39620.346336
17-0.044174-0.48190.315387
180.2194662.39410.009112
190.0007090.00770.496921
20-0.084239-0.91890.179992
21-0.184552-2.01320.023174
22-0.044526-0.48570.314029
230.034690.37840.352893
240.3238573.53290.000293
25-0.017666-0.19270.423756
26-0.134182-1.46380.072948
27-0.117044-1.27680.10208
280.0543420.59280.277218
29-0.077467-0.84510.199884
300.1598721.7440.041871
31-0.0355-0.38730.349628
32-0.037147-0.40520.343019
33-0.131641-1.4360.076809
34-0.031364-0.34210.366424
350.0345710.37710.353375
360.2516082.74470.003498
370.0432850.47220.318829
38-0.189026-2.0620.020691
39-0.000354-0.00390.498462
400.0322490.35180.362808
41-0.115675-1.26190.104732
420.1495671.63160.052706
43-0.021836-0.23820.406065
44-0.053563-0.58430.280063
45-0.134347-1.46550.072704
460.0289340.31560.376416
47-0.03498-0.38160.351726
480.248782.71390.003819

\begin{tabular}{lllllllll}
\hline
Autocorrelation Function \tabularnewline
Time lag k & ACF(k) & T-STAT & P-value \tabularnewline
1 & -0.122616 & -1.3376 & 0.091791 \tabularnewline
2 & -0.193619 & -2.1121 & 0.018383 \tabularnewline
3 & -0.202678 & -2.211 & 0.014475 \tabularnewline
4 & -0.012103 & -0.132 & 0.447592 \tabularnewline
5 & -0.002106 & -0.023 & 0.490855 \tabularnewline
6 & 0.232131 & 2.5323 & 0.006318 \tabularnewline
7 & 0.015142 & 0.1652 & 0.434541 \tabularnewline
8 & -0.127109 & -1.3866 & 0.084078 \tabularnewline
9 & -0.185287 & -2.0212 & 0.022749 \tabularnewline
10 & -0.071027 & -0.7748 & 0.219993 \tabularnewline
11 & -0.04161 & -0.4539 & 0.325359 \tabularnewline
12 & 0.517239 & 5.6424 & 0 \tabularnewline
13 & -0.019102 & -0.2084 & 0.417646 \tabularnewline
14 & -0.067878 & -0.7405 & 0.230239 \tabularnewline
15 & -0.234136 & -2.5541 & 0.005954 \tabularnewline
16 & 0.036319 & 0.3962 & 0.346336 \tabularnewline
17 & -0.044174 & -0.4819 & 0.315387 \tabularnewline
18 & 0.219466 & 2.3941 & 0.009112 \tabularnewline
19 & 0.000709 & 0.0077 & 0.496921 \tabularnewline
20 & -0.084239 & -0.9189 & 0.179992 \tabularnewline
21 & -0.184552 & -2.0132 & 0.023174 \tabularnewline
22 & -0.044526 & -0.4857 & 0.314029 \tabularnewline
23 & 0.03469 & 0.3784 & 0.352893 \tabularnewline
24 & 0.323857 & 3.5329 & 0.000293 \tabularnewline
25 & -0.017666 & -0.1927 & 0.423756 \tabularnewline
26 & -0.134182 & -1.4638 & 0.072948 \tabularnewline
27 & -0.117044 & -1.2768 & 0.10208 \tabularnewline
28 & 0.054342 & 0.5928 & 0.277218 \tabularnewline
29 & -0.077467 & -0.8451 & 0.199884 \tabularnewline
30 & 0.159872 & 1.744 & 0.041871 \tabularnewline
31 & -0.0355 & -0.3873 & 0.349628 \tabularnewline
32 & -0.037147 & -0.4052 & 0.343019 \tabularnewline
33 & -0.131641 & -1.436 & 0.076809 \tabularnewline
34 & -0.031364 & -0.3421 & 0.366424 \tabularnewline
35 & 0.034571 & 0.3771 & 0.353375 \tabularnewline
36 & 0.251608 & 2.7447 & 0.003498 \tabularnewline
37 & 0.043285 & 0.4722 & 0.318829 \tabularnewline
38 & -0.189026 & -2.062 & 0.020691 \tabularnewline
39 & -0.000354 & -0.0039 & 0.498462 \tabularnewline
40 & 0.032249 & 0.3518 & 0.362808 \tabularnewline
41 & -0.115675 & -1.2619 & 0.104732 \tabularnewline
42 & 0.149567 & 1.6316 & 0.052706 \tabularnewline
43 & -0.021836 & -0.2382 & 0.406065 \tabularnewline
44 & -0.053563 & -0.5843 & 0.280063 \tabularnewline
45 & -0.134347 & -1.4655 & 0.072704 \tabularnewline
46 & 0.028934 & 0.3156 & 0.376416 \tabularnewline
47 & -0.03498 & -0.3816 & 0.351726 \tabularnewline
48 & 0.24878 & 2.7139 & 0.003819 \tabularnewline
\hline
\end{tabular}
%Source: https://freestatistics.org/blog/index.php?pk=104571&T=1

[TABLE]
[ROW][C]Autocorrelation Function[/C][/ROW]
[ROW][C]Time lag k[/C][C]ACF(k)[/C][C]T-STAT[/C][C]P-value[/C][/ROW]
[ROW][C]1[/C][C]-0.122616[/C][C]-1.3376[/C][C]0.091791[/C][/ROW]
[ROW][C]2[/C][C]-0.193619[/C][C]-2.1121[/C][C]0.018383[/C][/ROW]
[ROW][C]3[/C][C]-0.202678[/C][C]-2.211[/C][C]0.014475[/C][/ROW]
[ROW][C]4[/C][C]-0.012103[/C][C]-0.132[/C][C]0.447592[/C][/ROW]
[ROW][C]5[/C][C]-0.002106[/C][C]-0.023[/C][C]0.490855[/C][/ROW]
[ROW][C]6[/C][C]0.232131[/C][C]2.5323[/C][C]0.006318[/C][/ROW]
[ROW][C]7[/C][C]0.015142[/C][C]0.1652[/C][C]0.434541[/C][/ROW]
[ROW][C]8[/C][C]-0.127109[/C][C]-1.3866[/C][C]0.084078[/C][/ROW]
[ROW][C]9[/C][C]-0.185287[/C][C]-2.0212[/C][C]0.022749[/C][/ROW]
[ROW][C]10[/C][C]-0.071027[/C][C]-0.7748[/C][C]0.219993[/C][/ROW]
[ROW][C]11[/C][C]-0.04161[/C][C]-0.4539[/C][C]0.325359[/C][/ROW]
[ROW][C]12[/C][C]0.517239[/C][C]5.6424[/C][C]0[/C][/ROW]
[ROW][C]13[/C][C]-0.019102[/C][C]-0.2084[/C][C]0.417646[/C][/ROW]
[ROW][C]14[/C][C]-0.067878[/C][C]-0.7405[/C][C]0.230239[/C][/ROW]
[ROW][C]15[/C][C]-0.234136[/C][C]-2.5541[/C][C]0.005954[/C][/ROW]
[ROW][C]16[/C][C]0.036319[/C][C]0.3962[/C][C]0.346336[/C][/ROW]
[ROW][C]17[/C][C]-0.044174[/C][C]-0.4819[/C][C]0.315387[/C][/ROW]
[ROW][C]18[/C][C]0.219466[/C][C]2.3941[/C][C]0.009112[/C][/ROW]
[ROW][C]19[/C][C]0.000709[/C][C]0.0077[/C][C]0.496921[/C][/ROW]
[ROW][C]20[/C][C]-0.084239[/C][C]-0.9189[/C][C]0.179992[/C][/ROW]
[ROW][C]21[/C][C]-0.184552[/C][C]-2.0132[/C][C]0.023174[/C][/ROW]
[ROW][C]22[/C][C]-0.044526[/C][C]-0.4857[/C][C]0.314029[/C][/ROW]
[ROW][C]23[/C][C]0.03469[/C][C]0.3784[/C][C]0.352893[/C][/ROW]
[ROW][C]24[/C][C]0.323857[/C][C]3.5329[/C][C]0.000293[/C][/ROW]
[ROW][C]25[/C][C]-0.017666[/C][C]-0.1927[/C][C]0.423756[/C][/ROW]
[ROW][C]26[/C][C]-0.134182[/C][C]-1.4638[/C][C]0.072948[/C][/ROW]
[ROW][C]27[/C][C]-0.117044[/C][C]-1.2768[/C][C]0.10208[/C][/ROW]
[ROW][C]28[/C][C]0.054342[/C][C]0.5928[/C][C]0.277218[/C][/ROW]
[ROW][C]29[/C][C]-0.077467[/C][C]-0.8451[/C][C]0.199884[/C][/ROW]
[ROW][C]30[/C][C]0.159872[/C][C]1.744[/C][C]0.041871[/C][/ROW]
[ROW][C]31[/C][C]-0.0355[/C][C]-0.3873[/C][C]0.349628[/C][/ROW]
[ROW][C]32[/C][C]-0.037147[/C][C]-0.4052[/C][C]0.343019[/C][/ROW]
[ROW][C]33[/C][C]-0.131641[/C][C]-1.436[/C][C]0.076809[/C][/ROW]
[ROW][C]34[/C][C]-0.031364[/C][C]-0.3421[/C][C]0.366424[/C][/ROW]
[ROW][C]35[/C][C]0.034571[/C][C]0.3771[/C][C]0.353375[/C][/ROW]
[ROW][C]36[/C][C]0.251608[/C][C]2.7447[/C][C]0.003498[/C][/ROW]
[ROW][C]37[/C][C]0.043285[/C][C]0.4722[/C][C]0.318829[/C][/ROW]
[ROW][C]38[/C][C]-0.189026[/C][C]-2.062[/C][C]0.020691[/C][/ROW]
[ROW][C]39[/C][C]-0.000354[/C][C]-0.0039[/C][C]0.498462[/C][/ROW]
[ROW][C]40[/C][C]0.032249[/C][C]0.3518[/C][C]0.362808[/C][/ROW]
[ROW][C]41[/C][C]-0.115675[/C][C]-1.2619[/C][C]0.104732[/C][/ROW]
[ROW][C]42[/C][C]0.149567[/C][C]1.6316[/C][C]0.052706[/C][/ROW]
[ROW][C]43[/C][C]-0.021836[/C][C]-0.2382[/C][C]0.406065[/C][/ROW]
[ROW][C]44[/C][C]-0.053563[/C][C]-0.5843[/C][C]0.280063[/C][/ROW]
[ROW][C]45[/C][C]-0.134347[/C][C]-1.4655[/C][C]0.072704[/C][/ROW]
[ROW][C]46[/C][C]0.028934[/C][C]0.3156[/C][C]0.376416[/C][/ROW]
[ROW][C]47[/C][C]-0.03498[/C][C]-0.3816[/C][C]0.351726[/C][/ROW]
[ROW][C]48[/C][C]0.24878[/C][C]2.7139[/C][C]0.003819[/C][/ROW]
[/TABLE]
Source: https://freestatistics.org/blog/index.php?pk=104571&T=1

Globally Unique Identifier (entire table): ba.freestatistics.org/blog/index.php?pk=104571&T=1

As an alternative you can also use a QR Code:  

The GUIDs for individual cells are displayed in the table below:

Autocorrelation Function
Time lag kACF(k)T-STATP-value
1-0.122616-1.33760.091791
2-0.193619-2.11210.018383
3-0.202678-2.2110.014475
4-0.012103-0.1320.447592
5-0.002106-0.0230.490855
60.2321312.53230.006318
70.0151420.16520.434541
8-0.127109-1.38660.084078
9-0.185287-2.02120.022749
10-0.071027-0.77480.219993
11-0.04161-0.45390.325359
120.5172395.64240
13-0.019102-0.20840.417646
14-0.067878-0.74050.230239
15-0.234136-2.55410.005954
160.0363190.39620.346336
17-0.044174-0.48190.315387
180.2194662.39410.009112
190.0007090.00770.496921
20-0.084239-0.91890.179992
21-0.184552-2.01320.023174
22-0.044526-0.48570.314029
230.034690.37840.352893
240.3238573.53290.000293
25-0.017666-0.19270.423756
26-0.134182-1.46380.072948
27-0.117044-1.27680.10208
280.0543420.59280.277218
29-0.077467-0.84510.199884
300.1598721.7440.041871
31-0.0355-0.38730.349628
32-0.037147-0.40520.343019
33-0.131641-1.4360.076809
34-0.031364-0.34210.366424
350.0345710.37710.353375
360.2516082.74470.003498
370.0432850.47220.318829
38-0.189026-2.0620.020691
39-0.000354-0.00390.498462
400.0322490.35180.362808
41-0.115675-1.26190.104732
420.1495671.63160.052706
43-0.021836-0.23820.406065
44-0.053563-0.58430.280063
45-0.134347-1.46550.072704
460.0289340.31560.376416
47-0.03498-0.38160.351726
480.248782.71390.003819


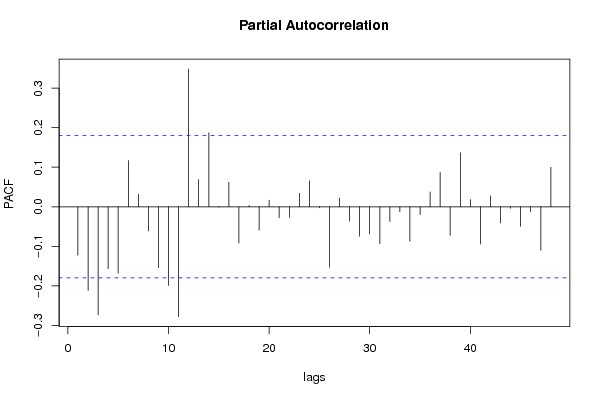
Partial Autocorrelation Function
Time lag kPACF(k)T-STATP-value
1-0.122616-1.33760.091791
2-0.211839-2.31090.01128
3-0.273632-2.9850.001722
4-0.156732-1.70970.04496
5-0.168195-1.83480.034517
60.1167641.27370.102618
70.0319320.34830.364101
8-0.061082-0.66630.253247
9-0.154401-1.68430.047371
10-0.199448-2.17570.015776
11-0.278084-3.03350.001484
120.348663.80340.000113
130.0683130.74520.228807
140.1875412.04580.021488
15-0.001023-0.01120.495558
160.0616710.67270.251207
17-0.091878-1.00230.159124
180.0030810.03360.486622
19-0.058917-0.64270.260826
200.0165430.18050.428547
21-0.02811-0.30660.379823
22-0.026955-0.2940.38462
230.0338370.36910.356347
240.0655980.71560.237824
25-0.002636-0.02880.488554
26-0.153344-1.67280.048498
270.0216490.23620.406855
28-0.036649-0.39980.345013
29-0.074647-0.81430.208549
30-0.069245-0.75540.225758
31-0.093781-1.0230.154184
32-0.037467-0.40870.34174
33-0.012428-0.13560.446195
34-0.087223-0.95150.171643
35-0.019744-0.21540.41492
360.0373870.40780.342059
370.0869460.94850.172406
38-0.07229-0.78860.21596
390.1368021.49230.069129
400.0179240.19550.422659
41-0.09402-1.02560.153572
420.0272210.29690.383512
43-0.041396-0.45160.326197
44-0.003702-0.04040.483927
45-0.049948-0.54490.293431
46-0.01248-0.13610.445972
47-0.110013-1.20010.116243
480.0996431.0870.139623

\begin{tabular}{lllllllll}
\hline
Partial Autocorrelation Function \tabularnewline
Time lag k & PACF(k) & T-STAT & P-value \tabularnewline
1 & -0.122616 & -1.3376 & 0.091791 \tabularnewline
2 & -0.211839 & -2.3109 & 0.01128 \tabularnewline
3 & -0.273632 & -2.985 & 0.001722 \tabularnewline
4 & -0.156732 & -1.7097 & 0.04496 \tabularnewline
5 & -0.168195 & -1.8348 & 0.034517 \tabularnewline
6 & 0.116764 & 1.2737 & 0.102618 \tabularnewline
7 & 0.031932 & 0.3483 & 0.364101 \tabularnewline
8 & -0.061082 & -0.6663 & 0.253247 \tabularnewline
9 & -0.154401 & -1.6843 & 0.047371 \tabularnewline
10 & -0.199448 & -2.1757 & 0.015776 \tabularnewline
11 & -0.278084 & -3.0335 & 0.001484 \tabularnewline
12 & 0.34866 & 3.8034 & 0.000113 \tabularnewline
13 & 0.068313 & 0.7452 & 0.228807 \tabularnewline
14 & 0.187541 & 2.0458 & 0.021488 \tabularnewline
15 & -0.001023 & -0.0112 & 0.495558 \tabularnewline
16 & 0.061671 & 0.6727 & 0.251207 \tabularnewline
17 & -0.091878 & -1.0023 & 0.159124 \tabularnewline
18 & 0.003081 & 0.0336 & 0.486622 \tabularnewline
19 & -0.058917 & -0.6427 & 0.260826 \tabularnewline
20 & 0.016543 & 0.1805 & 0.428547 \tabularnewline
21 & -0.02811 & -0.3066 & 0.379823 \tabularnewline
22 & -0.026955 & -0.294 & 0.38462 \tabularnewline
23 & 0.033837 & 0.3691 & 0.356347 \tabularnewline
24 & 0.065598 & 0.7156 & 0.237824 \tabularnewline
25 & -0.002636 & -0.0288 & 0.488554 \tabularnewline
26 & -0.153344 & -1.6728 & 0.048498 \tabularnewline
27 & 0.021649 & 0.2362 & 0.406855 \tabularnewline
28 & -0.036649 & -0.3998 & 0.345013 \tabularnewline
29 & -0.074647 & -0.8143 & 0.208549 \tabularnewline
30 & -0.069245 & -0.7554 & 0.225758 \tabularnewline
31 & -0.093781 & -1.023 & 0.154184 \tabularnewline
32 & -0.037467 & -0.4087 & 0.34174 \tabularnewline
33 & -0.012428 & -0.1356 & 0.446195 \tabularnewline
34 & -0.087223 & -0.9515 & 0.171643 \tabularnewline
35 & -0.019744 & -0.2154 & 0.41492 \tabularnewline
36 & 0.037387 & 0.4078 & 0.342059 \tabularnewline
37 & 0.086946 & 0.9485 & 0.172406 \tabularnewline
38 & -0.07229 & -0.7886 & 0.21596 \tabularnewline
39 & 0.136802 & 1.4923 & 0.069129 \tabularnewline
40 & 0.017924 & 0.1955 & 0.422659 \tabularnewline
41 & -0.09402 & -1.0256 & 0.153572 \tabularnewline
42 & 0.027221 & 0.2969 & 0.383512 \tabularnewline
43 & -0.041396 & -0.4516 & 0.326197 \tabularnewline
44 & -0.003702 & -0.0404 & 0.483927 \tabularnewline
45 & -0.049948 & -0.5449 & 0.293431 \tabularnewline
46 & -0.01248 & -0.1361 & 0.445972 \tabularnewline
47 & -0.110013 & -1.2001 & 0.116243 \tabularnewline
48 & 0.099643 & 1.087 & 0.139623 \tabularnewline
\hline
\end{tabular}
%Source: https://freestatistics.org/blog/index.php?pk=104571&T=2

[TABLE]
[ROW][C]Partial Autocorrelation Function[/C][/ROW]
[ROW][C]Time lag k[/C][C]PACF(k)[/C][C]T-STAT[/C][C]P-value[/C][/ROW]
[ROW][C]1[/C][C]-0.122616[/C][C]-1.3376[/C][C]0.091791[/C][/ROW]
[ROW][C]2[/C][C]-0.211839[/C][C]-2.3109[/C][C]0.01128[/C][/ROW]
[ROW][C]3[/C][C]-0.273632[/C][C]-2.985[/C][C]0.001722[/C][/ROW]
[ROW][C]4[/C][C]-0.156732[/C][C]-1.7097[/C][C]0.04496[/C][/ROW]
[ROW][C]5[/C][C]-0.168195[/C][C]-1.8348[/C][C]0.034517[/C][/ROW]
[ROW][C]6[/C][C]0.116764[/C][C]1.2737[/C][C]0.102618[/C][/ROW]
[ROW][C]7[/C][C]0.031932[/C][C]0.3483[/C][C]0.364101[/C][/ROW]
[ROW][C]8[/C][C]-0.061082[/C][C]-0.6663[/C][C]0.253247[/C][/ROW]
[ROW][C]9[/C][C]-0.154401[/C][C]-1.6843[/C][C]0.047371[/C][/ROW]
[ROW][C]10[/C][C]-0.199448[/C][C]-2.1757[/C][C]0.015776[/C][/ROW]
[ROW][C]11[/C][C]-0.278084[/C][C]-3.0335[/C][C]0.001484[/C][/ROW]
[ROW][C]12[/C][C]0.34866[/C][C]3.8034[/C][C]0.000113[/C][/ROW]
[ROW][C]13[/C][C]0.068313[/C][C]0.7452[/C][C]0.228807[/C][/ROW]
[ROW][C]14[/C][C]0.187541[/C][C]2.0458[/C][C]0.021488[/C][/ROW]
[ROW][C]15[/C][C]-0.001023[/C][C]-0.0112[/C][C]0.495558[/C][/ROW]
[ROW][C]16[/C][C]0.061671[/C][C]0.6727[/C][C]0.251207[/C][/ROW]
[ROW][C]17[/C][C]-0.091878[/C][C]-1.0023[/C][C]0.159124[/C][/ROW]
[ROW][C]18[/C][C]0.003081[/C][C]0.0336[/C][C]0.486622[/C][/ROW]
[ROW][C]19[/C][C]-0.058917[/C][C]-0.6427[/C][C]0.260826[/C][/ROW]
[ROW][C]20[/C][C]0.016543[/C][C]0.1805[/C][C]0.428547[/C][/ROW]
[ROW][C]21[/C][C]-0.02811[/C][C]-0.3066[/C][C]0.379823[/C][/ROW]
[ROW][C]22[/C][C]-0.026955[/C][C]-0.294[/C][C]0.38462[/C][/ROW]
[ROW][C]23[/C][C]0.033837[/C][C]0.3691[/C][C]0.356347[/C][/ROW]
[ROW][C]24[/C][C]0.065598[/C][C]0.7156[/C][C]0.237824[/C][/ROW]
[ROW][C]25[/C][C]-0.002636[/C][C]-0.0288[/C][C]0.488554[/C][/ROW]
[ROW][C]26[/C][C]-0.153344[/C][C]-1.6728[/C][C]0.048498[/C][/ROW]
[ROW][C]27[/C][C]0.021649[/C][C]0.2362[/C][C]0.406855[/C][/ROW]
[ROW][C]28[/C][C]-0.036649[/C][C]-0.3998[/C][C]0.345013[/C][/ROW]
[ROW][C]29[/C][C]-0.074647[/C][C]-0.8143[/C][C]0.208549[/C][/ROW]
[ROW][C]30[/C][C]-0.069245[/C][C]-0.7554[/C][C]0.225758[/C][/ROW]
[ROW][C]31[/C][C]-0.093781[/C][C]-1.023[/C][C]0.154184[/C][/ROW]
[ROW][C]32[/C][C]-0.037467[/C][C]-0.4087[/C][C]0.34174[/C][/ROW]
[ROW][C]33[/C][C]-0.012428[/C][C]-0.1356[/C][C]0.446195[/C][/ROW]
[ROW][C]34[/C][C]-0.087223[/C][C]-0.9515[/C][C]0.171643[/C][/ROW]
[ROW][C]35[/C][C]-0.019744[/C][C]-0.2154[/C][C]0.41492[/C][/ROW]
[ROW][C]36[/C][C]0.037387[/C][C]0.4078[/C][C]0.342059[/C][/ROW]
[ROW][C]37[/C][C]0.086946[/C][C]0.9485[/C][C]0.172406[/C][/ROW]
[ROW][C]38[/C][C]-0.07229[/C][C]-0.7886[/C][C]0.21596[/C][/ROW]
[ROW][C]39[/C][C]0.136802[/C][C]1.4923[/C][C]0.069129[/C][/ROW]
[ROW][C]40[/C][C]0.017924[/C][C]0.1955[/C][C]0.422659[/C][/ROW]
[ROW][C]41[/C][C]-0.09402[/C][C]-1.0256[/C][C]0.153572[/C][/ROW]
[ROW][C]42[/C][C]0.027221[/C][C]0.2969[/C][C]0.383512[/C][/ROW]
[ROW][C]43[/C][C]-0.041396[/C][C]-0.4516[/C][C]0.326197[/C][/ROW]
[ROW][C]44[/C][C]-0.003702[/C][C]-0.0404[/C][C]0.483927[/C][/ROW]
[ROW][C]45[/C][C]-0.049948[/C][C]-0.5449[/C][C]0.293431[/C][/ROW]
[ROW][C]46[/C][C]-0.01248[/C][C]-0.1361[/C][C]0.445972[/C][/ROW]
[ROW][C]47[/C][C]-0.110013[/C][C]-1.2001[/C][C]0.116243[/C][/ROW]
[ROW][C]48[/C][C]0.099643[/C][C]1.087[/C][C]0.139623[/C][/ROW]
[/TABLE]
Source: https://freestatistics.org/blog/index.php?pk=104571&T=2

Globally Unique Identifier (entire table): ba.freestatistics.org/blog/index.php?pk=104571&T=2

As an alternative you can also use a QR Code:  

The GUIDs for individual cells are displayed in the table below:

Partial Autocorrelation Function
Time lag kPACF(k)T-STATP-value
1-0.122616-1.33760.091791
2-0.211839-2.31090.01128
3-0.273632-2.9850.001722
4-0.156732-1.70970.04496
5-0.168195-1.83480.034517
60.1167641.27370.102618
70.0319320.34830.364101
8-0.061082-0.66630.253247
9-0.154401-1.68430.047371
10-0.199448-2.17570.015776
11-0.278084-3.03350.001484
120.348663.80340.000113
130.0683130.74520.228807
140.1875412.04580.021488
15-0.001023-0.01120.495558
160.0616710.67270.251207
17-0.091878-1.00230.159124
180.0030810.03360.486622
19-0.058917-0.64270.260826
200.0165430.18050.428547
21-0.02811-0.30660.379823
22-0.026955-0.2940.38462
230.0338370.36910.356347
240.0655980.71560.237824
25-0.002636-0.02880.488554
26-0.153344-1.67280.048498
270.0216490.23620.406855
28-0.036649-0.39980.345013
29-0.074647-0.81430.208549
30-0.069245-0.75540.225758
31-0.093781-1.0230.154184
32-0.037467-0.40870.34174
33-0.012428-0.13560.446195
34-0.087223-0.95150.171643
35-0.019744-0.21540.41492
360.0373870.40780.342059
370.0869460.94850.172406
38-0.07229-0.78860.21596
390.1368021.49230.069129
400.0179240.19550.422659
41-0.09402-1.02560.153572
420.0272210.29690.383512
43-0.041396-0.45160.326197
44-0.003702-0.04040.483927
45-0.049948-0.54490.293431
46-0.01248-0.13610.445972
47-0.110013-1.20010.116243
480.0996431.0870.139623


Parameters (Session):
par1 = Default ; par2 = 1 ; par3 = 0 ; par4 = 0 ; par5 = 12 ; par6 = White Noise ; par7 = 0.95 ;
Parameters (R input):
par1 = 48 ; par2 = 1 ; par3 = 1 ; par4 = 0 ; par5 = 12 ; par6 = White Noise ; par7 = 0.95 ;
R code (references can be found in the software module):
if (par1 == 'Default') {
par1 = 10*log10(length(x))
} else {
par1 <- as.numeric(par1)
}
par2 <- as.numeric(par2)
par3 <- as.numeric(par3)
par4 <- as.numeric(par4)
par5 <- as.numeric(par5)
if (par6 == 'White Noise') par6 <- 'white' else par6 <- 'ma'
par7 <- as.numeric(par7)
if (par2 == 0) {
x <- log(x)
} else {
x <- (x ^ par2 - 1) / par2
}
if (par3 > 0) x <- diff(x,lag=1,difference=par3)
if (par4 > 0) x <- diff(x,lag=par5,difference=par4)
bitmap(file='pic1.png')
racf <- acf(x, par1, main='Autocorrelation', xlab='time lag', ylab='ACF', ci.type=par6, ci=par7, sub=paste('(lambda=',par2,', d=',par3,', D=',par4,', CI=', par7, ', CI type=',par6,')',sep=''))
dev.off()
bitmap(file='pic2.png')
rpacf <- pacf(x,par1,main='Partial Autocorrelation',xlab='lags',ylab='PACF')
dev.off()
(myacf <- c(racf$acf))
(mypacf <- c(rpacf$acf))
lengthx <- length(x)
sqrtn <- sqrt(lengthx)
load(file='createtable')
a<-table.start()
a<-table.row.start(a)
a<-table.element(a,'Autocorrelation Function',4,TRUE)
a<-table.row.end(a)
a<-table.row.start(a)
a<-table.element(a,'Time lag k',header=TRUE)
a<-table.element(a,hyperlink('basics.htm','ACF(k)','click here for more information about the Autocorrelation Function'),header=TRUE)
a<-table.element(a,'T-STAT',header=TRUE)
a<-table.element(a,'P-value',header=TRUE)
a<-table.row.end(a)
for (i in 2:(par1+1)) {
a<-table.row.start(a)
a<-table.element(a,i-1,header=TRUE)
a<-table.element(a,round(myacf[i],6))
mytstat <- myacf[i]*sqrtn
a<-table.element(a,round(mytstat,4))
a<-table.element(a,round(1-pt(abs(mytstat),lengthx),6))
a<-table.row.end(a)
}
a<-table.end(a)
table.save(a,file='mytable.tab')
a<-table.start()
a<-table.row.start(a)
a<-table.element(a,'Partial Autocorrelation Function',4,TRUE)
a<-table.row.end(a)
a<-table.row.start(a)
a<-table.element(a,'Time lag k',header=TRUE)
a<-table.element(a,hyperlink('basics.htm','PACF(k)','click here for more information about the Partial Autocorrelation Function'),header=TRUE)
a<-table.element(a,'T-STAT',header=TRUE)
a<-table.element(a,'P-value',header=TRUE)
a<-table.row.end(a)
for (i in 1:par1) {
a<-table.row.start(a)
a<-table.element(a,i,header=TRUE)
a<-table.element(a,round(mypacf[i],6))
mytstat <- mypacf[i]*sqrtn
a<-table.element(a,round(mytstat,4))
a<-table.element(a,round(1-pt(abs(mytstat),lengthx),6))
a<-table.row.end(a)
}
a<-table.end(a)
table.save(a,file='mytable1.tab')