Free Statistics

of Irreproducible Research!

Author's title

Author*The author of this computation has been verified*
R Software Modulerwasp_autocorrelation.wasp
Title produced by software(Partial) Autocorrelation Function
Date of computationFri, 03 Dec 2010 08:24:33 +0000
Cite this page as followsStatistical Computations at FreeStatistics.org, Office for Research Development and Education, URL https://freestatistics.org/blog/index.php?v=date/2010/Dec/03/t1291364604452vbeq97y76awd.htm/, Retrieved Wed, 08 May 2024 00:51:37 +0000
Statistical Computations at FreeStatistics.org, Office for Research Development and Education, URL https://freestatistics.org/blog/index.php?pk=104534, Retrieved Wed, 08 May 2024 00:51:37 +0000
QR Codes:

Original text written by user:
IsPrivate?No (this computation is public)
User-defined keywords
Estimated Impact210
Family? (F = Feedback message, R = changed R code, M = changed R Module, P = changed Parameters, D = changed Data)
-     [Univariate Data Series] [data set] [2008-12-01 19:54:57] [b98453cac15ba1066b407e146608df68]
- RMP   [(Partial) Autocorrelation Function] [Unemployment] [2010-11-29 09:05:21] [b98453cac15ba1066b407e146608df68]
F    D      [(Partial) Autocorrelation Function] [] [2010-12-03 08:24:33] [dcc54e7e6e8c80b7c45e040080afe6ab] [Current]
- RMPD        [Pearson Correlation] [] [2010-12-10 15:11:22] [1251ac2db27b84d4a3ba43449388906b]
-   P         [(Partial) Autocorrelation Function] [WS 9 Autocorrelat...] [2010-12-10 23:54:01] [74be16979710d4c4e7c6647856088456]
-   P         [(Partial) Autocorrelation Function] [WS 9 Cumulatieve ...] [2010-12-10 23:54:01] [8081b8996d5947580de3eb171e82db4f]
Feedback Forum
2010-12-13 09:56:36 [Stefanie Van Esbroeck] [reply
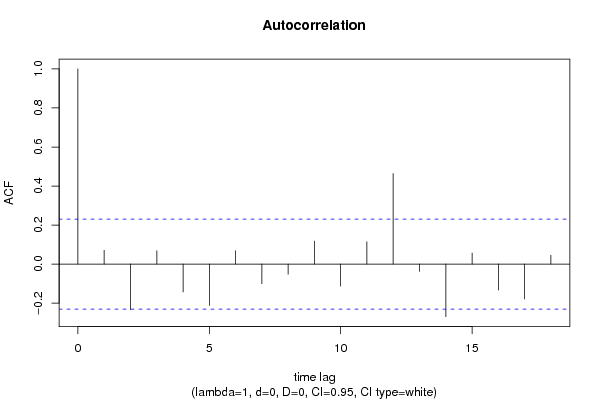
Bij deze berekening valt het mij op dat de student wel time lags heeft ingesteld maar dat hij/zij deze niet groot genoeg heeft ingesteld.Om een duidelijker beeld te vormen en omdat er seizoenaliteit in de tijdreeks aanwezig is, is het beter dat je de time lags instelt op bijvoorbeeld 48. Hieronder kun je een link terugvinden waar dit wel is gebeurd: http://www.freestatistics.org/blog/index.php?v=date/2010/Dec/13/t1292233839ikruvna8zaw0mte.htm/ In deze berekening zal je opmerken dat de waarden positief zijn op de lags 12,24,36 en 48. Je interpretatie van de output is wel correct. Je merkt goed op dat de gegevens geen lange termijn trend bevatten en dat je dan in je volgende berekening de klein d gelijk moet stellen aan 0. Ook je interpretatie over de seizoenaliteit is correct.

Post a new message
Dataseries X:
46
62
66
59
58
61
41
27
58
70
49
59
44
36
72
45
56
54
53
35
61
52
47
51
52
63
74
45
51
64
36
30
55
64
39
40
63
45
59
55
40
64
27
28
45
57
45
69
60
56
58
50
51
53
37
22
55
70
62
58
39
49
58
47
42
62
39
40
72
70
54
65


Summary of computational transaction
Raw Inputview raw input (R code)
Raw Outputview raw output of R engine
Computing time1 seconds
R Server'Gwilym Jenkins' @ 72.249.127.135

\begin{tabular}{lllllllll}
\hline
Summary of computational transaction \tabularnewline
Raw Input & view raw input (R code)  \tabularnewline
Raw Output & view raw output of R engine  \tabularnewline
Computing time & 1 seconds \tabularnewline
R Server & 'Gwilym Jenkins' @ 72.249.127.135 \tabularnewline
\hline
\end{tabular}
%Source: https://freestatistics.org/blog/index.php?pk=104534&T=0

[TABLE]
[ROW][C]Summary of computational transaction[/C][/ROW]
[ROW][C]Raw Input[/C][C]view raw input (R code) [/C][/ROW]
[ROW][C]Raw Output[/C][C]view raw output of R engine [/C][/ROW]
[ROW][C]Computing time[/C][C]1 seconds[/C][/ROW]
[ROW][C]R Server[/C][C]'Gwilym Jenkins' @ 72.249.127.135[/C][/ROW]
[/TABLE]
Source: https://freestatistics.org/blog/index.php?pk=104534&T=0

Globally Unique Identifier (entire table): ba.freestatistics.org/blog/index.php?pk=104534&T=0

As an alternative you can also use a QR Code:  

The GUIDs for individual cells are displayed in the table below:

Summary of computational transaction
Raw Inputview raw input (R code)
Raw Outputview raw output of R engine
Computing time1 seconds
R Server'Gwilym Jenkins' @ 72.249.127.135


Autocorrelation Function
Time lag kACF(k)T-STATP-value
10.0703190.59670.276298
2-0.233976-1.98540.025457
30.0681120.57790.282551
4-0.142495-1.20910.115287
5-0.211961-1.79850.038141
60.0689130.58470.280274
7-0.1007-0.85450.19784
8-0.052042-0.44160.330054
90.1182471.00340.159524
10-0.112644-0.95580.171181
110.1140180.96750.168272
120.463813.93569.5e-05
13-0.037397-0.31730.375959
14-0.269423-2.28610.012595
150.0568020.4820.31564
16-0.133191-1.13020.131079
17-0.178608-1.51550.067008
180.0454740.38590.35037

\begin{tabular}{lllllllll}
\hline
Autocorrelation Function \tabularnewline
Time lag k & ACF(k) & T-STAT & P-value \tabularnewline
1 & 0.070319 & 0.5967 & 0.276298 \tabularnewline
2 & -0.233976 & -1.9854 & 0.025457 \tabularnewline
3 & 0.068112 & 0.5779 & 0.282551 \tabularnewline
4 & -0.142495 & -1.2091 & 0.115287 \tabularnewline
5 & -0.211961 & -1.7985 & 0.038141 \tabularnewline
6 & 0.068913 & 0.5847 & 0.280274 \tabularnewline
7 & -0.1007 & -0.8545 & 0.19784 \tabularnewline
8 & -0.052042 & -0.4416 & 0.330054 \tabularnewline
9 & 0.118247 & 1.0034 & 0.159524 \tabularnewline
10 & -0.112644 & -0.9558 & 0.171181 \tabularnewline
11 & 0.114018 & 0.9675 & 0.168272 \tabularnewline
12 & 0.46381 & 3.9356 & 9.5e-05 \tabularnewline
13 & -0.037397 & -0.3173 & 0.375959 \tabularnewline
14 & -0.269423 & -2.2861 & 0.012595 \tabularnewline
15 & 0.056802 & 0.482 & 0.31564 \tabularnewline
16 & -0.133191 & -1.1302 & 0.131079 \tabularnewline
17 & -0.178608 & -1.5155 & 0.067008 \tabularnewline
18 & 0.045474 & 0.3859 & 0.35037 \tabularnewline
\hline
\end{tabular}
%Source: https://freestatistics.org/blog/index.php?pk=104534&T=1

[TABLE]
[ROW][C]Autocorrelation Function[/C][/ROW]
[ROW][C]Time lag k[/C][C]ACF(k)[/C][C]T-STAT[/C][C]P-value[/C][/ROW]
[ROW][C]1[/C][C]0.070319[/C][C]0.5967[/C][C]0.276298[/C][/ROW]
[ROW][C]2[/C][C]-0.233976[/C][C]-1.9854[/C][C]0.025457[/C][/ROW]
[ROW][C]3[/C][C]0.068112[/C][C]0.5779[/C][C]0.282551[/C][/ROW]
[ROW][C]4[/C][C]-0.142495[/C][C]-1.2091[/C][C]0.115287[/C][/ROW]
[ROW][C]5[/C][C]-0.211961[/C][C]-1.7985[/C][C]0.038141[/C][/ROW]
[ROW][C]6[/C][C]0.068913[/C][C]0.5847[/C][C]0.280274[/C][/ROW]
[ROW][C]7[/C][C]-0.1007[/C][C]-0.8545[/C][C]0.19784[/C][/ROW]
[ROW][C]8[/C][C]-0.052042[/C][C]-0.4416[/C][C]0.330054[/C][/ROW]
[ROW][C]9[/C][C]0.118247[/C][C]1.0034[/C][C]0.159524[/C][/ROW]
[ROW][C]10[/C][C]-0.112644[/C][C]-0.9558[/C][C]0.171181[/C][/ROW]
[ROW][C]11[/C][C]0.114018[/C][C]0.9675[/C][C]0.168272[/C][/ROW]
[ROW][C]12[/C][C]0.46381[/C][C]3.9356[/C][C]9.5e-05[/C][/ROW]
[ROW][C]13[/C][C]-0.037397[/C][C]-0.3173[/C][C]0.375959[/C][/ROW]
[ROW][C]14[/C][C]-0.269423[/C][C]-2.2861[/C][C]0.012595[/C][/ROW]
[ROW][C]15[/C][C]0.056802[/C][C]0.482[/C][C]0.31564[/C][/ROW]
[ROW][C]16[/C][C]-0.133191[/C][C]-1.1302[/C][C]0.131079[/C][/ROW]
[ROW][C]17[/C][C]-0.178608[/C][C]-1.5155[/C][C]0.067008[/C][/ROW]
[ROW][C]18[/C][C]0.045474[/C][C]0.3859[/C][C]0.35037[/C][/ROW]
[/TABLE]
Source: https://freestatistics.org/blog/index.php?pk=104534&T=1

Globally Unique Identifier (entire table): ba.freestatistics.org/blog/index.php?pk=104534&T=1

As an alternative you can also use a QR Code:  

The GUIDs for individual cells are displayed in the table below:

Autocorrelation Function
Time lag kACF(k)T-STATP-value
10.0703190.59670.276298
2-0.233976-1.98540.025457
30.0681120.57790.282551
4-0.142495-1.20910.115287
5-0.211961-1.79850.038141
60.0689130.58470.280274
7-0.1007-0.85450.19784
8-0.052042-0.44160.330054
90.1182471.00340.159524
10-0.112644-0.95580.171181
110.1140180.96750.168272
120.463813.93569.5e-05
13-0.037397-0.31730.375959
14-0.269423-2.28610.012595
150.0568020.4820.31564
16-0.133191-1.13020.131079
17-0.178608-1.51550.067008
180.0454740.38590.35037


Partial Autocorrelation Function
Time lag kPACF(k)T-STATP-value
10.0703190.59670.276298
2-0.240108-2.03740.022644
30.1124030.95380.171694
4-0.234004-1.98560.025444
5-0.139325-1.18220.120506
60.0042840.03630.485553
7-0.202861-1.72130.044743
8-0.002173-0.01840.492671
9-0.036368-0.30860.379261
10-0.176649-1.49890.069134
110.1792881.52130.066281
120.3495422.9660.002046
13-0.013446-0.11410.45474
14-0.12453-1.05670.147096
150.0442190.37520.354303
16-0.059446-0.50440.307754
17-0.030484-0.25870.398315
18-0.083966-0.71250.239237

\begin{tabular}{lllllllll}
\hline
Partial Autocorrelation Function \tabularnewline
Time lag k & PACF(k) & T-STAT & P-value \tabularnewline
1 & 0.070319 & 0.5967 & 0.276298 \tabularnewline
2 & -0.240108 & -2.0374 & 0.022644 \tabularnewline
3 & 0.112403 & 0.9538 & 0.171694 \tabularnewline
4 & -0.234004 & -1.9856 & 0.025444 \tabularnewline
5 & -0.139325 & -1.1822 & 0.120506 \tabularnewline
6 & 0.004284 & 0.0363 & 0.485553 \tabularnewline
7 & -0.202861 & -1.7213 & 0.044743 \tabularnewline
8 & -0.002173 & -0.0184 & 0.492671 \tabularnewline
9 & -0.036368 & -0.3086 & 0.379261 \tabularnewline
10 & -0.176649 & -1.4989 & 0.069134 \tabularnewline
11 & 0.179288 & 1.5213 & 0.066281 \tabularnewline
12 & 0.349542 & 2.966 & 0.002046 \tabularnewline
13 & -0.013446 & -0.1141 & 0.45474 \tabularnewline
14 & -0.12453 & -1.0567 & 0.147096 \tabularnewline
15 & 0.044219 & 0.3752 & 0.354303 \tabularnewline
16 & -0.059446 & -0.5044 & 0.307754 \tabularnewline
17 & -0.030484 & -0.2587 & 0.398315 \tabularnewline
18 & -0.083966 & -0.7125 & 0.239237 \tabularnewline
\hline
\end{tabular}
%Source: https://freestatistics.org/blog/index.php?pk=104534&T=2

[TABLE]
[ROW][C]Partial Autocorrelation Function[/C][/ROW]
[ROW][C]Time lag k[/C][C]PACF(k)[/C][C]T-STAT[/C][C]P-value[/C][/ROW]
[ROW][C]1[/C][C]0.070319[/C][C]0.5967[/C][C]0.276298[/C][/ROW]
[ROW][C]2[/C][C]-0.240108[/C][C]-2.0374[/C][C]0.022644[/C][/ROW]
[ROW][C]3[/C][C]0.112403[/C][C]0.9538[/C][C]0.171694[/C][/ROW]
[ROW][C]4[/C][C]-0.234004[/C][C]-1.9856[/C][C]0.025444[/C][/ROW]
[ROW][C]5[/C][C]-0.139325[/C][C]-1.1822[/C][C]0.120506[/C][/ROW]
[ROW][C]6[/C][C]0.004284[/C][C]0.0363[/C][C]0.485553[/C][/ROW]
[ROW][C]7[/C][C]-0.202861[/C][C]-1.7213[/C][C]0.044743[/C][/ROW]
[ROW][C]8[/C][C]-0.002173[/C][C]-0.0184[/C][C]0.492671[/C][/ROW]
[ROW][C]9[/C][C]-0.036368[/C][C]-0.3086[/C][C]0.379261[/C][/ROW]
[ROW][C]10[/C][C]-0.176649[/C][C]-1.4989[/C][C]0.069134[/C][/ROW]
[ROW][C]11[/C][C]0.179288[/C][C]1.5213[/C][C]0.066281[/C][/ROW]
[ROW][C]12[/C][C]0.349542[/C][C]2.966[/C][C]0.002046[/C][/ROW]
[ROW][C]13[/C][C]-0.013446[/C][C]-0.1141[/C][C]0.45474[/C][/ROW]
[ROW][C]14[/C][C]-0.12453[/C][C]-1.0567[/C][C]0.147096[/C][/ROW]
[ROW][C]15[/C][C]0.044219[/C][C]0.3752[/C][C]0.354303[/C][/ROW]
[ROW][C]16[/C][C]-0.059446[/C][C]-0.5044[/C][C]0.307754[/C][/ROW]
[ROW][C]17[/C][C]-0.030484[/C][C]-0.2587[/C][C]0.398315[/C][/ROW]
[ROW][C]18[/C][C]-0.083966[/C][C]-0.7125[/C][C]0.239237[/C][/ROW]
[/TABLE]
Source: https://freestatistics.org/blog/index.php?pk=104534&T=2

Globally Unique Identifier (entire table): ba.freestatistics.org/blog/index.php?pk=104534&T=2

As an alternative you can also use a QR Code:  

The GUIDs for individual cells are displayed in the table below:

Partial Autocorrelation Function
Time lag kPACF(k)T-STATP-value
10.0703190.59670.276298
2-0.240108-2.03740.022644
30.1124030.95380.171694
4-0.234004-1.98560.025444
5-0.139325-1.18220.120506
60.0042840.03630.485553
7-0.202861-1.72130.044743
8-0.002173-0.01840.492671
9-0.036368-0.30860.379261
10-0.176649-1.49890.069134
110.1792881.52130.066281
120.3495422.9660.002046
13-0.013446-0.11410.45474
14-0.12453-1.05670.147096
150.0442190.37520.354303
16-0.059446-0.50440.307754
17-0.030484-0.25870.398315
18-0.083966-0.71250.239237


Parameters (Session):
par1 = Default ; par2 = 1 ; par3 = 0 ; par4 = 0 ; par5 = 12 ; par6 = White Noise ; par7 = 0.95 ;
Parameters (R input):
par1 = Default ; par2 = 1 ; par3 = 0 ; par4 = 0 ; par5 = 12 ; par6 = White Noise ; par7 = 0.95 ;
R code (references can be found in the software module):
if (par1 == 'Default') {
par1 = 10*log10(length(x))
} else {
par1 <- as.numeric(par1)
}
par2 <- as.numeric(par2)
par3 <- as.numeric(par3)
par4 <- as.numeric(par4)
par5 <- as.numeric(par5)
if (par6 == 'White Noise') par6 <- 'white' else par6 <- 'ma'
par7 <- as.numeric(par7)
if (par2 == 0) {
x <- log(x)
} else {
x <- (x ^ par2 - 1) / par2
}
if (par3 > 0) x <- diff(x,lag=1,difference=par3)
if (par4 > 0) x <- diff(x,lag=par5,difference=par4)
bitmap(file='pic1.png')
racf <- acf(x, par1, main='Autocorrelation', xlab='time lag', ylab='ACF', ci.type=par6, ci=par7, sub=paste('(lambda=',par2,', d=',par3,', D=',par4,', CI=', par7, ', CI type=',par6,')',sep=''))
dev.off()
bitmap(file='pic2.png')
rpacf <- pacf(x,par1,main='Partial Autocorrelation',xlab='lags',ylab='PACF')
dev.off()
(myacf <- c(racf$acf))
(mypacf <- c(rpacf$acf))
lengthx <- length(x)
sqrtn <- sqrt(lengthx)
load(file='createtable')
a<-table.start()
a<-table.row.start(a)
a<-table.element(a,'Autocorrelation Function',4,TRUE)
a<-table.row.end(a)
a<-table.row.start(a)
a<-table.element(a,'Time lag k',header=TRUE)
a<-table.element(a,hyperlink('basics.htm','ACF(k)','click here for more information about the Autocorrelation Function'),header=TRUE)
a<-table.element(a,'T-STAT',header=TRUE)
a<-table.element(a,'P-value',header=TRUE)
a<-table.row.end(a)
for (i in 2:(par1+1)) {
a<-table.row.start(a)
a<-table.element(a,i-1,header=TRUE)
a<-table.element(a,round(myacf[i],6))
mytstat <- myacf[i]*sqrtn
a<-table.element(a,round(mytstat,4))
a<-table.element(a,round(1-pt(abs(mytstat),lengthx),6))
a<-table.row.end(a)
}
a<-table.end(a)
table.save(a,file='mytable.tab')
a<-table.start()
a<-table.row.start(a)
a<-table.element(a,'Partial Autocorrelation Function',4,TRUE)
a<-table.row.end(a)
a<-table.row.start(a)
a<-table.element(a,'Time lag k',header=TRUE)
a<-table.element(a,hyperlink('basics.htm','PACF(k)','click here for more information about the Partial Autocorrelation Function'),header=TRUE)
a<-table.element(a,'T-STAT',header=TRUE)
a<-table.element(a,'P-value',header=TRUE)
a<-table.row.end(a)
for (i in 1:par1) {
a<-table.row.start(a)
a<-table.element(a,i,header=TRUE)
a<-table.element(a,round(mypacf[i],6))
mytstat <- mypacf[i]*sqrtn
a<-table.element(a,round(mytstat,4))
a<-table.element(a,round(1-pt(abs(mytstat),lengthx),6))
a<-table.row.end(a)
}
a<-table.end(a)
table.save(a,file='mytable1.tab')