| Multiple Linear Regression - Estimated Regression Equation |
| Totaal[t] = -12.6450584188877 + 275.169286301869Dummy[t] + 0.29523736946469vertraging1[t] + 0.456063770979032vertraging2[t] + 0.149937295128415vertraging3[t] -322.735387706527M1[t] -968.227700030195M2[t] -453.002567742199M3[t] + 722.890840676447M4[t] + 343.955904339616M5[t] -216.469081464292M6[t] -28.0228331351933M7[t] + 394.064402937318M8[t] + 309.907158270251M9[t] -1185.56832625582M10[t] + 166.465422769620M11[t] -2.80813744948333t + e[t] |
| Multiple Linear Regression - Ordinary Least Squares | |||||
| Variable | Parameter | S.D. | T-STAT H0: parameter = 0 | 2-tail p-value | 1-tail p-value |
| (Intercept) | -12.6450584188877 | 344.360516 | -0.0367 | 0.970951 | 0.485476 |
| Dummy | 275.169286301869 | 281.792039 | 0.9765 | 0.336627 | 0.168313 |
| vertraging1 | 0.29523736946469 | 0.183224 | 1.6113 | 0.117577 | 0.058788 |
| vertraging2 | 0.456063770979032 | 0.173782 | 2.6243 | 0.013523 | 0.006762 |
| vertraging3 | 0.149937295128415 | 0.183595 | 0.8167 | 0.420552 | 0.210276 |
| M1 | -322.735387706527 | 498.772024 | -0.6471 | 0.522514 | 0.261257 |
| M2 | -968.227700030195 | 389.349342 | -2.4868 | 0.01868 | 0.00934 |
| M3 | -453.002567742199 | 415.49054 | -1.0903 | 0.284268 | 0.142134 |
| M4 | 722.890840676447 | 367.378619 | 1.9677 | 0.058408 | 0.029204 |
| M5 | 343.955904339616 | 433.583111 | 0.7933 | 0.43384 | 0.21692 |
| M6 | -216.469081464292 | 472.947964 | -0.4577 | 0.650465 | 0.325232 |
| M7 | -28.0228331351933 | 395.255413 | -0.0709 | 0.943949 | 0.471975 |
| M8 | 394.064402937318 | 386.521762 | 1.0195 | 0.316111 | 0.158055 |
| M9 | 309.907158270251 | 420.322843 | 0.7373 | 0.466663 | 0.233332 |
| M10 | -1185.56832625582 | 438.541996 | -2.7034 | 0.011192 | 0.005596 |
| M11 | 166.465422769620 | 478.106533 | 0.3482 | 0.730139 | 0.36507 |
| t | -2.80813744948333 | 10.561076 | -0.2659 | 0.792139 | 0.396069 |
| Multiple Linear Regression - Regression Statistics | |
| Multiple R | 0.86614625861463 |
| R-squared | 0.750209341312121 |
| Adjusted R-squared | 0.616987656678586 |
| F-TEST (value) | 5.63128550262511 |
| F-TEST (DF numerator) | 16 |
| F-TEST (DF denominator) | 30 |
| p-value | 2.44282330922330e-05 |
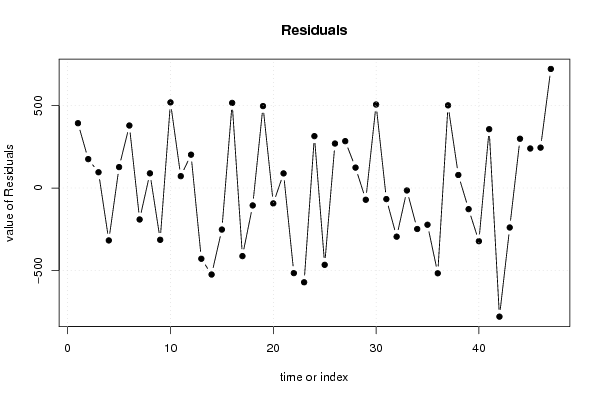
| Multiple Linear Regression - Residual Statistics | |
| Residual Standard Deviation | 441.620383129706 |
| Sum Squared Residuals | 5850856.88386886 |
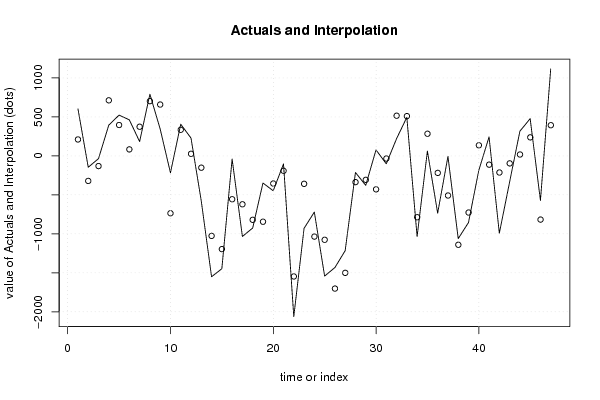
| Multiple Linear Regression - Actuals, Interpolation, and Residuals | |||
| Time or Index | Actuals | Interpolation Forecast | Residuals Prediction Error |
| 1 | 603.6 | 210.728585229132 | 392.871414770868 |
| 2 | -145.8 | -321.088542952958 | 175.288542952958 |
| 3 | -35.1 | -130.629063017799 | 95.5290630177994 |
| 4 | 395.1 | 712.658454322183 | -317.558454322183 |
| 5 | 523.1 | 396.049747357724 | 127.050252642276 |
| 6 | 462.3 | 83.4037002417086 | 378.896299758291 |
| 7 | 183.4 | 373.97056610743 | -190.57056610743 |
| 8 | 791.5 | 702.371258887669 | 89.1287411123312 |
| 9 | 344.8 | 658.627347872737 | -313.827347872737 |
| 10 | -217 | -736.023939521666 | 519.023939521666 |
| 11 | 406.7 | 334.790500560289 | 71.9094994397113 |
| 12 | 228.6 | 26.4628714064295 | 202.137128593571 |
| 13 | -580.1 | -151.450227694763 | -428.649772305237 |
| 14 | -1550.4 | -1026.21820479378 | -524.181795206217 |
| 15 | -1447.5 | -1195.79263339997 | -251.707366600028 |
| 16 | -40.1 | -556.100404664197 | 516.000404664197 |
| 17 | -1033.5 | -620.881600095266 | -412.618399904734 |
| 18 | -925.6 | -820.110827230277 | -105.489172769724 |
| 19 | -347.8 | -844.64860511226 | 496.84860511226 |
| 20 | -447.7 | -354.519782504464 | -93.1802174955358 |
| 21 | -102.6 | -191.287496814496 | 88.687496814496 |
| 22 | -2062.2 | -1546.6117041834 | -515.588295816601 |
| 23 | -929.7 | -358.355083927040 | -571.34491607296 |
| 24 | -720.7 | -1035.23152828908 | 314.531528289077 |
| 25 | -1541.8 | -1076.39534612685 | -465.404653873146 |
| 26 | -1432.3 | -1701.99388509992 | 269.693885099915 |
| 27 | -1216.2 | -1500.38546597406 | 284.185465974064 |
| 28 | -212.8 | -336.673929571319 | 123.873929571319 |
| 29 | -378.2 | -307.202312111633 | -70.9976878883672 |
| 30 | 76.9 | -429.251858996873 | 506.151858996873 |
| 31 | -101.3 | -34.2370870619575 | -67.0629129380425 |
| 32 | 220.4 | 515.185705880781 | -294.785705880781 |
| 33 | 495.6 | 510.164084545499 | -14.5640845454994 |
| 34 | -1035.2 | -786.873324221307 | -248.326675778693 |
| 35 | 61.8 | 284.146499794348 | -222.346499794348 |
| 36 | -734.8 | -218.131343117353 | -516.668656882647 |
| 37 | -6.9 | -508.083011407514 | 501.183011407514 |
| 38 | -1061.1 | -1140.29936715334 | 79.1993671533435 |
| 39 | -854.6 | -726.592837608164 | -128.007162391836 |
| 40 | -186.5 | 135.815879913334 | -322.315879913334 |
| 41 | 244 | -112.565835150826 | 356.565835150826 |
| 42 | -992.6 | -213.041014014559 | -779.55898598544 |
| 43 | -335.2 | -95.9848739332123 | -239.215126066788 |
| 44 | 316.8 | 17.9628177360146 | 298.837182263985 |
| 45 | 477.6 | 237.896064396260 | 239.703935603740 |
| 46 | -572.1 | -816.991032073629 | 244.891032073629 |
| 47 | 1115.2 | 393.418083572403 | 721.781916427597 |
| Goldfeld-Quandt test for Heteroskedasticity | |||
| p-values | Alternative Hypothesis | ||
| breakpoint index | greater | 2-sided | less |
| 20 | 0.206136929331396 | 0.412273858662792 | 0.793863070668604 |
| 21 | 0.284601927083196 | 0.569203854166392 | 0.715398072916804 |
| 22 | 0.194719603072802 | 0.389439206145604 | 0.805280396927198 |
| 23 | 0.150665223491057 | 0.301330446982114 | 0.849334776508943 |
| 24 | 0.0855073624281634 | 0.171014724856327 | 0.914492637571837 |
| 25 | 0.128516501358591 | 0.257033002717182 | 0.871483498641409 |
| 26 | 0.180062852306123 | 0.360125704612245 | 0.819937147693877 |
| 27 | 0.144535848798010 | 0.289071697596021 | 0.85546415120199 |
| Meta Analysis of Goldfeld-Quandt test for Heteroskedasticity | |||
| Description | # significant tests | % significant tests | OK/NOK |
| 1% type I error level | 0 | 0 | OK |
| 5% type I error level | 0 | 0 | OK |
| 10% type I error level | 0 | 0 | OK |