| Multiple Linear Regression - Estimated Regression Equation |
| Totaal[t] = + 752.928125 + 197.798958333334Dummy[t] -1316.85970486111M1[t] -67.2335763888896M2[t] -589.543281250001M3[t] -831.277361111111M4[t] -1479.11144097222M5[t] -1301.79552083333M6[t] -406.254600694444M7[t] -538.063680555555M8[t] -703.397760416667M9[t] -490.606840277778M10[t] -101.865920138889M11[t] -18.2659201388889t + e[t] |
| Multiple Linear Regression - Ordinary Least Squares | |||||
| Variable | Parameter | S.D. | T-STAT H0: parameter = 0 | 2-tail p-value | 1-tail p-value |
| (Intercept) | 752.928125 | 397.439033 | 1.8944 | 0.066221 | 0.03311 |
| Dummy | 197.798958333334 | 376.506291 | 0.5254 | 0.602558 | 0.301279 |
| M1 | -1316.85970486111 | 419.950077 | -3.1358 | 0.003406 | 0.001703 |
| M2 | -67.2335763888896 | 427.418418 | -0.1573 | 0.875886 | 0.437943 |
| M3 | -589.543281250001 | 456.655946 | -1.291 | 0.204932 | 0.102466 |
| M4 | -831.277361111111 | 453.398425 | -1.8334 | 0.075016 | 0.037508 |
| M5 | -1479.11144097222 | 450.504582 | -3.2832 | 0.002289 | 0.001144 |
| M6 | -1301.79552083333 | 447.981463 | -2.9059 | 0.006228 | 0.003114 |
| M7 | -406.254600694444 | 445.835364 | -0.9112 | 0.36824 | 0.18412 |
| M8 | -538.063680555555 | 444.07175 | -1.2117 | 0.233536 | 0.116768 |
| M9 | -703.397760416667 | 442.695193 | -1.5889 | 0.120828 | 0.060414 |
| M10 | -490.606840277778 | 441.709312 | -1.1107 | 0.274061 | 0.13703 |
| M11 | -101.865920138889 | 441.116725 | -0.2309 | 0.818679 | 0.409339 |
| t | -18.2659201388889 | 13.205438 | -1.3832 | 0.175119 | 0.087559 |
| Multiple Linear Regression - Regression Statistics | |
| Multiple R | 0.68542514570994 |
| R-squared | 0.469807630371493 |
| Adjusted R-squared | 0.27834927467231 |
| F-TEST (value) | 2.45383717339372 |
| F-TEST (DF numerator) | 13 |
| F-TEST (DF denominator) | 36 |
| p-value | 0.0167757306492929 |
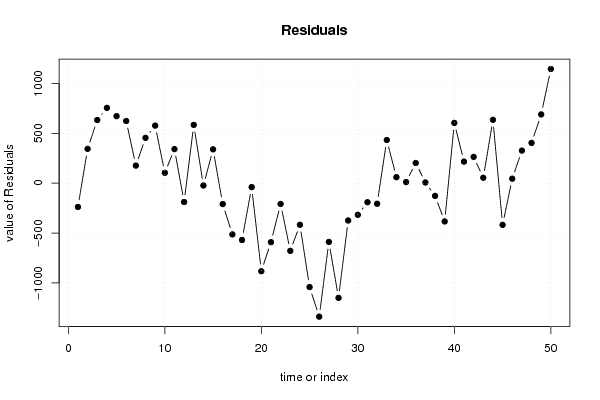
| Multiple Linear Regression - Residual Statistics | |
| Residual Standard Deviation | 623.553657493665 |
| Sum Squared Residuals | 13997489.8958542 |
| Multiple Linear Regression - Actuals, Interpolation, and Residuals | |||
| Time or Index | Actuals | Interpolation Forecast | Residuals Prediction Error |
| 1 | -820.8 | -582.1975 | -238.602500000001 |
| 2 | 993.3 | 649.162708333334 | 344.137291666666 |
| 3 | 741.7 | 108.587083333333 | 633.112916666667 |
| 4 | 603.6 | -151.412916666667 | 755.012916666667 |
| 5 | -145.8 | -817.512916666667 | 671.712916666667 |
| 6 | -35.1 | -658.462916666668 | 623.362916666668 |
| 7 | 395.1 | 218.812083333333 | 176.287916666667 |
| 8 | 523.1 | 68.737083333333 | 454.362916666667 |
| 9 | 462.3 | -114.862916666666 | 577.162916666666 |
| 10 | 183.4 | 79.6620833333334 | 103.737916666667 |
| 11 | 791.5 | 450.137083333334 | 341.362916666666 |
| 12 | 344.8 | 533.737083333333 | -188.937083333333 |
| 13 | -217 | -801.388541666666 | 584.388541666666 |
| 14 | 406.7 | 429.971666666667 | -23.2716666666672 |
| 15 | 228.6 | -110.603958333334 | 339.203958333334 |
| 16 | -580.1 | -370.603958333333 | -209.496041666668 |
| 17 | -1550.4 | -1036.70395833333 | -513.696041666667 |
| 18 | -1447.5 | -877.653958333333 | -569.846041666667 |
| 19 | -40.1 | -0.378958333333365 | -39.7210416666666 |
| 20 | -1033.5 | -150.453958333334 | -883.046041666666 |
| 21 | -925.6 | -334.053958333334 | -591.546041666666 |
| 22 | -347.8 | -139.528958333333 | -208.271041666667 |
| 23 | -447.7 | 230.946041666667 | -678.646041666667 |
| 24 | -102.6 | 314.546041666666 | -417.146041666666 |
| 25 | -2062.2 | -1020.57958333333 | -1041.62041666667 |
| 26 | -929.7 | 408.579583333332 | -1338.27958333333 |
| 27 | -720.7 | -131.996041666667 | -588.703958333333 |
| 28 | -1541.8 | -391.996041666666 | -1149.80395833333 |
| 29 | -1432.3 | -1058.09604166667 | -374.203958333334 |
| 30 | -1216.2 | -899.046041666666 | -317.153958333334 |
| 31 | -212.8 | -21.7710416666668 | -191.028958333333 |
| 32 | -378.2 | -171.846041666667 | -206.353958333333 |
| 33 | 76.9 | -355.446041666667 | 432.346041666667 |
| 34 | -101.3 | -160.921041666667 | 59.6210416666668 |
| 35 | 220.4 | 209.553958333333 | 10.8460416666666 |
| 36 | 495.6 | 293.153958333333 | 202.446041666667 |
| 37 | -1035.2 | -1041.97166666667 | 6.77166666666657 |
| 38 | 61.8 | 189.388541666666 | -127.588541666666 |
| 39 | -734.8 | -351.187083333334 | -383.612916666666 |
| 40 | -6.9 | -611.187083333333 | 604.287083333333 |
| 41 | -1061.1 | -1277.28708333333 | 216.187083333333 |
| 42 | -854.6 | -1118.23708333333 | 263.637083333333 |
| 43 | -186.5 | -240.962083333333 | 54.4620833333332 |
| 44 | 244 | -391.037083333333 | 635.037083333333 |
| 45 | -992.6 | -574.637083333333 | -417.962916666667 |
| 46 | -335.2 | -380.112083333333 | 44.9120833333333 |
| 47 | 316.8 | -9.63708333333312 | 326.437083333333 |
| 48 | 477.6 | 73.9629166666666 | 403.637083333333 |
| 49 | -572.1 | -1261.16270833333 | 689.062708333333 |
| 50 | 1115.2 | -29.8025000000005 | 1145.0025 |
| Goldfeld-Quandt test for Heteroskedasticity | |||
| p-values | Alternative Hypothesis | ||
| breakpoint index | greater | 2-sided | less |
| 17 | 0.845141398105236 | 0.309717203789528 | 0.154858601894764 |
| 18 | 0.805250487383254 | 0.389499025233492 | 0.194749512616746 |
| 19 | 0.749377814289233 | 0.501244371421533 | 0.250622185710767 |
| 20 | 0.73237506079806 | 0.53524987840388 | 0.26762493920194 |
| 21 | 0.657972006758243 | 0.684055986483515 | 0.342027993241757 |
| 22 | 0.595640880720774 | 0.808718238558451 | 0.404359119279226 |
| 23 | 0.493742938055731 | 0.987485876111463 | 0.506257061944269 |
| 24 | 0.42345716511532 | 0.84691433023064 | 0.57654283488468 |
| 25 | 0.316706206242725 | 0.63341241248545 | 0.683293793757275 |
| 26 | 0.34998790464272 | 0.69997580928544 | 0.65001209535728 |
| 27 | 0.265027004800765 | 0.53005400960153 | 0.734972995199235 |
| 28 | 0.418017705865857 | 0.836035411731713 | 0.581982294134143 |
| 29 | 0.392339287580677 | 0.784678575161354 | 0.607660712419323 |
| 30 | 0.33659378162498 | 0.67318756324996 | 0.66340621837502 |
| 31 | 0.257767233892913 | 0.515534467785826 | 0.742232766107087 |
| 32 | 0.235307339956256 | 0.470614679912513 | 0.764692660043744 |
| 33 | 0.552979063153784 | 0.894041873692431 | 0.447020936846216 |
| Meta Analysis of Goldfeld-Quandt test for Heteroskedasticity | |||
| Description | # significant tests | % significant tests | OK/NOK |
| 1% type I error level | 0 | 0 | OK |
| 5% type I error level | 0 | 0 | OK |
| 10% type I error level | 0 | 0 | OK |