| Multiple Linear Regression - Estimated Regression Equation |
| Totaal[t] = -33.5225000000001 + 40.6773461538463Dummy[t] -9.98165384615385t + e[t] |
| Multiple Linear Regression - Ordinary Least Squares | |||||
| Variable | Parameter | S.D. | T-STAT H0: parameter = 0 | 2-tail p-value | 1-tail p-value |
| (Intercept) | -33.5225000000001 | 239.130731 | -0.1402 | 0.889113 | 0.444557 |
| Dummy | 40.6773461538463 | 417.711632 | 0.0974 | 0.922838 | 0.461419 |
| t | -9.98165384615385 | 14.47285 | -0.6897 | 0.493786 | 0.246893 |
| Multiple Linear Regression - Regression Statistics | |
| Multiple R | 0.174547615419622 |
| R-squared | 0.0304668700486763 |
| Adjusted R-squared | -0.0107898588854227 |
| F-TEST (value) | 0.738470325588399 |
| F-TEST (DF numerator) | 2 |
| F-TEST (DF denominator) | 47 |
| p-value | 0.483306201821193 |
| Multiple Linear Regression - Residual Statistics | |
| Residual Standard Deviation | 737.973458856313 |
| Sum Squared Residuals | 25596426.8208885 |
| Multiple Linear Regression - Actuals, Interpolation, and Residuals | |||
| Time or Index | Actuals | Interpolation Forecast | Residuals Prediction Error |
| 1 | -820.8 | -43.5041538461539 | -777.295846153846 |
| 2 | 993.3 | -53.4858076923072 | 1046.78580769231 |
| 3 | 741.7 | -63.4674615384629 | 805.167461538463 |
| 4 | 603.6 | -73.4491153846157 | 677.049115384616 |
| 5 | -145.8 | -83.4307692307694 | -62.3692307692306 |
| 6 | -35.1 | -93.4124230769232 | 58.3124230769232 |
| 7 | 395.1 | -103.394076923077 | 498.494076923077 |
| 8 | 523.1 | -113.375730769231 | 636.475730769231 |
| 9 | 462.3 | -123.357384615385 | 585.657384615385 |
| 10 | 183.4 | -133.339038461538 | 316.739038461538 |
| 11 | 791.5 | -143.320692307692 | 934.820692307692 |
| 12 | 344.8 | -153.302346153846 | 498.102346153846 |
| 13 | -217 | -163.284 | -53.716 |
| 14 | 406.7 | -173.265653846154 | 579.965653846154 |
| 15 | 228.6 | -183.247307692308 | 411.847307692308 |
| 16 | -580.1 | -193.228961538461 | -386.871038461539 |
| 17 | -1550.4 | -203.210615384615 | -1347.18938461538 |
| 18 | -1447.5 | -213.192269230769 | -1234.30773076923 |
| 19 | -40.1 | -223.173923076923 | 183.073923076923 |
| 20 | -1033.5 | -233.155576923077 | -800.344423076923 |
| 21 | -925.6 | -243.137230769231 | -682.46276923077 |
| 22 | -347.8 | -253.118884615384 | -94.6811153846156 |
| 23 | -447.7 | -263.100538461538 | -184.599461538462 |
| 24 | -102.6 | -273.082192307692 | 170.482192307692 |
| 25 | -2062.2 | -283.063846153846 | -1779.13615384615 |
| 26 | -929.7 | -252.368153846154 | -677.331846153846 |
| 27 | -720.7 | -262.349807692308 | -458.350192307692 |
| 28 | -1541.8 | -272.331461538462 | -1269.46853846154 |
| 29 | -1432.3 | -282.313115384616 | -1149.98688461538 |
| 30 | -1216.2 | -292.294769230769 | -923.90523076923 |
| 31 | -212.8 | -302.276423076923 | 89.4764230769232 |
| 32 | -378.2 | -312.258076923077 | -65.9419230769229 |
| 33 | 76.9 | -322.239730769231 | 399.139730769231 |
| 34 | -101.3 | -332.221384615385 | 230.921384615385 |
| 35 | 220.4 | -342.203038461538 | 562.603038461538 |
| 36 | 495.6 | -352.184692307692 | 847.784692307692 |
| 37 | -1035.2 | -362.166346153846 | -673.033653846154 |
| 38 | 61.8 | -372.148 | 433.948 |
| 39 | -734.8 | -382.129653846154 | -352.670346153846 |
| 40 | -6.9 | -392.111307692308 | 385.211307692308 |
| 41 | -1061.1 | -402.092961538462 | -659.007038461538 |
| 42 | -854.6 | -412.074615384615 | -442.525384615385 |
| 43 | -186.5 | -422.056269230769 | 235.556269230769 |
| 44 | 244 | -432.037923076923 | 676.037923076923 |
| 45 | -992.6 | -442.019576923077 | -550.580423076923 |
| 46 | -335.2 | -452.001230769231 | 116.801230769231 |
| 47 | 316.8 | -461.982884615384 | 778.782884615384 |
| 48 | 477.6 | -471.964538461538 | 949.564538461538 |
| 49 | -572.1 | -481.946192307692 | -90.153807692308 |
| 50 | 1115.2 | -491.927846153846 | 1607.12784615385 |
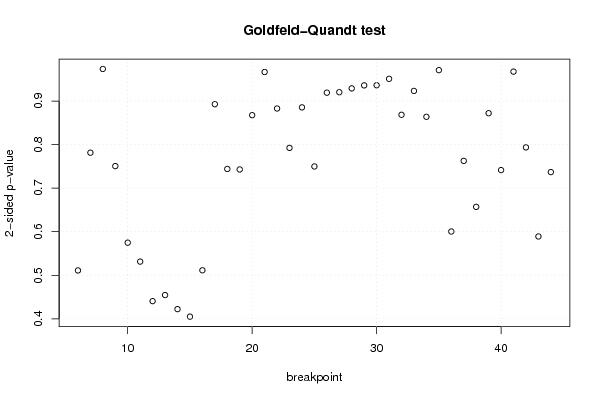
| Goldfeld-Quandt test for Heteroskedasticity | |||
| p-values | Alternative Hypothesis | ||
| breakpoint index | greater | 2-sided | less |
| 6 | 0.744458490649744 | 0.511083018700513 | 0.255541509350256 |
| 7 | 0.609324486684428 | 0.781351026631144 | 0.390675513315572 |
| 8 | 0.486792401528445 | 0.97358480305689 | 0.513207598471555 |
| 9 | 0.375280284465933 | 0.750560568931867 | 0.624719715534067 |
| 10 | 0.287402097258486 | 0.574804194516972 | 0.712597902741514 |
| 11 | 0.265695921073347 | 0.531391842146694 | 0.734304078926653 |
| 12 | 0.220286659083348 | 0.440573318166696 | 0.779713340916652 |
| 13 | 0.227285323146826 | 0.454570646293653 | 0.772714676853174 |
| 14 | 0.21113505782531 | 0.42227011565062 | 0.78886494217469 |
| 15 | 0.202508330904942 | 0.405016661809883 | 0.797491669095058 |
| 16 | 0.255730448546975 | 0.51146089709395 | 0.744269551453025 |
| 17 | 0.553645183384746 | 0.892709633230508 | 0.446354816615254 |
| 18 | 0.627969609372807 | 0.744060781254386 | 0.372030390627193 |
| 19 | 0.628567031058956 | 0.742865937882087 | 0.371432968941044 |
| 20 | 0.566259610259559 | 0.867480779480882 | 0.433740389740441 |
| 21 | 0.483278636899921 | 0.966557273799841 | 0.516721363100079 |
| 22 | 0.441412680260366 | 0.882825360520732 | 0.558587319739634 |
| 23 | 0.396192405680290 | 0.792384811360581 | 0.60380759431971 |
| 24 | 0.557318527531296 | 0.885362944937408 | 0.442681472468704 |
| 25 | 0.625123891641997 | 0.749752216716005 | 0.374876108358003 |
| 26 | 0.540456599252838 | 0.919086801494323 | 0.459543400747162 |
| 27 | 0.460087093602879 | 0.920174187205758 | 0.539912906397121 |
| 28 | 0.464480070295985 | 0.92896014059197 | 0.535519929704015 |
| 29 | 0.467961773483598 | 0.935923546967197 | 0.532038226516402 |
| 30 | 0.468058953577888 | 0.936117907155777 | 0.531941046422112 |
| 31 | 0.475461579020336 | 0.950923158040671 | 0.524538420979664 |
| 32 | 0.434198946538067 | 0.868397893076133 | 0.565801053461933 |
| 33 | 0.461559458212324 | 0.923118916424648 | 0.538440541787676 |
| 34 | 0.431881057474489 | 0.863762114948979 | 0.56811894252551 |
| 35 | 0.485419012468224 | 0.970838024936448 | 0.514580987531776 |
| 36 | 0.699799997612747 | 0.600400004774506 | 0.300200002387253 |
| 37 | 0.618709735107964 | 0.762580529784072 | 0.381290264892036 |
| 38 | 0.671502663685786 | 0.656994672628428 | 0.328497336314214 |
| 39 | 0.564009068338002 | 0.871981863323996 | 0.435990931661998 |
| 40 | 0.629291555940091 | 0.741416888119817 | 0.370708444059909 |
| 41 | 0.516265028887584 | 0.967469942224833 | 0.483734971112416 |
| 42 | 0.396790316520795 | 0.79358063304159 | 0.603209683479205 |
| 43 | 0.29454829676077 | 0.58909659352154 | 0.70545170323923 |
| 44 | 0.368411354911255 | 0.73682270982251 | 0.631588645088745 |
| Meta Analysis of Goldfeld-Quandt test for Heteroskedasticity | |||
| Description | # significant tests | % significant tests | OK/NOK |
| 1% type I error level | 0 | 0 | OK |
| 5% type I error level | 0 | 0 | OK |
| 10% type I error level | 0 | 0 | OK |