| Multiple Linear Regression - Estimated Regression Equation |
| Totaal[t] = -163.284 -208.864Dummy[t] + e[t] |
| Multiple Linear Regression - Ordinary Least Squares | |||||
| Variable | Parameter | S.D. | T-STAT H0: parameter = 0 | 2-tail p-value | 1-tail p-value |
| (Intercept) | -163.284 | 146.786335 | -1.1124 | 0.27151 | 0.135755 |
| Dummy | -208.864 | 207.587225 | -1.0062 | 0.319389 | 0.159694 |
| Multiple Linear Regression - Regression Statistics | |
| Multiple R | 0.143717698170804 |
| R-squared | 0.0206547767675142 |
| Adjusted R-squared | 0.000251751283504076 |
| F-TEST (value) | 1.01233891923045 |
| F-TEST (DF numerator) | 1 |
| F-TEST (DF denominator) | 48 |
| p-value | 0.319388510836505 |
| Multiple Linear Regression - Residual Statistics | |
| Residual Standard Deviation | 733.931673931572 |
| Sum Squared Residuals | 25855473.696 |
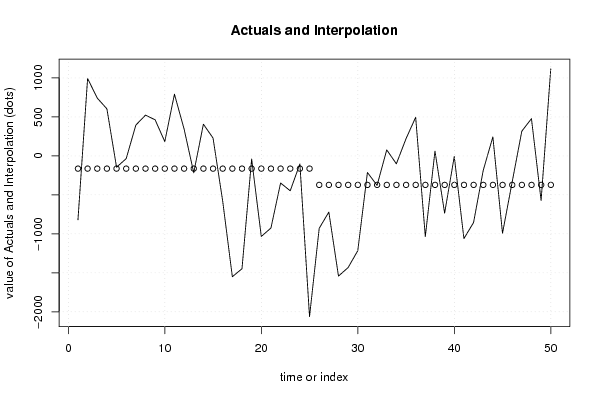
| Multiple Linear Regression - Actuals, Interpolation, and Residuals | |||
| Time or Index | Actuals | Interpolation Forecast | Residuals Prediction Error |
| 1 | -820.8 | -163.284000000000 | -657.516 |
| 2 | 993.3 | -163.283999999999 | 1156.5840 |
| 3 | 741.7 | -163.284 | 904.984 |
| 4 | 603.6 | -163.284 | 766.884 |
| 5 | -145.8 | -163.284 | 17.4840000000000 |
| 6 | -35.1 | -163.284 | 128.184 |
| 7 | 395.1 | -163.284 | 558.384 |
| 8 | 523.1 | -163.284 | 686.384 |
| 9 | 462.3 | -163.284 | 625.584 |
| 10 | 183.4 | -163.284 | 346.684 |
| 11 | 791.5 | -163.284 | 954.784 |
| 12 | 344.8 | -163.284 | 508.084 |
| 13 | -217 | -163.284 | -53.716 |
| 14 | 406.7 | -163.284 | 569.984 |
| 15 | 228.6 | -163.284 | 391.884 |
| 16 | -580.1 | -163.284 | -416.816 |
| 17 | -1550.4 | -163.284 | -1387.116 |
| 18 | -1447.5 | -163.284 | -1284.216 |
| 19 | -40.1 | -163.284 | 123.184 |
| 20 | -1033.5 | -163.284 | -870.216 |
| 21 | -925.6 | -163.284 | -762.316 |
| 22 | -347.8 | -163.284 | -184.516 |
| 23 | -447.7 | -163.284 | -284.416 |
| 24 | -102.6 | -163.284 | 60.684 |
| 25 | -2062.2 | -163.284 | -1898.916 |
| 26 | -929.7 | -372.148 | -557.552 |
| 27 | -720.7 | -372.148 | -348.552 |
| 28 | -1541.8 | -372.148 | -1169.652 |
| 29 | -1432.3 | -372.148 | -1060.152 |
| 30 | -1216.2 | -372.148 | -844.052 |
| 31 | -212.8 | -372.148 | 159.348 |
| 32 | -378.2 | -372.148 | -6.05199999999991 |
| 33 | 76.9 | -372.148 | 449.048 |
| 34 | -101.3 | -372.148 | 270.848 |
| 35 | 220.4 | -372.148 | 592.548 |
| 36 | 495.6 | -372.148 | 867.748 |
| 37 | -1035.2 | -372.148 | -663.052 |
| 38 | 61.8 | -372.148 | 433.948 |
| 39 | -734.8 | -372.148 | -362.652 |
| 40 | -6.9 | -372.148 | 365.248 |
| 41 | -1061.1 | -372.148 | -688.952 |
| 42 | -854.6 | -372.148 | -482.452 |
| 43 | -186.5 | -372.148 | 185.648 |
| 44 | 244 | -372.148 | 616.148 |
| 45 | -992.6 | -372.148 | -620.452 |
| 46 | -335.2 | -372.148 | 36.9480000000001 |
| 47 | 316.8 | -372.148 | 688.948 |
| 48 | 477.6 | -372.148 | 849.748 |
| 49 | -572.1 | -372.148 | -199.952 |
| 50 | 1115.2 | -372.148000000000 | 1487.348 |
| Goldfeld-Quandt test for Heteroskedasticity | |||
| p-values | Alternative Hypothesis | ||
| breakpoint index | greater | 2-sided | less |
| 5 | 0.749380837147451 | 0.501238325705098 | 0.250619162852549 |
| 6 | 0.620859796848242 | 0.758280406303517 | 0.379140203151758 |
| 7 | 0.491030138907552 | 0.982060277815104 | 0.508969861092448 |
| 8 | 0.390283309286915 | 0.78056661857383 | 0.609716690713085 |
| 9 | 0.297032986528618 | 0.594065973057237 | 0.702967013471382 |
| 10 | 0.210593321005232 | 0.421186642010464 | 0.789406678994768 |
| 11 | 0.209576180785189 | 0.419152361570379 | 0.79042381921481 |
| 12 | 0.157254529633384 | 0.314509059266767 | 0.842745470366616 |
| 13 | 0.139986745461910 | 0.279973490923820 | 0.86001325453809 |
| 14 | 0.115289670684880 | 0.230579341369759 | 0.88471032931512 |
| 15 | 0.0932969689245228 | 0.186593937849046 | 0.906703031075477 |
| 16 | 0.129046281033518 | 0.258092562067035 | 0.870953718966482 |
| 17 | 0.489030205895108 | 0.978060411790215 | 0.510969794104893 |
| 18 | 0.694386377899331 | 0.611227244201337 | 0.305613622100669 |
| 19 | 0.647423205420004 | 0.705153589159993 | 0.352576794579996 |
| 20 | 0.668952079842735 | 0.66209584031453 | 0.331047920157265 |
| 21 | 0.656656957940627 | 0.686686084118745 | 0.343343042059373 |
| 22 | 0.596142598288992 | 0.807714803422016 | 0.403857401711008 |
| 23 | 0.543160538872723 | 0.913678922254555 | 0.456839461127277 |
| 24 | 0.610462626617003 | 0.779074746765995 | 0.389537373382997 |
| 25 | 0.774019426153973 | 0.451961147692054 | 0.225980573846027 |
| 26 | 0.729141261615657 | 0.541717476768686 | 0.270858738384343 |
| 27 | 0.667253786953194 | 0.665492426093613 | 0.332746213046806 |
| 28 | 0.738743484222526 | 0.522513031554948 | 0.261256515777474 |
| 29 | 0.796352955027592 | 0.407294089944817 | 0.203647044972408 |
| 30 | 0.82710819092071 | 0.345783618158580 | 0.172891809079290 |
| 31 | 0.795705098226975 | 0.408589803546050 | 0.204294901773025 |
| 32 | 0.745779339500306 | 0.508441320999387 | 0.254220660499694 |
| 33 | 0.713070875967415 | 0.57385824806517 | 0.286929124032585 |
| 34 | 0.649054131960071 | 0.701891736079857 | 0.350945868039929 |
| 35 | 0.615280098145681 | 0.769439803708638 | 0.384719901854319 |
| 36 | 0.637613362707138 | 0.724773274585725 | 0.362386637292862 |
| 37 | 0.643391755468677 | 0.713216489062646 | 0.356608244531323 |
| 38 | 0.567296774691127 | 0.865406450617745 | 0.432703225308873 |
| 39 | 0.508139664781229 | 0.983720670437542 | 0.491860335218771 |
| 40 | 0.411576770236012 | 0.823153540472023 | 0.588423229763988 |
| 41 | 0.447724564025335 | 0.89544912805067 | 0.552275435974665 |
| 42 | 0.452487147696182 | 0.904974295392364 | 0.547512852303818 |
| 43 | 0.335839686671523 | 0.671679373343045 | 0.664160313328477 |
| 44 | 0.235652241888777 | 0.471304483777553 | 0.764347758111223 |
| 45 | 0.328508347260577 | 0.657016694521154 | 0.671491652739423 |
| Meta Analysis of Goldfeld-Quandt test for Heteroskedasticity | |||
| Description | # significant tests | % significant tests | OK/NOK |
| 1% type I error level | 0 | 0 | OK |
| 5% type I error level | 0 | 0 | OK |
| 10% type I error level | 0 | 0 | OK |