Free Statistics

of Irreproducible Research!

Author's title

Author*The author of this computation has been verified*
R Software Modulerwasp_edauni.wasp
Title produced by softwareUnivariate Explorative Data Analysis
Date of computationThu, 02 Dec 2010 19:49:03 +0000
Cite this page as followsStatistical Computations at FreeStatistics.org, Office for Research Development and Education, URL https://freestatistics.org/blog/index.php?v=date/2010/Dec/02/t1291319916nmio8irzwuounlo.htm/, Retrieved Sun, 05 May 2024 10:22:55 +0000
Statistical Computations at FreeStatistics.org, Office for Research Development and Education, URL https://freestatistics.org/blog/index.php?pk=104450, Retrieved Sun, 05 May 2024 10:22:55 +0000
QR Codes:

Original text written by user:
IsPrivate?No (this computation is public)
User-defined keywords
Estimated Impact158
Family? (F = Feedback message, R = changed R code, M = changed R Module, P = changed Parameters, D = changed Data)
-     [Univariate Explorative Data Analysis] [time effect in su...] [2010-11-17 08:55:33] [b98453cac15ba1066b407e146608df68]
- R  D  [Univariate Explorative Data Analysis] [WS7 Tutorial Popu...] [2010-11-22 10:43:52] [afe9379cca749d06b3d6872e02cc47ed]
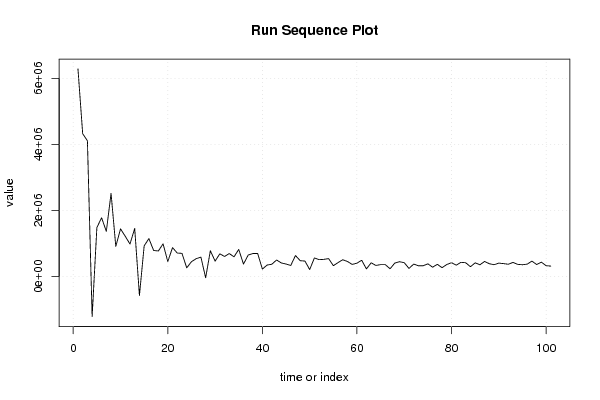
-    D      [Univariate Explorative Data Analysis] [run sequence plot] [2010-12-02 19:49:03] [be9b1effb945c5b0652fb49bcca5faef] [Current]
Feedback Forum

Post a new message
Dataseries X:
6282929
4324047
4108272
-1212617
1485329
1779876
1367203
2519076
912684
1443586
1220017
984885
1457425
-572920
929144
1151176
790090
774497
990576
454195
876607
711969
702380
264449
450033
541063
588864
-37216
783310
467359
688779
608419
696348
597793
821730
377934
651939
697458
700368
225986
348695
373683
501709
413743
379825
336260
636765
481231
469107
211928
563925
511939
521016
543856
329304
423262
509665
455881
367772
406339
493408
232942
416002
337430
361517
360962
235561
408247
450296
418799
247405
378519
326638
328233
386225
283662
370225
269236
365732
420383
345811
431809
418876
297476
416776
357257
458343
388386
358934
407560
392558
373177
428370
369419
358649
376641
467427
364885
436230
329118
317365


Summary of computational transaction
Raw Inputview raw input (R code)
Raw Outputview raw output of R engine
Computing time3 seconds
R Server'Sir Ronald Aylmer Fisher' @ 193.190.124.24

\begin{tabular}{lllllllll}
\hline
Summary of computational transaction \tabularnewline
Raw Input & view raw input (R code)  \tabularnewline
Raw Output & view raw output of R engine  \tabularnewline
Computing time & 3 seconds \tabularnewline
R Server & 'Sir Ronald Aylmer Fisher' @ 193.190.124.24 \tabularnewline
\hline
\end{tabular}
%Source: https://freestatistics.org/blog/index.php?pk=104450&T=0

[TABLE]
[ROW][C]Summary of computational transaction[/C][/ROW]
[ROW][C]Raw Input[/C][C]view raw input (R code) [/C][/ROW]
[ROW][C]Raw Output[/C][C]view raw output of R engine [/C][/ROW]
[ROW][C]Computing time[/C][C]3 seconds[/C][/ROW]
[ROW][C]R Server[/C][C]'Sir Ronald Aylmer Fisher' @ 193.190.124.24[/C][/ROW]
[/TABLE]
Source: https://freestatistics.org/blog/index.php?pk=104450&T=0

Globally Unique Identifier (entire table): ba.freestatistics.org/blog/index.php?pk=104450&T=0

As an alternative you can also use a QR Code:  

The GUIDs for individual cells are displayed in the table below:

Summary of computational transaction
Raw Inputview raw input (R code)
Raw Outputview raw output of R engine
Computing time3 seconds
R Server'Sir Ronald Aylmer Fisher' @ 193.190.124.24


Descriptive Statistics
# observations101
minimum-1212617
Q1361517
median428370
mean659182.534653465
Q3688779
maximum6282929

\begin{tabular}{lllllllll}
\hline
Descriptive Statistics \tabularnewline
# observations & 101 \tabularnewline
minimum & -1212617 \tabularnewline
Q1 & 361517 \tabularnewline
median & 428370 \tabularnewline
mean & 659182.534653465 \tabularnewline
Q3 & 688779 \tabularnewline
maximum & 6282929 \tabularnewline
\hline
\end{tabular}
%Source: https://freestatistics.org/blog/index.php?pk=104450&T=1

[TABLE]
[ROW][C]Descriptive Statistics[/C][/ROW]
[ROW][C]# observations[/C][C]101[/C][/ROW]
[ROW][C]minimum[/C][C]-1212617[/C][/ROW]
[ROW][C]Q1[/C][C]361517[/C][/ROW]
[ROW][C]median[/C][C]428370[/C][/ROW]
[ROW][C]mean[/C][C]659182.534653465[/C][/ROW]
[ROW][C]Q3[/C][C]688779[/C][/ROW]
[ROW][C]maximum[/C][C]6282929[/C][/ROW]
[/TABLE]
Source: https://freestatistics.org/blog/index.php?pk=104450&T=1

Globally Unique Identifier (entire table): ba.freestatistics.org/blog/index.php?pk=104450&T=1

As an alternative you can also use a QR Code:  

The GUIDs for individual cells are displayed in the table below:

Descriptive Statistics
# observations101
minimum-1212617
Q1361517
median428370
mean659182.534653465
Q3688779
maximum6282929


Parameters (Session):
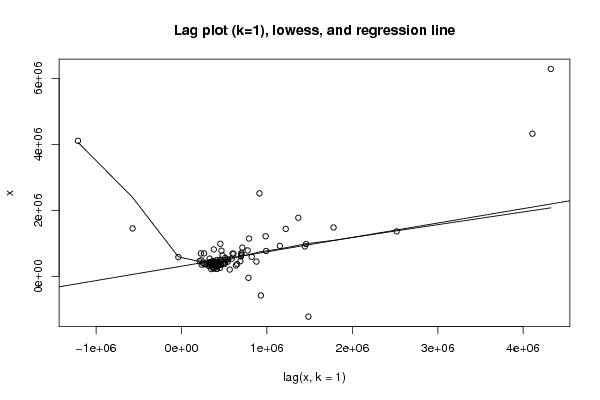
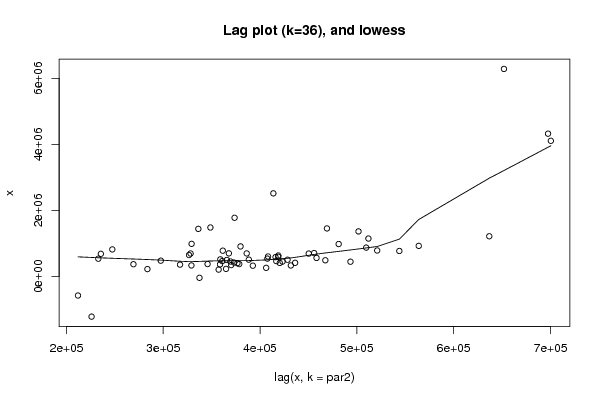
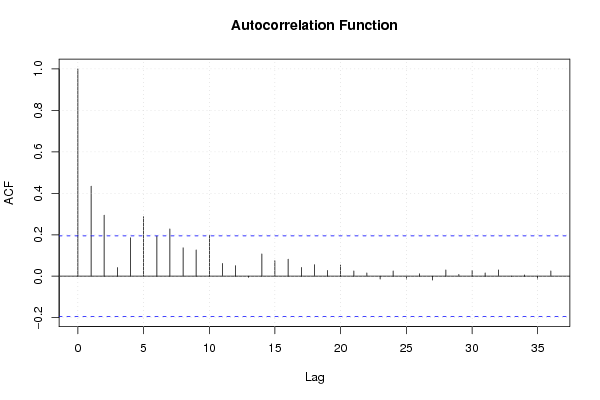
par1 = 0 ; par2 = 36 ;
Parameters (R input):
par1 = 0 ; par2 = 36 ;
R code (references can be found in the software module):
par1 <- as.numeric(par1)
par2 <- as.numeric(par2)
x <- as.ts(x)
library(lattice)
bitmap(file='pic1.png')
plot(x,type='l',main='Run Sequence Plot',xlab='time or index',ylab='value')
grid()
dev.off()
bitmap(file='pic2.png')
hist(x)
grid()
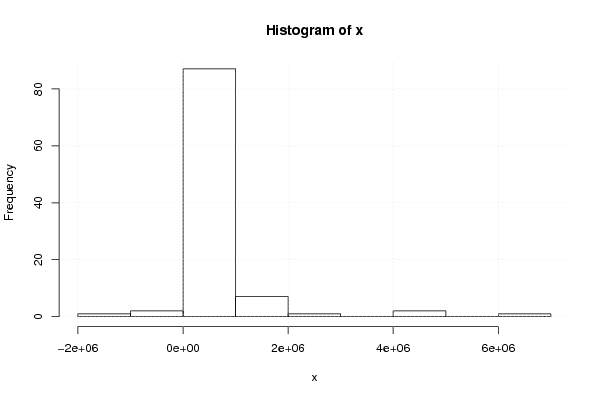
dev.off()
bitmap(file='pic3.png')
if (par1 > 0)
{
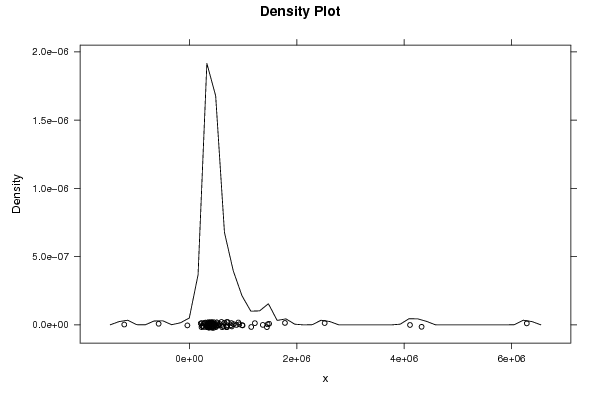
densityplot(~x,col='black',main=paste('Density Plot bw = ',par1),bw=par1)
} else {
densityplot(~x,col='black',main='Density Plot')
}
dev.off()
bitmap(file='pic4.png')
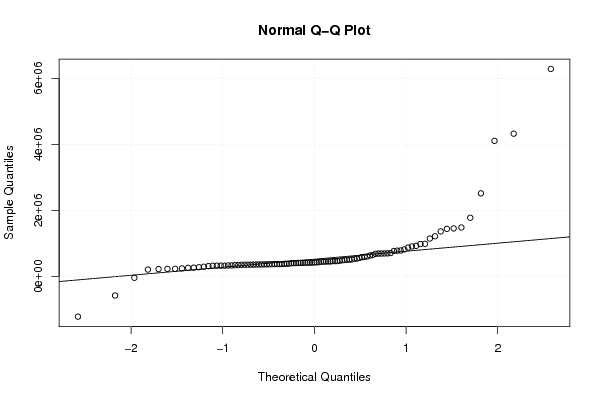
qqnorm(x)
qqline(x)
grid()
dev.off()
if (par2 > 0)
{
bitmap(file='lagplot1.png')
dum <- cbind(lag(x,k=1),x)
dum
dum1 <- dum[2:length(x),]
dum1
z <- as.data.frame(dum1)
z
plot(z,main='Lag plot (k=1), lowess, and regression line')
lines(lowess(z))
abline(lm(z))
dev.off()
if (par2 > 1) {
bitmap(file='lagplotpar2.png')
dum <- cbind(lag(x,k=par2),x)
dum
dum1 <- dum[(par2+1):length(x),]
dum1
z <- as.data.frame(dum1)
z
mylagtitle <- 'Lag plot (k='
mylagtitle <- paste(mylagtitle,par2,sep='')
mylagtitle <- paste(mylagtitle,'), and lowess',sep='')
plot(z,main=mylagtitle)
lines(lowess(z))
dev.off()
}
bitmap(file='pic5.png')
acf(x,lag.max=par2,main='Autocorrelation Function')
grid()
dev.off()
}
summary(x)
load(file='createtable')
a<-table.start()
a<-table.row.start(a)
a<-table.element(a,'Descriptive Statistics',2,TRUE)
a<-table.row.end(a)
a<-table.row.start(a)
a<-table.element(a,'# observations',header=TRUE)
a<-table.element(a,length(x))
a<-table.row.end(a)
a<-table.row.start(a)
a<-table.element(a,'minimum',header=TRUE)
a<-table.element(a,min(x))
a<-table.row.end(a)
a<-table.row.start(a)
a<-table.element(a,'Q1',header=TRUE)
a<-table.element(a,quantile(x,0.25))
a<-table.row.end(a)
a<-table.row.start(a)
a<-table.element(a,'median',header=TRUE)
a<-table.element(a,median(x))
a<-table.row.end(a)
a<-table.row.start(a)
a<-table.element(a,'mean',header=TRUE)
a<-table.element(a,mean(x))
a<-table.row.end(a)
a<-table.row.start(a)
a<-table.element(a,'Q3',header=TRUE)
a<-table.element(a,quantile(x,0.75))
a<-table.row.end(a)
a<-table.row.start(a)
a<-table.element(a,'maximum',header=TRUE)
a<-table.element(a,max(x))
a<-table.row.end(a)
a<-table.end(a)
table.save(a,file='mytable.tab')