| Multiple Linear Regression - Estimated Regression Equation |
| Werkloosheid[t] = + 11.3794637275710 + 0.0370832973532882GeneraleconomicsituationoveRnexttwelvemonths[t] + 0.0573711763273573HICP[t] -0.6802095474807renteopOLO12enmeerBel[t] -0.00027370821644188`20`[t] + 0.0121067180406699t + e[t] |
| Multiple Linear Regression - Ordinary Least Squares | |||||
| Variable | Parameter | S.D. | T-STAT H0: parameter = 0 | 2-tail p-value | 1-tail p-value |
| (Intercept) | 11.3794637275710 | 0.711257 | 15.9991 | 0 | 0 |
| GeneraleconomicsituationoveRnexttwelvemonths | 0.0370832973532882 | 0.010607 | 3.4963 | 0.000952 | 0.000476 |
| HICP | 0.0573711763273573 | 0.048494 | 1.1831 | 0.24197 | 0.120985 |
| renteopOLO12enmeerBel | -0.6802095474807 | 0.200528 | -3.3921 | 0.001304 | 0.000652 |
| `20` | -0.00027370821644188 | 0.000124 | -2.2114 | 0.031258 | 0.015629 |
| t | 0.0121067180406699 | 0.005399 | 2.2424 | 0.029067 | 0.014533 |
| Multiple Linear Regression - Regression Statistics | |
| Multiple R | 0.811558918487442 |
| R-squared | 0.658627878176506 |
| Adjusted R-squared | 0.627019348378035 |
| F-TEST (value) | 20.8370298263082 |
| F-TEST (DF numerator) | 5 |
| F-TEST (DF denominator) | 54 |
| p-value | 1.54869450597062e-11 |
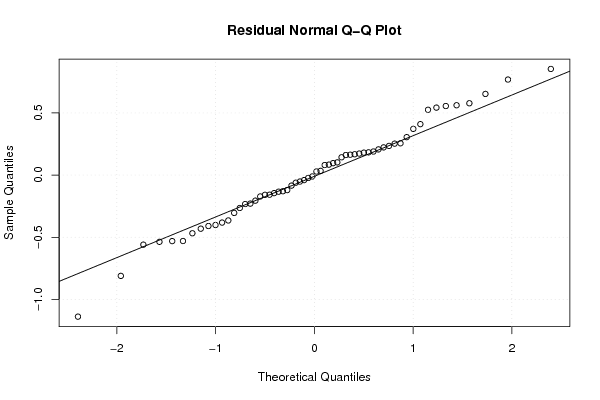
| Multiple Linear Regression - Residual Statistics | |
| Residual Standard Deviation | 0.404246268307375 |
| Sum Squared Residuals | 8.82441245378367 |
| Multiple Linear Regression - Actuals, Interpolation, and Residuals | |||
| Time or Index | Actuals | Interpolation Forecast | Residuals Prediction Error |
| 1 | 8.3 | 8.04425536574251 | 0.255744634257492 |
| 2 | 8.7 | 8.46533000044976 | 0.234669999550237 |
| 3 | 8.9 | 8.71959186353403 | 0.180408136465973 |
| 4 | 8.9 | 8.91090151320876 | -0.0109015132087555 |
| 5 | 8.1 | 8.2204383223081 | -0.120438322308097 |
| 6 | 8 | 8.08455448987332 | -0.0845544898733244 |
| 7 | 8.3 | 8.66473304969121 | -0.364733049691214 |
| 8 | 8.5 | 8.24706066099253 | 0.252939339007474 |
| 9 | 8.7 | 8.1445062939079 | 0.555493706092108 |
| 10 | 8.6 | 8.0222183510133 | 0.577781648986695 |
| 11 | 8.3 | 7.99477237001203 | 0.305227629987967 |
| 12 | 7.9 | 8.28185579917052 | -0.38185579917052 |
| 13 | 7.9 | 8.044909422256 | -0.144909422255991 |
| 14 | 8.1 | 8.16125483262866 | -0.061254832628657 |
| 15 | 8.3 | 8.32309087803526 | -0.0230908780352572 |
| 16 | 8.1 | 7.91042583725361 | 0.189574162746386 |
| 17 | 7.4 | 7.93009197565924 | -0.530091975659237 |
| 18 | 7.3 | 7.73093801949761 | -0.430938019497608 |
| 19 | 7.7 | 7.61913546834148 | 0.0808645316585166 |
| 20 | 8 | 7.47485232813727 | 0.525147671862734 |
| 21 | 8 | 7.43827264786557 | 0.561727352134427 |
| 22 | 7.7 | 7.53607213694848 | 0.163927863051525 |
| 23 | 6.9 | 7.3013189533109 | -0.401318953310903 |
| 24 | 6.6 | 7.73836209458893 | -1.13836209458893 |
| 25 | 6.9 | 7.71044767340674 | -0.810447673406744 |
| 26 | 7.5 | 7.27698925923828 | 0.223010740761717 |
| 27 | 7.9 | 7.13159515229072 | 0.768404847709278 |
| 28 | 7.7 | 6.84631666737429 | 0.853683332625712 |
| 29 | 6.5 | 6.7327774024492 | -0.232777402449195 |
| 30 | 6.1 | 6.65928819264526 | -0.559288192645261 |
| 31 | 6.4 | 6.93667820482807 | -0.536678204828068 |
| 32 | 6.8 | 7.3308013959712 | -0.530801395971201 |
| 33 | 7.1 | 7.2577099178452 | -0.157709917845195 |
| 34 | 7.3 | 7.15676367725012 | 0.143236322749883 |
| 35 | 7.2 | 7.16599416645753 | 0.0340058335424745 |
| 36 | 7 | 6.83844098200516 | 0.161559017994835 |
| 37 | 7 | 7.22934172727202 | -0.229341727272016 |
| 38 | 7 | 7.26446343959473 | -0.264463439594728 |
| 39 | 7.3 | 7.2159932332461 | 0.0840067667539064 |
| 40 | 7.5 | 7.54005797527808 | -0.0400579752780773 |
| 41 | 7.2 | 7.6677925186482 | -0.467792518648196 |
| 42 | 7.7 | 7.52690520985393 | 0.173094790146069 |
| 43 | 8 | 7.79323005070713 | 0.206769949292875 |
| 44 | 7.9 | 7.73231850385147 | 0.167681496148529 |
| 45 | 8 | 7.89743192084277 | 0.102568079157235 |
| 46 | 8 | 7.97122034862153 | 0.028779651378466 |
| 47 | 7.9 | 7.71682505675644 | 0.183174943243558 |
| 48 | 7.9 | 8.20432781873701 | -0.304327818737008 |
| 49 | 8 | 8.40951383124606 | -0.409513831246057 |
| 50 | 8.1 | 8.22948455634638 | -0.129484556346383 |
| 51 | 8.1 | 8.23349129813996 | -0.133491298139962 |
| 52 | 8.2 | 8.37189205503645 | -0.171892055036449 |
| 53 | 8 | 8.20564236443302 | -0.20564236443302 |
| 54 | 8.3 | 7.92818773380636 | 0.371812266193642 |
| 55 | 8.5 | 7.95738523933708 | 0.542614760662923 |
| 56 | 8.6 | 7.94720083286249 | 0.652799167137508 |
| 57 | 8.7 | 8.29014033658475 | 0.409859663415245 |
| 58 | 8.7 | 8.60376911349435 | 0.0962308865056487 |
| 59 | 8.5 | 8.5519391417693 | -0.0519391417692996 |
| 60 | 8.4 | 8.55870032734568 | -0.158700327345682 |
| Goldfeld-Quandt test for Heteroskedasticity | |||
| p-values | Alternative Hypothesis | ||
| breakpoint index | greater | 2-sided | less |
| 9 | 0.111255717975783 | 0.222511435951565 | 0.888744282024217 |
| 10 | 0.0494034015410295 | 0.098806803082059 | 0.95059659845897 |
| 11 | 0.0402032430828427 | 0.0804064861656854 | 0.959796756917157 |
| 12 | 0.0152860893270727 | 0.0305721786541454 | 0.984713910672927 |
| 13 | 0.221846663097368 | 0.443693326194736 | 0.778153336902632 |
| 14 | 0.146066663410993 | 0.292133326821986 | 0.853933336589007 |
| 15 | 0.178107312592538 | 0.356214625185076 | 0.821892687407462 |
| 16 | 0.132631094584971 | 0.265262189169942 | 0.867368905415029 |
| 17 | 0.120040126726623 | 0.240080253453245 | 0.879959873273377 |
| 18 | 0.0843612764100094 | 0.168722552820019 | 0.91563872358999 |
| 19 | 0.174645826290684 | 0.349291652581369 | 0.825354173709316 |
| 20 | 0.232949839880233 | 0.465899679760465 | 0.767050160119767 |
| 21 | 0.292862294699748 | 0.585724589399495 | 0.707137705300253 |
| 22 | 0.291214878585694 | 0.582429757171388 | 0.708785121414306 |
| 23 | 0.424941129274114 | 0.849882258548229 | 0.575058870725886 |
| 24 | 0.557098007875757 | 0.885803984248487 | 0.442901992124243 |
| 25 | 0.550464721825528 | 0.899070556348944 | 0.449535278174472 |
| 26 | 0.652008244603039 | 0.695983510793922 | 0.347991755396961 |
| 27 | 0.87958442585283 | 0.240831148294339 | 0.120415574147169 |
| 28 | 0.998175127770254 | 0.00364974445949135 | 0.00182487222974568 |
| 29 | 0.99943892509718 | 0.00112214980563882 | 0.000561074902819412 |
| 30 | 0.999976632860215 | 4.67342795703104e-05 | 2.33671397851552e-05 |
| 31 | 0.999995301628852 | 9.3967422957218e-06 | 4.6983711478609e-06 |
| 32 | 0.99999532909873 | 9.34180254077517e-06 | 4.67090127038759e-06 |
| 33 | 0.999990796019227 | 1.84079615457820e-05 | 9.20398077289101e-06 |
| 34 | 0.999996937409998 | 6.12518000388444e-06 | 3.06259000194222e-06 |
| 35 | 0.999996652673265 | 6.69465346984614e-06 | 3.34732673492307e-06 |
| 36 | 0.99999142636527 | 1.71472694594685e-05 | 8.57363472973426e-06 |
| 37 | 0.999989070683046 | 2.18586339071971e-05 | 1.09293169535986e-05 |
| 38 | 0.999983158370902 | 3.36832581956459e-05 | 1.68416290978229e-05 |
| 39 | 0.99997961837498 | 4.07632500391899e-05 | 2.03816250195950e-05 |
| 40 | 0.99995697790447 | 8.60441910604174e-05 | 4.30220955302087e-05 |
| 41 | 0.999998637627237 | 2.72474552541688e-06 | 1.36237276270844e-06 |
| 42 | 0.999997782847953 | 4.43430409391904e-06 | 2.21715204695952e-06 |
| 43 | 0.999994128873505 | 1.17422529894523e-05 | 5.87112649472614e-06 |
| 44 | 0.999993114194322 | 1.37716113565778e-05 | 6.88580567828891e-06 |
| 45 | 0.99997256809898 | 5.48638020382063e-05 | 2.74319010191032e-05 |
| 46 | 0.999885330398453 | 0.000229339203094895 | 0.000114669601547447 |
| 47 | 0.999572403571444 | 0.000855192857111455 | 0.000427596428555727 |
| 48 | 0.999581468983295 | 0.000837062033409246 | 0.000418531016704623 |
| 49 | 0.99998145089466 | 3.70982106813052e-05 | 1.85491053406526e-05 |
| 50 | 0.999916633758335 | 0.00016673248333034 | 8.336624166517e-05 |
| 51 | 0.999972841724613 | 5.43165507735063e-05 | 2.71582753867531e-05 |
| Meta Analysis of Goldfeld-Quandt test for Heteroskedasticity | |||
| Description | # significant tests | % significant tests | OK/NOK |
| 1% type I error level | 24 | 0.558139534883721 | NOK |
| 5% type I error level | 25 | 0.581395348837209 | NOK |
| 10% type I error level | 27 | 0.627906976744186 | NOK |