Free Statistics

of Irreproducible Research!

Author's title

Author*The author of this computation has been verified*
R Software Modulerwasp_exponentialsmoothing.wasp
Title produced by softwareExponential Smoothing
Date of computationThu, 02 Dec 2010 12:31:26 +0000
Cite this page as followsStatistical Computations at FreeStatistics.org, Office for Research Development and Education, URL https://freestatistics.org/blog/index.php?v=date/2010/Dec/02/t1291293390rptggdrq0bufbji.htm/, Retrieved Sun, 05 May 2024 12:54:33 +0000
Statistical Computations at FreeStatistics.org, Office for Research Development and Education, URL https://freestatistics.org/blog/index.php?pk=104242, Retrieved Sun, 05 May 2024 12:54:33 +0000
QR Codes:

Original text written by user:
IsPrivate?No (this computation is public)
User-defined keywords
Estimated Impact229
Family? (F = Feedback message, R = changed R code, M = changed R Module, P = changed Parameters, D = changed Data)
-     [Univariate Data Series] [data set] [2008-12-01 19:54:57] [b98453cac15ba1066b407e146608df68]
- RMP   [Exponential Smoothing] [Unemployment] [2010-11-30 13:37:23] [b98453cac15ba1066b407e146608df68]
-    D      [Exponential Smoothing] [Exponential smoot...] [2010-12-02 12:31:26] [4b5105369ca2b03f8f7589f5d63124c0] [Current]
-             [Exponential Smoothing] [Exponential smoot...] [2010-12-11 13:48:03] [62f7c80c4d96454bbd2b2b026ea9aad9]
Feedback Forum

Post a new message
Dataseries X:
16198,9
16554,2
19554,2
15903,8
18003,8
18329,6
16260,7
14851,9
18174,1
18406,6
18466,5
16016,5
17428,5
17167,2
19630
17183,6
18344,7
19301,4
18147,5
16192,9
18374,4
20515,2
18957,2
16471,5
18746,8
19009,5
19211,2
20547,7
19325,8
20605,5
20056,9
16141,4
20359,8
19711,6
15638,6
14384,5
13855,6
14308,3
15290,6
14423,8
13779,7
15686,3
14733,8
12522,5
16189,4
16059,1
16007,1
15806,8
15160
15692,1
18908,9
16969,9
16997,5
19858,9
17681,2


Summary of computational transaction
Raw Inputview raw input (R code)
Raw Outputview raw output of R engine
Computing time2 seconds
R Server'Gwilym Jenkins' @ 72.249.127.135

\begin{tabular}{lllllllll}
\hline
Summary of computational transaction \tabularnewline
Raw Input & view raw input (R code)  \tabularnewline
Raw Output & view raw output of R engine  \tabularnewline
Computing time & 2 seconds \tabularnewline
R Server & 'Gwilym Jenkins' @ 72.249.127.135 \tabularnewline
\hline
\end{tabular}
%Source: https://freestatistics.org/blog/index.php?pk=104242&T=0

[TABLE]
[ROW][C]Summary of computational transaction[/C][/ROW]
[ROW][C]Raw Input[/C][C]view raw input (R code) [/C][/ROW]
[ROW][C]Raw Output[/C][C]view raw output of R engine [/C][/ROW]
[ROW][C]Computing time[/C][C]2 seconds[/C][/ROW]
[ROW][C]R Server[/C][C]'Gwilym Jenkins' @ 72.249.127.135[/C][/ROW]
[/TABLE]
Source: https://freestatistics.org/blog/index.php?pk=104242&T=0

Globally Unique Identifier (entire table): ba.freestatistics.org/blog/index.php?pk=104242&T=0

As an alternative you can also use a QR Code:  

The GUIDs for individual cells are displayed in the table below:

Summary of computational transaction
Raw Inputview raw input (R code)
Raw Outputview raw output of R engine
Computing time2 seconds
R Server'Gwilym Jenkins' @ 72.249.127.135


Estimated Parameters of Exponential Smoothing
ParameterValue
alpha0.630243947316295
beta0
gamma0.749185747177312

\begin{tabular}{lllllllll}
\hline
Estimated Parameters of Exponential Smoothing \tabularnewline
Parameter & Value \tabularnewline
alpha & 0.630243947316295 \tabularnewline
beta & 0 \tabularnewline
gamma & 0.749185747177312 \tabularnewline
\hline
\end{tabular}
%Source: https://freestatistics.org/blog/index.php?pk=104242&T=1

[TABLE]
[ROW][C]Estimated Parameters of Exponential Smoothing[/C][/ROW]
[ROW][C]Parameter[/C][C]Value[/C][/ROW]
[ROW][C]alpha[/C][C]0.630243947316295[/C][/ROW]
[ROW][C]beta[/C][C]0[/C][/ROW]
[ROW][C]gamma[/C][C]0.749185747177312[/C][/ROW]
[/TABLE]
Source: https://freestatistics.org/blog/index.php?pk=104242&T=1

Globally Unique Identifier (entire table): ba.freestatistics.org/blog/index.php?pk=104242&T=1

As an alternative you can also use a QR Code:  

The GUIDs for individual cells are displayed in the table below:

Estimated Parameters of Exponential Smoothing
ParameterValue
alpha0.630243947316295
beta0
gamma0.749185747177312


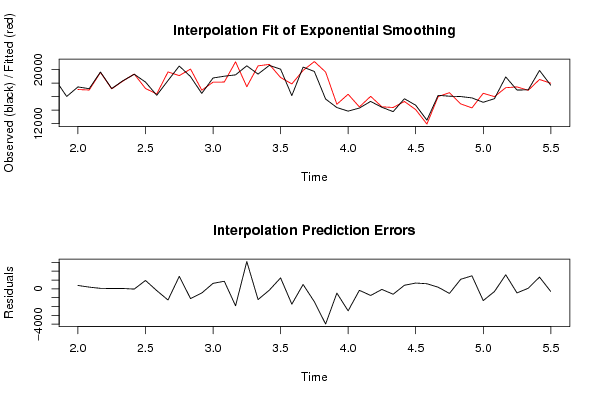
Interpolation Forecasts of Exponential Smoothing
tObservedFittedResiduals
1317428.517045.0413728632383.458627136752
1417167.216972.2721121519194.927887848087
151963019575.053327454254.9466725458369
1617183.617148.428895740935.1711042591451
1718344.718304.741031810139.958968189876
1819301.419328.5706901423-27.1706901423095
1918147.517198.0131209586949.48687904144
2016192.916392.1964066868-199.296406686839
2118374.419641.4409798067-1267.04097980675
2220515.219100.26266510471414.93733489531
2318957.220065.7391167438-1108.53911674381
2416471.516943.7431418755-472.243141875519
2518746.818126.5805153514620.219484648616
2619009.518150.8023274469858.69767255308
2719211.221133.1434005877-1921.94340058765
2820547.717455.11781764783092.58218235222
2919325.820539.6710948882-1213.87109488816
3020605.520754.6859579458-149.185957945836
3120056.918817.77874336321239.12125663684
3216141.417876.2710324896-1734.87103248964
3320359.819861.9466991722497.853300827766
3419711.621176.0331323852-1464.43313238521
3515638.619627.7605115353-3989.16051153528
3614384.514866.5344813411-482.034481341103
3713855.616345.8305106622-2490.23051066216
3814308.314475.7723050423-167.472305042258
3915290.616041.0939917945-750.493991794543
4014423.814490.4709497192-66.6709497191696
4113779.714390.9677538183-611.267753818256
4215686.315280.7045054266405.595494573441
4314733.814078.0282055907655.771794409327
4412522.511945.0246842833577.475315716734
4516189.416006.5429259088182.857074091233
4616059.116578.5202246694-519.420224669355
4716007.114926.44647874781080.65352125218
4815806.814331.96995697631474.83004302370
491516016488.2656483216-1328.26564832162
5015692.115993.9698690558-301.869869055789
5118908.917313.08198961421595.81801038576
5216969.917430.6377850470-460.737785046964
5316997.516931.914342335365.5856576646911
5419858.918529.92121337391328.97878662613
5517681.217978.5044734271-297.304473427073

\begin{tabular}{lllllllll}
\hline
Interpolation Forecasts of Exponential Smoothing \tabularnewline
t & Observed & Fitted & Residuals \tabularnewline
13 & 17428.5 & 17045.0413728632 & 383.458627136752 \tabularnewline
14 & 17167.2 & 16972.2721121519 & 194.927887848087 \tabularnewline
15 & 19630 & 19575.0533274542 & 54.9466725458369 \tabularnewline
16 & 17183.6 & 17148.4288957409 & 35.1711042591451 \tabularnewline
17 & 18344.7 & 18304.7410318101 & 39.958968189876 \tabularnewline
18 & 19301.4 & 19328.5706901423 & -27.1706901423095 \tabularnewline
19 & 18147.5 & 17198.0131209586 & 949.48687904144 \tabularnewline
20 & 16192.9 & 16392.1964066868 & -199.296406686839 \tabularnewline
21 & 18374.4 & 19641.4409798067 & -1267.04097980675 \tabularnewline
22 & 20515.2 & 19100.2626651047 & 1414.93733489531 \tabularnewline
23 & 18957.2 & 20065.7391167438 & -1108.53911674381 \tabularnewline
24 & 16471.5 & 16943.7431418755 & -472.243141875519 \tabularnewline
25 & 18746.8 & 18126.5805153514 & 620.219484648616 \tabularnewline
26 & 19009.5 & 18150.8023274469 & 858.69767255308 \tabularnewline
27 & 19211.2 & 21133.1434005877 & -1921.94340058765 \tabularnewline
28 & 20547.7 & 17455.1178176478 & 3092.58218235222 \tabularnewline
29 & 19325.8 & 20539.6710948882 & -1213.87109488816 \tabularnewline
30 & 20605.5 & 20754.6859579458 & -149.185957945836 \tabularnewline
31 & 20056.9 & 18817.7787433632 & 1239.12125663684 \tabularnewline
32 & 16141.4 & 17876.2710324896 & -1734.87103248964 \tabularnewline
33 & 20359.8 & 19861.9466991722 & 497.853300827766 \tabularnewline
34 & 19711.6 & 21176.0331323852 & -1464.43313238521 \tabularnewline
35 & 15638.6 & 19627.7605115353 & -3989.16051153528 \tabularnewline
36 & 14384.5 & 14866.5344813411 & -482.034481341103 \tabularnewline
37 & 13855.6 & 16345.8305106622 & -2490.23051066216 \tabularnewline
38 & 14308.3 & 14475.7723050423 & -167.472305042258 \tabularnewline
39 & 15290.6 & 16041.0939917945 & -750.493991794543 \tabularnewline
40 & 14423.8 & 14490.4709497192 & -66.6709497191696 \tabularnewline
41 & 13779.7 & 14390.9677538183 & -611.267753818256 \tabularnewline
42 & 15686.3 & 15280.7045054266 & 405.595494573441 \tabularnewline
43 & 14733.8 & 14078.0282055907 & 655.771794409327 \tabularnewline
44 & 12522.5 & 11945.0246842833 & 577.475315716734 \tabularnewline
45 & 16189.4 & 16006.5429259088 & 182.857074091233 \tabularnewline
46 & 16059.1 & 16578.5202246694 & -519.420224669355 \tabularnewline
47 & 16007.1 & 14926.4464787478 & 1080.65352125218 \tabularnewline
48 & 15806.8 & 14331.9699569763 & 1474.83004302370 \tabularnewline
49 & 15160 & 16488.2656483216 & -1328.26564832162 \tabularnewline
50 & 15692.1 & 15993.9698690558 & -301.869869055789 \tabularnewline
51 & 18908.9 & 17313.0819896142 & 1595.81801038576 \tabularnewline
52 & 16969.9 & 17430.6377850470 & -460.737785046964 \tabularnewline
53 & 16997.5 & 16931.9143423353 & 65.5856576646911 \tabularnewline
54 & 19858.9 & 18529.9212133739 & 1328.97878662613 \tabularnewline
55 & 17681.2 & 17978.5044734271 & -297.304473427073 \tabularnewline
\hline
\end{tabular}
%Source: https://freestatistics.org/blog/index.php?pk=104242&T=2

[TABLE]
[ROW][C]Interpolation Forecasts of Exponential Smoothing[/C][/ROW]
[ROW][C]t[/C][C]Observed[/C][C]Fitted[/C][C]Residuals[/C][/ROW]
[ROW][C]13[/C][C]17428.5[/C][C]17045.0413728632[/C][C]383.458627136752[/C][/ROW]
[ROW][C]14[/C][C]17167.2[/C][C]16972.2721121519[/C][C]194.927887848087[/C][/ROW]
[ROW][C]15[/C][C]19630[/C][C]19575.0533274542[/C][C]54.9466725458369[/C][/ROW]
[ROW][C]16[/C][C]17183.6[/C][C]17148.4288957409[/C][C]35.1711042591451[/C][/ROW]
[ROW][C]17[/C][C]18344.7[/C][C]18304.7410318101[/C][C]39.958968189876[/C][/ROW]
[ROW][C]18[/C][C]19301.4[/C][C]19328.5706901423[/C][C]-27.1706901423095[/C][/ROW]
[ROW][C]19[/C][C]18147.5[/C][C]17198.0131209586[/C][C]949.48687904144[/C][/ROW]
[ROW][C]20[/C][C]16192.9[/C][C]16392.1964066868[/C][C]-199.296406686839[/C][/ROW]
[ROW][C]21[/C][C]18374.4[/C][C]19641.4409798067[/C][C]-1267.04097980675[/C][/ROW]
[ROW][C]22[/C][C]20515.2[/C][C]19100.2626651047[/C][C]1414.93733489531[/C][/ROW]
[ROW][C]23[/C][C]18957.2[/C][C]20065.7391167438[/C][C]-1108.53911674381[/C][/ROW]
[ROW][C]24[/C][C]16471.5[/C][C]16943.7431418755[/C][C]-472.243141875519[/C][/ROW]
[ROW][C]25[/C][C]18746.8[/C][C]18126.5805153514[/C][C]620.219484648616[/C][/ROW]
[ROW][C]26[/C][C]19009.5[/C][C]18150.8023274469[/C][C]858.69767255308[/C][/ROW]
[ROW][C]27[/C][C]19211.2[/C][C]21133.1434005877[/C][C]-1921.94340058765[/C][/ROW]
[ROW][C]28[/C][C]20547.7[/C][C]17455.1178176478[/C][C]3092.58218235222[/C][/ROW]
[ROW][C]29[/C][C]19325.8[/C][C]20539.6710948882[/C][C]-1213.87109488816[/C][/ROW]
[ROW][C]30[/C][C]20605.5[/C][C]20754.6859579458[/C][C]-149.185957945836[/C][/ROW]
[ROW][C]31[/C][C]20056.9[/C][C]18817.7787433632[/C][C]1239.12125663684[/C][/ROW]
[ROW][C]32[/C][C]16141.4[/C][C]17876.2710324896[/C][C]-1734.87103248964[/C][/ROW]
[ROW][C]33[/C][C]20359.8[/C][C]19861.9466991722[/C][C]497.853300827766[/C][/ROW]
[ROW][C]34[/C][C]19711.6[/C][C]21176.0331323852[/C][C]-1464.43313238521[/C][/ROW]
[ROW][C]35[/C][C]15638.6[/C][C]19627.7605115353[/C][C]-3989.16051153528[/C][/ROW]
[ROW][C]36[/C][C]14384.5[/C][C]14866.5344813411[/C][C]-482.034481341103[/C][/ROW]
[ROW][C]37[/C][C]13855.6[/C][C]16345.8305106622[/C][C]-2490.23051066216[/C][/ROW]
[ROW][C]38[/C][C]14308.3[/C][C]14475.7723050423[/C][C]-167.472305042258[/C][/ROW]
[ROW][C]39[/C][C]15290.6[/C][C]16041.0939917945[/C][C]-750.493991794543[/C][/ROW]
[ROW][C]40[/C][C]14423.8[/C][C]14490.4709497192[/C][C]-66.6709497191696[/C][/ROW]
[ROW][C]41[/C][C]13779.7[/C][C]14390.9677538183[/C][C]-611.267753818256[/C][/ROW]
[ROW][C]42[/C][C]15686.3[/C][C]15280.7045054266[/C][C]405.595494573441[/C][/ROW]
[ROW][C]43[/C][C]14733.8[/C][C]14078.0282055907[/C][C]655.771794409327[/C][/ROW]
[ROW][C]44[/C][C]12522.5[/C][C]11945.0246842833[/C][C]577.475315716734[/C][/ROW]
[ROW][C]45[/C][C]16189.4[/C][C]16006.5429259088[/C][C]182.857074091233[/C][/ROW]
[ROW][C]46[/C][C]16059.1[/C][C]16578.5202246694[/C][C]-519.420224669355[/C][/ROW]
[ROW][C]47[/C][C]16007.1[/C][C]14926.4464787478[/C][C]1080.65352125218[/C][/ROW]
[ROW][C]48[/C][C]15806.8[/C][C]14331.9699569763[/C][C]1474.83004302370[/C][/ROW]
[ROW][C]49[/C][C]15160[/C][C]16488.2656483216[/C][C]-1328.26564832162[/C][/ROW]
[ROW][C]50[/C][C]15692.1[/C][C]15993.9698690558[/C][C]-301.869869055789[/C][/ROW]
[ROW][C]51[/C][C]18908.9[/C][C]17313.0819896142[/C][C]1595.81801038576[/C][/ROW]
[ROW][C]52[/C][C]16969.9[/C][C]17430.6377850470[/C][C]-460.737785046964[/C][/ROW]
[ROW][C]53[/C][C]16997.5[/C][C]16931.9143423353[/C][C]65.5856576646911[/C][/ROW]
[ROW][C]54[/C][C]19858.9[/C][C]18529.9212133739[/C][C]1328.97878662613[/C][/ROW]
[ROW][C]55[/C][C]17681.2[/C][C]17978.5044734271[/C][C]-297.304473427073[/C][/ROW]
[/TABLE]
Source: https://freestatistics.org/blog/index.php?pk=104242&T=2

Globally Unique Identifier (entire table): ba.freestatistics.org/blog/index.php?pk=104242&T=2

As an alternative you can also use a QR Code:  

The GUIDs for individual cells are displayed in the table below:

Interpolation Forecasts of Exponential Smoothing
tObservedFittedResiduals
1317428.517045.0413728632383.458627136752
1417167.216972.2721121519194.927887848087
151963019575.053327454254.9466725458369
1617183.617148.428895740935.1711042591451
1718344.718304.741031810139.958968189876
1819301.419328.5706901423-27.1706901423095
1918147.517198.0131209586949.48687904144
2016192.916392.1964066868-199.296406686839
2118374.419641.4409798067-1267.04097980675
2220515.219100.26266510471414.93733489531
2318957.220065.7391167438-1108.53911674381
2416471.516943.7431418755-472.243141875519
2518746.818126.5805153514620.219484648616
2619009.518150.8023274469858.69767255308
2719211.221133.1434005877-1921.94340058765
2820547.717455.11781764783092.58218235222
2919325.820539.6710948882-1213.87109488816
3020605.520754.6859579458-149.185957945836
3120056.918817.77874336321239.12125663684
3216141.417876.2710324896-1734.87103248964
3320359.819861.9466991722497.853300827766
3419711.621176.0331323852-1464.43313238521
3515638.619627.7605115353-3989.16051153528
3614384.514866.5344813411-482.034481341103
3713855.616345.8305106622-2490.23051066216
3814308.314475.7723050423-167.472305042258
3915290.616041.0939917945-750.493991794543
4014423.814490.4709497192-66.6709497191696
4113779.714390.9677538183-611.267753818256
4215686.315280.7045054266405.595494573441
4314733.814078.0282055907655.771794409327
4412522.511945.0246842833577.475315716734
4516189.416006.5429259088182.857074091233
4616059.116578.5202246694-519.420224669355
4716007.114926.44647874781080.65352125218
4815806.814331.96995697631474.83004302370
491516016488.2656483216-1328.26564832162
5015692.115993.9698690558-301.869869055789
5118908.917313.08198961421595.81801038576
5216969.917430.6377850470-460.737785046964
5316997.516931.914342335365.5856576646911
5419858.918529.92121337391328.97878662613
5517681.217978.5044734271-297.304473427073


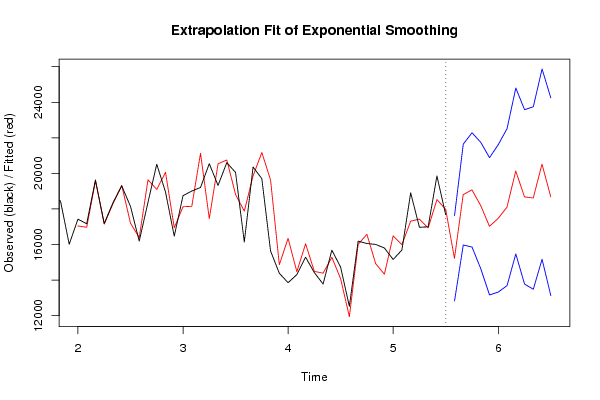
Extrapolation Forecasts of Exponential Smoothing
tForecast95% Lower Bound95% Upper Bound
5615223.141028414912823.745377138517622.5366796913
5718811.393394731515975.223053832321647.5637356306
5819073.58410598715859.455154960322287.7130570137
5918192.117784939714640.021555238221744.2140146412
6017025.759111655413165.169734851420886.3484884594
6117476.049838251813329.857241721321622.2424347822
6218103.213461126713689.861474398822516.5654478547
6320138.267077974015473.029841778224803.5043141698
6418680.369443910713776.167043803323584.5718440182
6518617.823197700913485.770597380923749.8757980209
6620524.475171257815174.267081502525874.6832610131
6718684.971168926513125.160981976324244.7813558767

\begin{tabular}{lllllllll}
\hline
Extrapolation Forecasts of Exponential Smoothing \tabularnewline
t & Forecast & 95% Lower Bound & 95% Upper Bound \tabularnewline
56 & 15223.1410284149 & 12823.7453771385 & 17622.5366796913 \tabularnewline
57 & 18811.3933947315 & 15975.2230538323 & 21647.5637356306 \tabularnewline
58 & 19073.584105987 & 15859.4551549603 & 22287.7130570137 \tabularnewline
59 & 18192.1177849397 & 14640.0215552382 & 21744.2140146412 \tabularnewline
60 & 17025.7591116554 & 13165.1697348514 & 20886.3484884594 \tabularnewline
61 & 17476.0498382518 & 13329.8572417213 & 21622.2424347822 \tabularnewline
62 & 18103.2134611267 & 13689.8614743988 & 22516.5654478547 \tabularnewline
63 & 20138.2670779740 & 15473.0298417782 & 24803.5043141698 \tabularnewline
64 & 18680.3694439107 & 13776.1670438033 & 23584.5718440182 \tabularnewline
65 & 18617.8231977009 & 13485.7705973809 & 23749.8757980209 \tabularnewline
66 & 20524.4751712578 & 15174.2670815025 & 25874.6832610131 \tabularnewline
67 & 18684.9711689265 & 13125.1609819763 & 24244.7813558767 \tabularnewline
\hline
\end{tabular}
%Source: https://freestatistics.org/blog/index.php?pk=104242&T=3

[TABLE]
[ROW][C]Extrapolation Forecasts of Exponential Smoothing[/C][/ROW]
[ROW][C]t[/C][C]Forecast[/C][C]95% Lower Bound[/C][C]95% Upper Bound[/C][/ROW]
[ROW][C]56[/C][C]15223.1410284149[/C][C]12823.7453771385[/C][C]17622.5366796913[/C][/ROW]
[ROW][C]57[/C][C]18811.3933947315[/C][C]15975.2230538323[/C][C]21647.5637356306[/C][/ROW]
[ROW][C]58[/C][C]19073.584105987[/C][C]15859.4551549603[/C][C]22287.7130570137[/C][/ROW]
[ROW][C]59[/C][C]18192.1177849397[/C][C]14640.0215552382[/C][C]21744.2140146412[/C][/ROW]
[ROW][C]60[/C][C]17025.7591116554[/C][C]13165.1697348514[/C][C]20886.3484884594[/C][/ROW]
[ROW][C]61[/C][C]17476.0498382518[/C][C]13329.8572417213[/C][C]21622.2424347822[/C][/ROW]
[ROW][C]62[/C][C]18103.2134611267[/C][C]13689.8614743988[/C][C]22516.5654478547[/C][/ROW]
[ROW][C]63[/C][C]20138.2670779740[/C][C]15473.0298417782[/C][C]24803.5043141698[/C][/ROW]
[ROW][C]64[/C][C]18680.3694439107[/C][C]13776.1670438033[/C][C]23584.5718440182[/C][/ROW]
[ROW][C]65[/C][C]18617.8231977009[/C][C]13485.7705973809[/C][C]23749.8757980209[/C][/ROW]
[ROW][C]66[/C][C]20524.4751712578[/C][C]15174.2670815025[/C][C]25874.6832610131[/C][/ROW]
[ROW][C]67[/C][C]18684.9711689265[/C][C]13125.1609819763[/C][C]24244.7813558767[/C][/ROW]
[/TABLE]
Source: https://freestatistics.org/blog/index.php?pk=104242&T=3

Globally Unique Identifier (entire table): ba.freestatistics.org/blog/index.php?pk=104242&T=3

As an alternative you can also use a QR Code:  

The GUIDs for individual cells are displayed in the table below:

Extrapolation Forecasts of Exponential Smoothing
tForecast95% Lower Bound95% Upper Bound
5615223.141028414912823.745377138517622.5366796913
5718811.393394731515975.223053832321647.5637356306
5819073.58410598715859.455154960322287.7130570137
5918192.117784939714640.021555238221744.2140146412
6017025.759111655413165.169734851420886.3484884594
6117476.049838251813329.857241721321622.2424347822
6218103.213461126713689.861474398822516.5654478547
6320138.267077974015473.029841778224803.5043141698
6418680.369443910713776.167043803323584.5718440182
6518617.823197700913485.770597380923749.8757980209
6620524.475171257815174.267081502525874.6832610131
6718684.971168926513125.160981976324244.7813558767


Parameters (Session):
par1 = 12 ; par2 = Triple ; par3 = additive ;
Parameters (R input):
par1 = 12 ; par2 = Triple ; par3 = additive ;
R code (references can be found in the software module):
par1 <- as.numeric(par1)
if (par2 == 'Single') K <- 1
if (par2 == 'Double') K <- 2
if (par2 == 'Triple') K <- par1
nx <- length(x)
nxmK <- nx - K
x <- ts(x, frequency = par1)
if (par2 == 'Single') fit <- HoltWinters(x, gamma=F, beta=F)
if (par2 == 'Double') fit <- HoltWinters(x, gamma=F)
if (par2 == 'Triple') fit <- HoltWinters(x, seasonal=par3)
fit
myresid <- x - fit$fitted[,'xhat']
bitmap(file='test1.png')
op <- par(mfrow=c(2,1))
plot(fit,ylab='Observed (black) / Fitted (red)',main='Interpolation Fit of Exponential Smoothing')
plot(myresid,ylab='Residuals',main='Interpolation Prediction Errors')
par(op)
dev.off()
bitmap(file='test2.png')
p <- predict(fit, par1, prediction.interval=TRUE)
np <- length(p[,1])
plot(fit,p,ylab='Observed (black) / Fitted (red)',main='Extrapolation Fit of Exponential Smoothing')
dev.off()
bitmap(file='test3.png')
op <- par(mfrow = c(2,2))
acf(as.numeric(myresid),lag.max = nx/2,main='Residual ACF')
spectrum(myresid,main='Residals Periodogram')
cpgram(myresid,main='Residal Cumulative Periodogram')
qqnorm(myresid,main='Residual Normal QQ Plot')
qqline(myresid)
par(op)
dev.off()
load(file='createtable')
a<-table.start()
a<-table.row.start(a)
a<-table.element(a,'Estimated Parameters of Exponential Smoothing',2,TRUE)
a<-table.row.end(a)
a<-table.row.start(a)
a<-table.element(a,'Parameter',header=TRUE)
a<-table.element(a,'Value',header=TRUE)
a<-table.row.end(a)
a<-table.row.start(a)
a<-table.element(a,'alpha',header=TRUE)
a<-table.element(a,fit$alpha)
a<-table.row.end(a)
a<-table.row.start(a)
a<-table.element(a,'beta',header=TRUE)
a<-table.element(a,fit$beta)
a<-table.row.end(a)
a<-table.row.start(a)
a<-table.element(a,'gamma',header=TRUE)
a<-table.element(a,fit$gamma)
a<-table.row.end(a)
a<-table.end(a)
table.save(a,file='mytable.tab')
a<-table.start()
a<-table.row.start(a)
a<-table.element(a,'Interpolation Forecasts of Exponential Smoothing',4,TRUE)
a<-table.row.end(a)
a<-table.row.start(a)
a<-table.element(a,'t',header=TRUE)
a<-table.element(a,'Observed',header=TRUE)
a<-table.element(a,'Fitted',header=TRUE)
a<-table.element(a,'Residuals',header=TRUE)
a<-table.row.end(a)
for (i in 1:nxmK) {
a<-table.row.start(a)
a<-table.element(a,i+K,header=TRUE)
a<-table.element(a,x[i+K])
a<-table.element(a,fit$fitted[i,'xhat'])
a<-table.element(a,myresid[i])
a<-table.row.end(a)
}
a<-table.end(a)
table.save(a,file='mytable1.tab')
a<-table.start()
a<-table.row.start(a)
a<-table.element(a,'Extrapolation Forecasts of Exponential Smoothing',4,TRUE)
a<-table.row.end(a)
a<-table.row.start(a)
a<-table.element(a,'t',header=TRUE)
a<-table.element(a,'Forecast',header=TRUE)
a<-table.element(a,'95% Lower Bound',header=TRUE)
a<-table.element(a,'95% Upper Bound',header=TRUE)
a<-table.row.end(a)
for (i in 1:np) {
a<-table.row.start(a)
a<-table.element(a,nx+i,header=TRUE)
a<-table.element(a,p[i,'fit'])
a<-table.element(a,p[i,'lwr'])
a<-table.element(a,p[i,'upr'])
a<-table.row.end(a)
}
a<-table.end(a)
table.save(a,file='mytable2.tab')