| Multiple Linear Regression - Estimated Regression Equation |
| werkloosheid[t] = + 1.85423823704046 -0.114537989510701maand[t] -3.92322970510058indicator[t] + 0.973210530445734economie[t] + 1.09728386413799`financiën`[t] + 0.908015384045378spaarvermogen[t] -0.0221617445973184t + e[t] |
| Multiple Linear Regression - Ordinary Least Squares | |||||
| Variable | Parameter | S.D. | T-STAT H0: parameter = 0 | 2-tail p-value | 1-tail p-value |
| (Intercept) | 1.85423823704046 | 0.620938 | 2.9862 | 0.004269 | 0.002135 |
| maand | -0.114537989510701 | 0.044347 | -2.5828 | 0.012598 | 0.006299 |
| indicator | -3.92322970510058 | 0.030814 | -127.3206 | 0 | 0 |
| economie | 0.973210530445734 | 0.03735 | 26.0563 | 0 | 0 |
| `financiën` | 1.09728386413799 | 0.155836 | 7.0413 | 0 | 0 |
| spaarvermogen | 0.908015384045378 | 0.057907 | 15.6805 | 0 | 0 |
| t | -0.0221617445973184 | 0.019223 | -1.1529 | 0.254136 | 0.127068 |
| Multiple Linear Regression - Regression Statistics | |
| Multiple R | 0.998851623219125 |
| R-squared | 0.99770456520748 |
| Adjusted R-squared | 0.99744470466493 |
| F-TEST (value) | 3839.38459998337 |
| F-TEST (DF numerator) | 6 |
| F-TEST (DF denominator) | 53 |
| p-value | 0 |
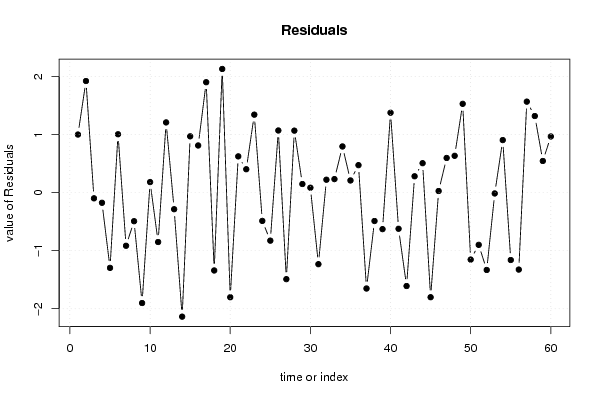
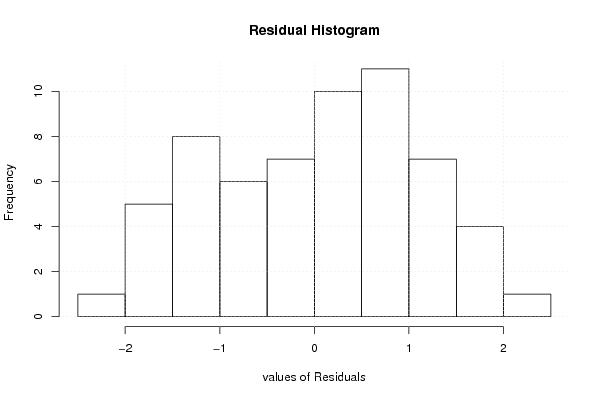
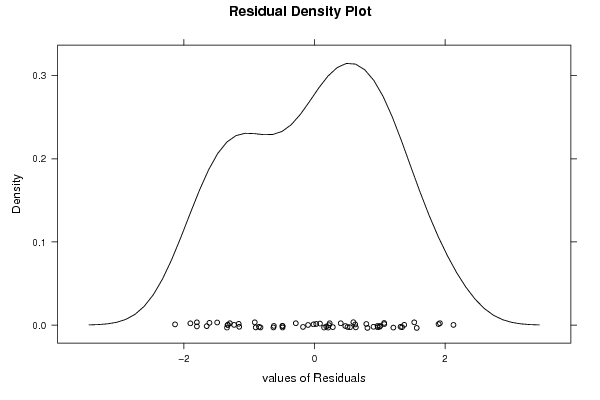
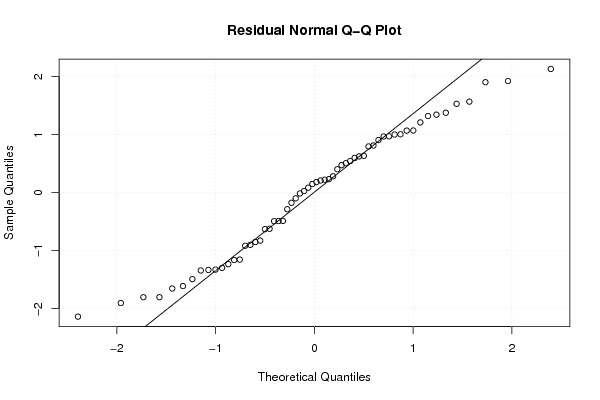
| Multiple Linear Regression - Residual Statistics | |
| Residual Standard Deviation | 1.16791092469633 |
| Sum Squared Residuals | 72.2928441853268 |
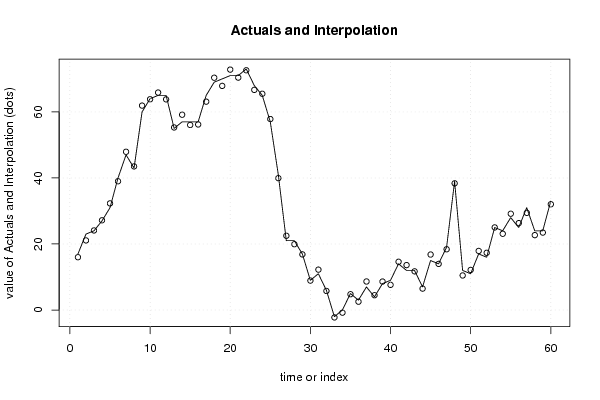
| Multiple Linear Regression - Actuals, Interpolation, and Residuals | |||
| Time or Index | Actuals | Interpolation Forecast | Residuals Prediction Error |
| 1 | 17 | 16.0005028839395 | 0.999497116060498 |
| 2 | 23 | 21.0785851350088 | 1.92141486499121 |
| 3 | 24 | 24.0988069097113 | -0.0988069097112732 |
| 4 | 27 | 27.1760098923622 | -0.176009892362197 |
| 5 | 31 | 32.2971136449659 | -1.29711364496594 |
| 6 | 40 | 38.9956412249249 | 1.00435877507512 |
| 7 | 47 | 47.915901348937 | -0.915901348936988 |
| 8 | 43 | 43.492897318911 | -0.492897318910983 |
| 9 | 60 | 61.9022358268797 | -1.90223582687975 |
| 10 | 64 | 63.8188567783357 | 0.181143221664279 |
| 11 | 65 | 65.8513371250321 | -0.851337125032118 |
| 12 | 65 | 63.7916324045724 | 1.20836759542759 |
| 13 | 55 | 55.2865177726709 | -0.286517772670855 |
| 14 | 57 | 59.1369258668014 | -2.13692586680139 |
| 15 | 57 | 56.0311362696754 | 0.968863730324596 |
| 16 | 57 | 56.1887076609892 | 0.81129233901085 |
| 17 | 65 | 63.0992485570528 | 1.90075144294720 |
| 18 | 69 | 70.3415109530804 | -1.34151095308039 |
| 19 | 70 | 67.870618921976 | 2.12938107802400 |
| 20 | 71 | 72.8024541944872 | -1.80245419448717 |
| 21 | 71 | 70.3761839584662 | 0.623816041533841 |
| 22 | 73 | 72.5979327852552 | 0.402067214744819 |
| 23 | 68 | 66.6579834087148 | 1.34201659128521 |
| 24 | 65 | 65.4879143861214 | -0.487914386121406 |
| 25 | 57 | 57.8275169712083 | -0.827516971208253 |
| 26 | 41 | 39.9305069786169 | 1.06949302138312 |
| 27 | 21 | 22.4911887990251 | -1.49118879902508 |
| 28 | 21 | 19.9329279766545 | 1.06707202334548 |
| 29 | 17 | 16.8531059830811 | 0.146894016918893 |
| 30 | 9 | 8.91607129680916 | 0.0839287031908366 |
| 31 | 11 | 12.2332070083928 | -1.23320700839280 |
| 32 | 6 | 5.77831010555254 | 0.221689894447462 |
| 33 | -2 | -2.23213366557159 | 0.232133665571593 |
| 34 | 0 | -0.79432688913569 | 0.79432688913569 |
| 35 | 5 | 4.79106014092789 | 0.208939859072115 |
| 36 | 3 | 2.52755604281528 | 0.472443957184719 |
| 37 | 7 | 8.65225790918245 | -1.65225790918244 |
| 38 | 4 | 4.48973777896333 | -0.489737778963332 |
| 39 | 8 | 8.62941706266955 | -0.629417062669553 |
| 40 | 9 | 7.62450944344495 | 1.37549055655505 |
| 41 | 14 | 14.6230451518531 | -0.623045151853085 |
| 42 | 12 | 13.6099235941766 | -1.60992359417664 |
| 43 | 12 | 11.7191742357725 | 0.280825764227542 |
| 44 | 7 | 6.4938484692143 | 0.506151530785706 |
| 45 | 15 | 16.8022639404889 | -1.80226394048892 |
| 46 | 14 | 13.9731116147217 | 0.026888385278277 |
| 47 | 19 | 18.4039590673470 | 0.596040932652981 |
| 48 | 39 | 38.3666872309764 | 0.633312769023607 |
| 49 | 12 | 10.4713970960906 | 1.52860290390936 |
| 50 | 11 | 12.1538310865761 | -1.15383108657607 |
| 51 | 17 | 17.899995992758 | -0.899995992758005 |
| 52 | 16 | 17.3325035210105 | -1.33250352101054 |
| 53 | 25 | 25.0149785702887 | -0.0149785702887253 |
| 54 | 24 | 23.0957386079103 | 0.904261392089716 |
| 55 | 28 | 29.1615622869855 | -1.16156228698554 |
| 56 | 25 | 26.3260930021099 | -1.32609300210989 |
| 57 | 31 | 29.4336835680785 | 1.56631643192152 |
| 58 | 24 | 22.6813015372107 | 1.31869846278930 |
| 59 | 24 | 23.4557201436508 | 0.544279856349244 |
| 60 | 33 | 32.0336131112721 | 0.966386888727928 |
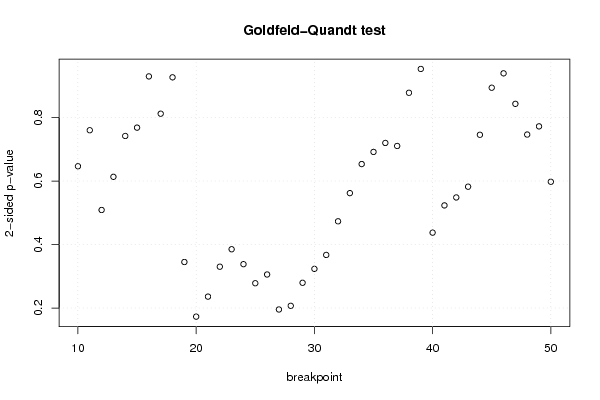
| Goldfeld-Quandt test for Heteroskedasticity | |||
| p-values | Alternative Hypothesis | ||
| breakpoint index | greater | 2-sided | less |
| 10 | 0.32327220229585 | 0.6465444045917 | 0.67672779770415 |
| 11 | 0.380006792593185 | 0.76001358518637 | 0.619993207406815 |
| 12 | 0.254404327279232 | 0.508808654558463 | 0.745595672720768 |
| 13 | 0.30661902010617 | 0.61323804021234 | 0.69338097989383 |
| 14 | 0.629059702566752 | 0.741880594866495 | 0.370940297433248 |
| 15 | 0.615922165350405 | 0.76815566929919 | 0.384077834649595 |
| 16 | 0.535209096065173 | 0.929581807869653 | 0.464790903934827 |
| 17 | 0.593962737103193 | 0.812074525793615 | 0.406037262896807 |
| 18 | 0.536659292798307 | 0.926681414403386 | 0.463340707201693 |
| 19 | 0.82753150243192 | 0.344936995136159 | 0.172468497568080 |
| 20 | 0.913591031550603 | 0.172817936898793 | 0.0864089684493967 |
| 21 | 0.882051270552776 | 0.235897458894449 | 0.117948729447224 |
| 22 | 0.834932217117616 | 0.330135565764768 | 0.165067782882384 |
| 23 | 0.807446163643747 | 0.385107672712507 | 0.192553836356253 |
| 24 | 0.830957366224274 | 0.338085267551451 | 0.169042633775726 |
| 25 | 0.860957663933353 | 0.278084672133293 | 0.139042336066647 |
| 26 | 0.847177977473803 | 0.305644045052394 | 0.152822022526197 |
| 27 | 0.90231194359172 | 0.19537611281656 | 0.09768805640828 |
| 28 | 0.896524234978885 | 0.20695153004223 | 0.103475765021115 |
| 29 | 0.860246355168403 | 0.279507289663195 | 0.139753644831597 |
| 30 | 0.838327838541057 | 0.323344322917886 | 0.161672161458943 |
| 31 | 0.8164013266059 | 0.367197346788199 | 0.183598673394100 |
| 32 | 0.763425690522437 | 0.473148618955125 | 0.236574309477563 |
| 33 | 0.719052505385213 | 0.561894989229575 | 0.280947494614787 |
| 34 | 0.673283211176698 | 0.653433577646604 | 0.326716788823302 |
| 35 | 0.654159067049983 | 0.691681865900035 | 0.345840932950017 |
| 36 | 0.640024117798433 | 0.719951764403134 | 0.359975882201567 |
| 37 | 0.64481205042535 | 0.710375899149299 | 0.355187949574650 |
| 38 | 0.561033848369394 | 0.877932303261212 | 0.438966151630606 |
| 39 | 0.523491474917227 | 0.953017050165545 | 0.476508525082773 |
| 40 | 0.781278860269605 | 0.437442279460789 | 0.218721139730395 |
| 41 | 0.738362873940004 | 0.523274252119992 | 0.261637126059996 |
| 42 | 0.725862808902707 | 0.548274382194585 | 0.274137191097293 |
| 43 | 0.708915917921986 | 0.582168164156027 | 0.291084082078014 |
| 44 | 0.62716373174987 | 0.74567253650026 | 0.37283626825013 |
| 45 | 0.553057366593667 | 0.893885266812665 | 0.446942633406333 |
| 46 | 0.530381441244163 | 0.939237117511674 | 0.469618558755837 |
| 47 | 0.421578206892999 | 0.843156413785999 | 0.578421793107001 |
| 48 | 0.373213224640305 | 0.74642644928061 | 0.626786775359695 |
| 49 | 0.386105985024137 | 0.772211970048273 | 0.613894014975863 |
| 50 | 0.298835307952802 | 0.597670615905603 | 0.701164692047198 |
| Meta Analysis of Goldfeld-Quandt test for Heteroskedasticity | |||
| Description | # significant tests | % significant tests | OK/NOK |
| 1% type I error level | 0 | 0 | OK |
| 5% type I error level | 0 | 0 | OK |
| 10% type I error level | 0 | 0 | OK |