| Multiple Linear Regression - Estimated Regression Equation |
| rijkdom[t] = + 23546.9979632041 + 13.9716805944773Kosten[t] + 2839.80734684669orders[t] + 3.4504396643183dividenden[t] -9004.44968489971t + e[t] |
| Multiple Linear Regression - Ordinary Least Squares | |||||
| Variable | Parameter | S.D. | T-STAT H0: parameter = 0 | 2-tail p-value | 1-tail p-value |
| (Intercept) | 23546.9979632041 | 380044.053397 | 0.062 | 0.95087 | 0.475435 |
| Kosten | 13.9716805944773 | 6.977434 | 2.0024 | 0.051289 | 0.025644 |
| orders | 2839.80734684669 | 1296.710286 | 2.19 | 0.033748 | 0.016874 |
| dividenden | 3.4504396643183 | 1.427679 | 2.4168 | 0.019774 | 0.009887 |
| t | -9004.44968489971 | 8948.121956 | -1.0063 | 0.319654 | 0.159827 |
| Multiple Linear Regression - Regression Statistics | |
| Multiple R | 0.819356821074545 |
| R-squared | 0.671345600241384 |
| Adjusted R-squared | 0.642131875818396 |
| F-TEST (value) | 22.9804865179431 |
| F-TEST (DF numerator) | 4 |
| F-TEST (DF denominator) | 45 |
| p-value | 2.15578666029614e-10 |
| Multiple Linear Regression - Residual Statistics | |
| Residual Standard Deviation | 665198.538833598 |
| Sum Squared Residuals | 19912009322985.9 |
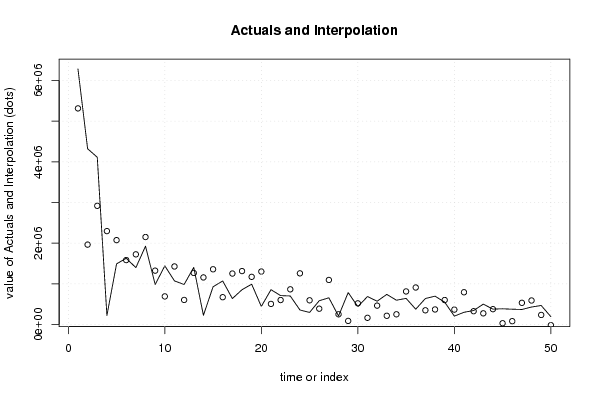
| Multiple Linear Regression - Actuals, Interpolation, and Residuals | |||
| Time or Index | Actuals | Interpolation Forecast | Residuals Prediction Error |
| 1 | 6282154 | 5312798.38827962 | 969355.611720383 |
| 2 | 4321023 | 1964761.02553513 | 2356261.97446487 |
| 3 | 4111912 | 2918355.36755006 | 1193556.63244994 |
| 4 | 223193 | 2297163.42953888 | -2073970.42953888 |
| 5 | 1491348 | 2074761.83695743 | -583413.836957434 |
| 6 | 1629616 | 1584733.98597513 | 44882.0140248697 |
| 7 | 1398893 | 1725832.80251174 | -326939.802511736 |
| 8 | 1926517 | 2151300.18377095 | -224783.183770947 |
| 9 | 983660 | 1325343.44784304 | -341683.447843035 |
| 10 | 1443586 | 692219.87440092 | 751366.12559908 |
| 11 | 1073089 | 1427968.18307141 | -354879.183071411 |
| 12 | 984885 | 604787.148997646 | 380097.851002354 |
| 13 | 1405225 | 1268319.04177319 | 136905.958226813 |
| 14 | 227132 | 1158248.57240919 | -931116.572409195 |
| 15 | 929118 | 1359277.09902911 | -430159.099029107 |
| 16 | 1071292 | 672478.409838741 | 398813.590161259 |
| 17 | 638830 | 1253965.18163934 | -615135.181639337 |
| 18 | 856956 | 1315207.15949732 | -458251.15949732 |
| 19 | 992426 | 1172987.10466583 | -180561.104665831 |
| 20 | 444477 | 1302939.76933944 | -858462.76933944 |
| 21 | 857217 | 507332.880421158 | 349884.119578842 |
| 22 | 711969 | 603052.36046108 | 108916.639538920 |
| 23 | 702380 | 866344.81308629 | -163964.813086290 |
| 24 | 358589 | 1258747.84314716 | -900158.843147165 |
| 25 | 297978 | 596436.922486374 | -298458.922486374 |
| 26 | 585715 | 389817.558596986 | 195897.441403014 |
| 27 | 657954 | 1095903.13535757 | -437949.135357565 |
| 28 | 209458 | 252510.440559002 | -43052.4405590021 |
| 29 | 786690 | 89674.509349172 | 697015.490650828 |
| 30 | 439798 | 521591.046421804 | -81793.0464218044 |
| 31 | 688779 | 166058.412253768 | 522720.587746232 |
| 32 | 574339 | 465458.919371616 | 108880.080628384 |
| 33 | 741409 | 215572.593261336 | 525836.406738664 |
| 34 | 597793 | 252195.594327781 | 345597.405672219 |
| 35 | 644190 | 814380.211608515 | -170190.211608515 |
| 36 | 377934 | 910953.328061551 | -533019.328061551 |
| 37 | 640273 | 350443.242934058 | 289829.757065942 |
| 38 | 697458 | 371210.48746041 | 326247.51253959 |
| 39 | 550608 | 602838.912589964 | -52230.9125899638 |
| 40 | 207393 | 367593.428314317 | -160200.428314317 |
| 41 | 301607 | 794175.592200152 | -492568.592200152 |
| 42 | 345783 | 328840.841760041 | 16942.1582399590 |
| 43 | 501749 | 276009.565421245 | 225739.434578755 |
| 44 | 379983 | 378721.401704276 | 1261.5982957237 |
| 45 | 387475 | 32389.1432055677 | 355085.856794432 |
| 46 | 377305 | 83106.1801522993 | 294198.819847701 |
| 47 | 370837 | 534376.091792169 | -163539.091792169 |
| 48 | 430866 | 591795.055993165 | -160929.055993165 |
| 49 | 469107 | 236190.599987446 | 232916.400012554 |
| 50 | 194493 | -14708.1249103702 | 209201.124910370 |
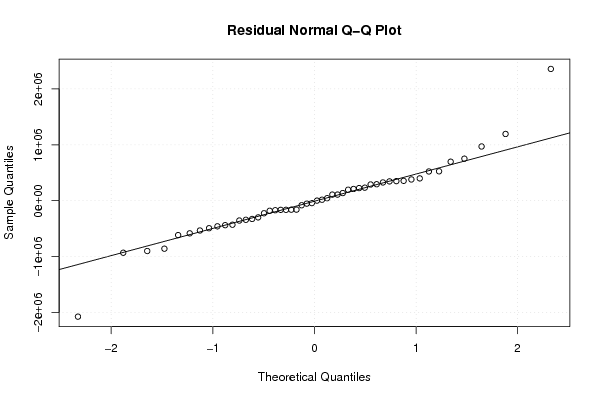
| Goldfeld-Quandt test for Heteroskedasticity | |||
| p-values | Alternative Hypothesis | ||
| breakpoint index | greater | 2-sided | less |
| 8 | 0.996507364156043 | 0.00698527168791362 | 0.00349263584395681 |
| 9 | 0.999999915575747 | 1.68848505856559e-07 | 8.44242529282793e-08 |
| 10 | 0.999999999962175 | 7.56497392957813e-11 | 3.78248696478907e-11 |
| 11 | 0.999999999921175 | 1.57649079762029e-10 | 7.88245398810143e-11 |
| 12 | 0.999999999907506 | 1.84987113470480e-10 | 9.24935567352399e-11 |
| 13 | 0.999999999988364 | 2.327196614098e-11 | 1.163598307049e-11 |
| 14 | 0.999999999999428 | 1.14480665504541e-12 | 5.72403327522705e-13 |
| 15 | 0.999999999998775 | 2.44957312459637e-12 | 1.22478656229818e-12 |
| 16 | 0.999999999999574 | 8.5281339558329e-13 | 4.26406697791645e-13 |
| 17 | 0.999999999999248 | 1.50442013722568e-12 | 7.52210068612842e-13 |
| 18 | 0.99999999999854 | 2.92152805809135e-12 | 1.46076402904568e-12 |
| 19 | 0.999999999999335 | 1.33023257481046e-12 | 6.65116287405231e-13 |
| 20 | 0.999999999997473 | 5.05368201986704e-12 | 2.52684100993352e-12 |
| 21 | 0.999999999998773 | 2.45336240116369e-12 | 1.22668120058185e-12 |
| 22 | 0.999999999996953 | 6.09438168460284e-12 | 3.04719084230142e-12 |
| 23 | 0.999999999983847 | 3.23059375217913e-11 | 1.61529687608957e-11 |
| 24 | 0.999999999935434 | 1.29132475870623e-10 | 6.45662379353113e-11 |
| 25 | 0.999999999967523 | 6.49539117069232e-11 | 3.24769558534616e-11 |
| 26 | 0.999999999904993 | 1.90013328470725e-10 | 9.50066642353624e-11 |
| 27 | 0.999999999734172 | 5.31656405211626e-10 | 2.65828202605813e-10 |
| 28 | 0.999999999986795 | 2.64092849132215e-11 | 1.32046424566108e-11 |
| 29 | 0.999999999966555 | 6.68891716037278e-11 | 3.34445858018639e-11 |
| 30 | 0.999999999852316 | 2.95368350504495e-10 | 1.47684175252247e-10 |
| 31 | 0.999999999159435 | 1.68113033363307e-09 | 8.40565166816536e-10 |
| 32 | 0.999999994893842 | 1.02123164506304e-08 | 5.10615822531519e-09 |
| 33 | 0.999999979319718 | 4.13605648519324e-08 | 2.06802824259662e-08 |
| 34 | 0.999999866628176 | 2.66743647837215e-07 | 1.33371823918608e-07 |
| 35 | 0.999999373897168 | 1.25220566479113e-06 | 6.26102832395563e-07 |
| 36 | 0.999996496292153 | 7.00741569405198e-06 | 3.50370784702599e-06 |
| 37 | 0.999986063702449 | 2.78725951024098e-05 | 1.39362975512049e-05 |
| 38 | 0.99998514311821 | 2.97137635789386e-05 | 1.48568817894693e-05 |
| 39 | 0.999931373997867 | 0.000137252004266326 | 6.8626002133163e-05 |
| 40 | 0.999740855189907 | 0.00051828962018701 | 0.000259144810093505 |
| 41 | 0.999411235106942 | 0.00117752978611604 | 0.000588764893058021 |
| 42 | 0.99571466189858 | 0.00857067620284053 | 0.00428533810142026 |
| Meta Analysis of Goldfeld-Quandt test for Heteroskedasticity | |||
| Description | # significant tests | % significant tests | OK/NOK |
| 1% type I error level | 35 | 1 | NOK |
| 5% type I error level | 35 | 1 | NOK |
| 10% type I error level | 35 | 1 | NOK |