| Multiple Linear Regression - Estimated Regression Equation |
| PPS [t] = + 12.3626548087474 -0.271598260496138month[t] -0.701955619751661IDT[t] + 1.63777243794683HPP[t] + 0.346154125445987TGYW[t] -0.462987710989521POP[t] + e[t] |
| Multiple Linear Regression - Ordinary Least Squares | |||||
| Variable | Parameter | S.D. | T-STAT H0: parameter = 0 | 2-tail p-value | 1-tail p-value |
| (Intercept) | 12.3626548087474 | 1.681136 | 7.3538 | 0 | 0 |
| month | -0.271598260496138 | 0.129694 | -2.0941 | 0.04048 | 0.02024 |
| IDT | -0.701955619751661 | 0.14758 | -4.7564 | 1.3e-05 | 6e-06 |
| HPP | 1.63777243794683 | 0.145915 | 11.2242 | 0 | 0 |
| TGYW | 0.346154125445987 | 0.139134 | 2.4879 | 0.015644 | 0.007822 |
| POP | -0.462987710989521 | 0.074714 | -6.1968 | 0 | 0 |
| Multiple Linear Regression - Regression Statistics | |
| Multiple R | 0.96924657672412 |
| R-squared | 0.939438926491427 |
| Adjusted R-squared | 0.934392170365712 |
| F-TEST (value) | 186.147082024581 |
| F-TEST (DF numerator) | 5 |
| F-TEST (DF denominator) | 60 |
| p-value | 0 |
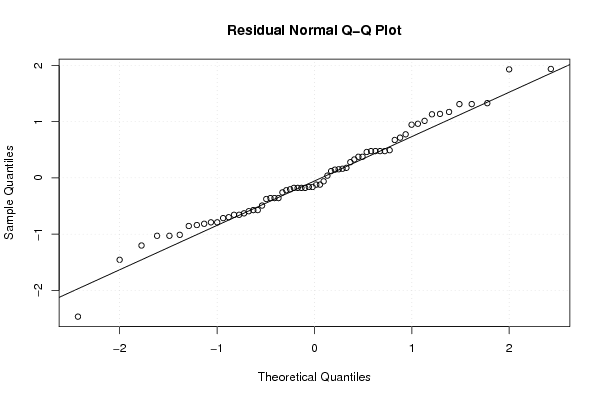
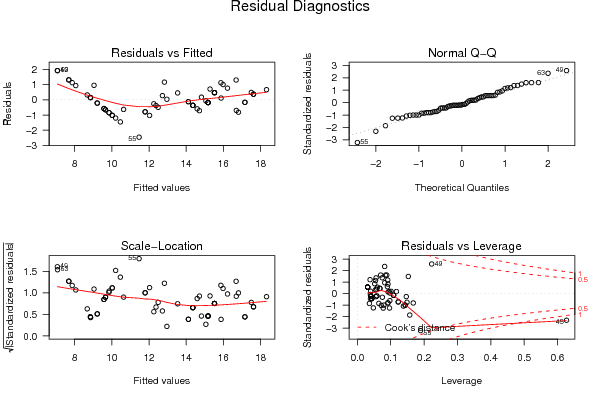
| Multiple Linear Regression - Residual Statistics | |
| Residual Standard Deviation | 0.85137331720911 |
| Sum Squared Residuals | 43.4901915153386 |
| Multiple Linear Regression - Actuals, Interpolation, and Residuals | |||
| Time or Index | Actuals | Interpolation Forecast | Residuals Prediction Error |
| 1 | 14 | 13.5401634929783 | 0.459836507021658 |
| 2 | 18 | 17.6248502053074 | 0.375149794692564 |
| 3 | 11 | 11.7900981280290 | -0.790098128028982 |
| 4 | 12 | 12.4920537477806 | -0.492053747780638 |
| 5 | 16 | 15.2851221476090 | 0.714877852391032 |
| 6 | 18 | 17.6248502053075 | 0.375149794692547 |
| 7 | 14 | 14.1201788168678 | -0.120178816867784 |
| 8 | 14 | 14.3591467256299 | -0.359146725629924 |
| 9 | 15 | 15.1779359309251 | -0.177935930925119 |
| 10 | 15 | 15.1779359309251 | -0.177935930925119 |
| 11 | 17 | 15.8702441818171 | 1.12975581818291 |
| 12 | 19 | 18.3268058250591 | 0.673194174940884 |
| 13 | 10 | 10.6302615076064 | -0.630261507606432 |
| 14 | 16 | 15.8798915506768 | 0.120108449323221 |
| 15 | 18 | 17.5080166197639 | 0.491983380236079 |
| 16 | 14 | 14.3591467256299 | -0.359146725629924 |
| 17 | 14 | 14.7149482199356 | -0.714948219935597 |
| 18 | 17 | 15.9870777673606 | 1.01292223263937 |
| 19 | 14 | 14.592813896717 | -0.592813896716992 |
| 20 | 16 | 16.8157083688719 | -0.815708368871946 |
| 21 | 18 | 16.6890333871123 | 1.31096661288771 |
| 22 | 11 | 12.0290660367911 | -1.02906603679112 |
| 23 | 14 | 12.8285605043669 | 1.17143949563306 |
| 24 | 12 | 12.3752201622371 | -0.375220162237108 |
| 25 | 17 | 17.1618624943179 | -0.161862494317934 |
| 26 | 9 | 9.5725043935491 | -0.572504393549098 |
| 27 | 16 | 15.5240900563711 | 0.475909943628894 |
| 28 | 14 | 14.1201788168678 | -0.120178816867784 |
| 29 | 15 | 14.8221344366194 | 0.177865563380555 |
| 30 | 11 | 11.7900981280290 | -0.790098128028981 |
| 31 | 16 | 15.5240900563711 | 0.475909943628894 |
| 32 | 13 | 12.7213742876831 | 0.278625712316904 |
| 33 | 17 | 16.2260456761228 | 0.773954323877234 |
| 34 | 15 | 15.1779359309251 | -0.177935930925119 |
| 35 | 14 | 14.3591467256299 | -0.359146725629924 |
| 36 | 16 | 15.5240900563711 | 0.475909943628894 |
| 37 | 9 | 9.5725043935491 | -0.572504393549098 |
| 38 | 15 | 15.1779359309251 | -0.177935930925119 |
| 39 | 17 | 17.1618624943179 | -0.161862494317934 |
| 40 | 13 | 12.9603421964452 | 0.0396578035547650 |
| 41 | 15 | 15.0611023453816 | -0.0611023453815845 |
| 42 | 16 | 15.5240900563711 | 0.475909943628894 |
| 43 | 16 | 16.6988747833284 | -0.698874783328412 |
| 44 | 12 | 12.2583865766936 | -0.258386576693574 |
| 45 | 9 | 10.2019046955839 | -1.20190469558392 |
| 46 | 9 | 10.0293097768016 | -1.02930977680163 |
| 47 | 9 | 9.656372272031 | -0.656372272030992 |
| 48 | 9 | 7.67244570863818 | 1.32755429136182 |
| 49 | 9 | 7.06453471891218 | 1.93546528108782 |
| 50 | 9 | 8.05522460962494 | 0.944775390375059 |
| 51 | 9 | 9.20303192990116 | -0.203031929901157 |
| 52 | 9 | 8.83738903937936 | 0.162610960620642 |
| 53 | 9 | 7.68958171910314 | 1.31041828089686 |
| 54 | 9 | 10.4556727122504 | -1.45567271225038 |
| 55 | 9 | 11.4660453953954 | -2.46604539539539 |
| 56 | 9 | 9.656372272031 | -0.656372272030992 |
| 57 | 9 | 8.84723043559548 | 0.152769564404517 |
| 58 | 9 | 10.0121737663367 | -1.01217376633667 |
| 59 | 9 | 9.83792032630825 | -0.83792032630825 |
| 60 | 9 | 9.22016794036612 | -0.220167940366124 |
| 61 | 9 | 9.85505633677322 | -0.855056336773216 |
| 62 | 9 | 8.67297699556707 | 0.327023004432932 |
| 63 | 9 | 7.07182933316102 | 1.92817066683898 |
| 64 | 9 | 7.86383515913156 | 1.13616484086844 |
| 65 | 10 | 9.03861988608887 | 0.961380113911134 |
| 66 | 9 | 8.85452504984432 | 0.145474950155675 |
| Goldfeld-Quandt test for Heteroskedasticity | |||
| p-values | Alternative Hypothesis | ||
| breakpoint index | greater | 2-sided | less |
| 9 | 1.35823420748817e-45 | 2.71646841497634e-45 | 1 |
| 10 | 2.39633575973120e-58 | 4.79267151946239e-58 | 1 |
| 11 | 2.04729788445263e-71 | 4.09459576890526e-71 | 1 |
| 12 | 8.7294060425557e-89 | 1.74588120851114e-88 | 1 |
| 13 | 4.69848455330046e-103 | 9.39696910660093e-103 | 1 |
| 14 | 2.99870075389537e-112 | 5.99740150779074e-112 | 1 |
| 15 | 8.117640567476e-130 | 1.6235281134952e-129 | 1 |
| 16 | 1.88964173049767e-151 | 3.77928346099534e-151 | 1 |
| 17 | 3.88166471890371e-164 | 7.76332943780743e-164 | 1 |
| 18 | 1.05144555499544e-169 | 2.10289110999087e-169 | 1 |
| 19 | 1.32942189244611e-182 | 2.65884378489222e-182 | 1 |
| 20 | 1.53334611139465e-206 | 3.06669222278931e-206 | 1 |
| 21 | 2.56493426529932e-210 | 5.12986853059864e-210 | 1 |
| 22 | 1.67114565831816e-229 | 3.34229131663631e-229 | 1 |
| 23 | 1.45437715600628e-240 | 2.90875431201256e-240 | 1 |
| 24 | 6.13388774954837e-255 | 1.22677754990967e-254 | 1 |
| 25 | 4.82460320934848e-275 | 9.64920641869696e-275 | 1 |
| 26 | 6.13142434091288e-288 | 1.22628486818258e-287 | 1 |
| 27 | 5.6330123740738e-310 | 1.12660247481476e-309 | 1 |
| 28 | 5.00144745695896e-308 | 1.00028949139179e-307 | 1 |
| 29 | 0 | 0 | 1 |
| 30 | 0 | 0 | 1 |
| 31 | 0 | 0 | 1 |
| 32 | 0 | 0 | 1 |
| 33 | 0 | 0 | 1 |
| 34 | 0 | 0 | 1 |
| 35 | 0 | 0 | 1 |
| 36 | 0 | 0 | 1 |
| 37 | 0 | 0 | 1 |
| 38 | 0 | 0 | 1 |
| 39 | 0 | 0 | 1 |
| 40 | 0 | 0 | 1 |
| 41 | 0 | 0 | 1 |
| 42 | 0 | 0 | 1 |
| 43 | 0 | 0 | 1 |
| 44 | 0 | 0 | 1 |
| 45 | 0.891494390341427 | 0.217011219317145 | 0.108505609658573 |
| 46 | 0.847135275450119 | 0.305729449099763 | 0.152864724549881 |
| 47 | 0.863314290724816 | 0.273371418550369 | 0.136685709275184 |
| 48 | 0.98063125802567 | 0.0387374839486596 | 0.0193687419743298 |
| 49 | 0.998463049817375 | 0.00307390036524967 | 0.00153695018262483 |
| 50 | 0.99723684231633 | 0.00552631536733792 | 0.00276315768366896 |
| 51 | 0.994500825987723 | 0.0109983480245538 | 0.00549917401227692 |
| 52 | 0.98748209393324 | 0.0250358121335212 | 0.0125179060667606 |
| 53 | 0.973720720052559 | 0.0525585598948823 | 0.0262792799474412 |
| 54 | 0.981639888306056 | 0.0367202233878886 | 0.0183601116939443 |
| 55 | 0.98277223820777 | 0.0344555235844617 | 0.0172277617922309 |
| 56 | 0.96282266112346 | 0.074354677753079 | 0.0371773388765395 |
| 57 | 0.924217256887076 | 0.151565486225848 | 0.075782743112924 |
| Meta Analysis of Goldfeld-Quandt test for Heteroskedasticity | |||
| Description | # significant tests | % significant tests | OK/NOK |
| 1% type I error level | 38 | 0.775510204081633 | NOK |
| 5% type I error level | 43 | 0.877551020408163 | NOK |
| 10% type I error level | 45 | 0.918367346938776 | NOK |