| Multiple Linear Regression - Estimated Regression Equation |
| I.P.C.N.[t] = + 35.3607050481266 + 0.80254709385946T.I.P.[t] + 4.40769055462786M1[t] -1.67120091994249M2[t] -1.61314465658158M3[t] -3.05293292720597M4[t] -2.50303586532052M5[t] -5.22204938138058M6[t] + 13.1270665500966M7[t] + 5.15709840515961M8[t] -10.8793637664784M9[t] -8.40882886848744M10[t] -6.11396816149799M11[t] -0.120470689324152t + e[t] |
| Multiple Linear Regression - Ordinary Least Squares | |||||
| Variable | Parameter | S.D. | T-STAT H0: parameter = 0 | 2-tail p-value | 1-tail p-value |
| (Intercept) | 35.3607050481266 | 8.439546 | 4.1899 | 0.000125 | 6.3e-05 |
| T.I.P. | 0.80254709385946 | 0.0814 | 9.8593 | 0 | 0 |
| M1 | 4.40769055462786 | 2.479298 | 1.7778 | 0.082048 | 0.041024 |
| M2 | -1.67120091994249 | 2.48515 | -0.6725 | 0.504646 | 0.252323 |
| M3 | -1.61314465658158 | 2.657938 | -0.6069 | 0.546891 | 0.273445 |
| M4 | -3.05293292720597 | 2.513266 | -1.2147 | 0.230669 | 0.115334 |
| M5 | -2.50303586532052 | 2.503426 | -0.9998 | 0.322617 | 0.161308 |
| M6 | -5.22204938138058 | 2.74159 | -1.9048 | 0.063076 | 0.031538 |
| M7 | 13.1270665500966 | 2.600069 | 5.0487 | 7e-06 | 4e-06 |
| M8 | 5.15709840515961 | 2.45626 | 2.0996 | 0.041281 | 0.020641 |
| M9 | -10.8793637664784 | 2.72884 | -3.9868 | 0.000237 | 0.000119 |
| M10 | -8.40882886848744 | 2.758882 | -3.0479 | 0.003812 | 0.001906 |
| M11 | -6.11396816149799 | 2.546047 | -2.4014 | 0.020433 | 0.010216 |
| t | -0.120470689324152 | 0.030364 | -3.9675 | 0.000252 | 0.000126 |
| Multiple Linear Regression - Regression Statistics | |
| Multiple R | 0.889237640042933 |
| R-squared | 0.790743580469125 |
| Adjusted R-squared | 0.731605896688661 |
| F-TEST (value) | 13.3712301517351 |
| F-TEST (DF numerator) | 13 |
| F-TEST (DF denominator) | 46 |
| p-value | 1.52531320907201e-11 |
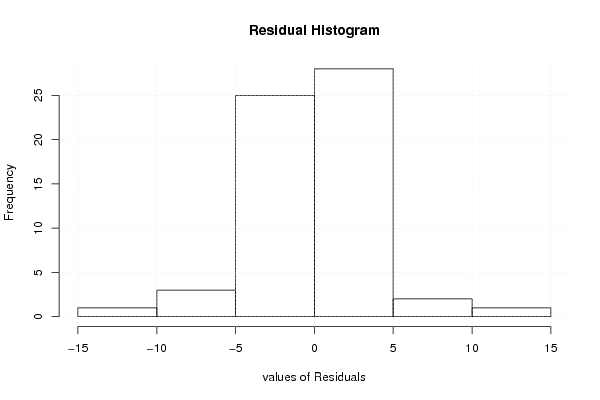
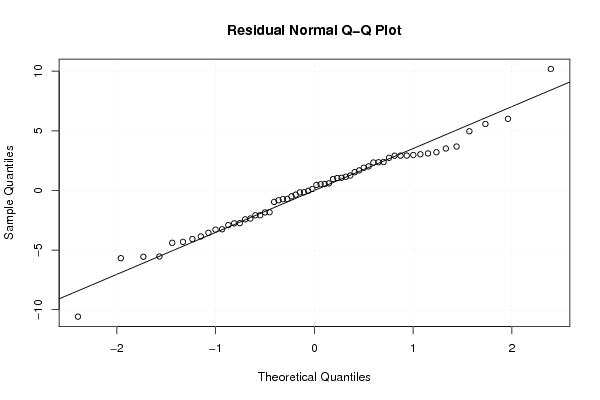
| Multiple Linear Regression - Residual Statistics | |
| Residual Standard Deviation | 3.87919616466738 |
| Sum Squared Residuals | 692.215492662624 |
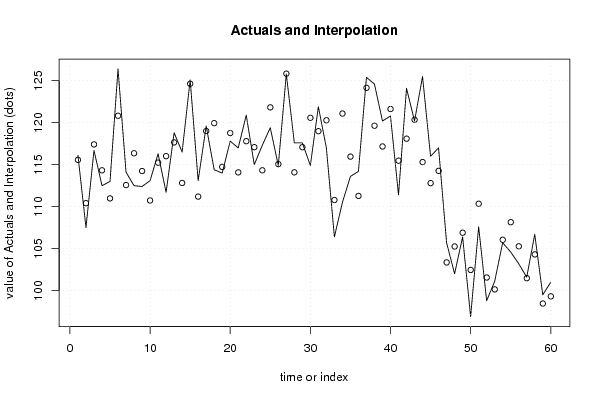
| Multiple Linear Regression - Actuals, Interpolation, and Residuals | |||
| Time or Index | Actuals | Interpolation Forecast | Residuals Prediction Error |
| 1 | 116.1 | 115.568879992535 | 0.531120007464972 |
| 2 | 107.5 | 110.412829050658 | -2.91282905065792 |
| 3 | 116.7 | 117.412829050658 | -0.71282905065791 |
| 4 | 112.5 | 114.327730612376 | -1.82773061237640 |
| 5 | 113 | 110.985185643798 | 2.01481435620177 |
| 6 | 126.4 | 120.825945521393 | 5.57405447860652 |
| 7 | 114.1 | 112.570536666184 | 1.52946333381559 |
| 8 | 112.5 | 116.357794821043 | -3.85779482104322 |
| 9 | 112.4 | 114.245436102622 | -1.84543610262157 |
| 10 | 113.1 | 110.736906526114 | 2.36309347388565 |
| 11 | 116.3 | 115.238683115972 | 1.06131688402794 |
| 12 | 111.7 | 116.015624478059 | -4.31562447805942 |
| 13 | 118.8 | 117.654438933627 | 1.14556106637307 |
| 14 | 116.5 | 112.819406829293 | 3.6805931707065 |
| 15 | 125.1 | 124.634689392450 | 0.465310607549739 |
| 16 | 113.1 | 111.196733443382 | 1.90326655661828 |
| 17 | 119.6 | 119.00959307945 | 0.590406920549954 |
| 18 | 114.4 | 119.942080215205 | -5.54208021520527 |
| 19 | 114 | 114.736350316662 | -0.73635031666215 |
| 20 | 117.8 | 118.764372599679 | -0.964372599678796 |
| 21 | 117 | 114.083863180907 | 2.91613681909310 |
| 22 | 120.9 | 117.798257449135 | 3.10174255086521 |
| 23 | 115 | 117.083477928906 | -2.08347792890604 |
| 24 | 117.3 | 114.329212078012 | 2.97078792198823 |
| 25 | 119.4 | 121.826620318753 | -2.42662031875331 |
| 26 | 114.9 | 115.065475189157 | -0.165475189157182 |
| 27 | 125.8 | 125.837446530297 | -0.0374465302966489 |
| 28 | 117.6 | 114.084839478333 | 3.51516052166703 |
| 29 | 117.6 | 117.082416551245 | 0.517583448755456 |
| 30 | 114.9 | 120.58305438735 | -5.68305438735005 |
| 31 | 121.9 | 118.988786411174 | 2.91121358882552 |
| 32 | 117 | 120.288148575069 | -3.28814857506897 |
| 33 | 106.4 | 110.792356593140 | -4.39235659314032 |
| 34 | 110.5 | 121.087637031016 | -10.5876370310158 |
| 35 | 113.6 | 115.95884849456 | -2.35884849456000 |
| 36 | 114.2 | 111.278469618403 | 2.92153038159698 |
| 37 | 125.4 | 124.152943388003 | 1.24705661199705 |
| 38 | 124.6 | 119.638930121213 | 4.96106987878668 |
| 39 | 120.2 | 117.168874413672 | 3.03112558632831 |
| 40 | 120.8 | 121.627718657669 | -0.827718657669097 |
| 41 | 111.4 | 115.476258860583 | -4.07625886058282 |
| 42 | 124.1 | 118.094094893443 | 6.00590510655705 |
| 43 | 120.2 | 120.352052967793 | -0.152052967792771 |
| 44 | 125.5 | 115.311293090198 | 10.1887069098025 |
| 45 | 116 | 112.797660824846 | 3.20233917515382 |
| 46 | 117 | 114.264923230268 | 2.73507676973241 |
| 47 | 105.7 | 103.357795618024 | 2.34220438197630 |
| 48 | 102 | 105.258302911514 | -3.25830291151428 |
| 49 | 106.4 | 106.897117367082 | -0.497117367081779 |
| 50 | 96.9 | 102.463358809678 | -5.56335880967808 |
| 51 | 107.6 | 110.346160612923 | -2.74616061292350 |
| 52 | 98.8 | 101.562977808240 | -2.76297780823982 |
| 53 | 101.1 | 100.146545864924 | 0.95345413507564 |
| 54 | 105.7 | 106.054824982608 | -0.354824982608252 |
| 55 | 104.6 | 108.152273638186 | -3.55227363818620 |
| 56 | 103.2 | 105.278390914011 | -2.07839091401149 |
| 57 | 101.6 | 101.480683298485 | 0.119316701514982 |
| 58 | 106.7 | 104.312275763467 | 2.38772423653252 |
| 59 | 99.5 | 98.4611948425382 | 1.03880515746181 |
| 60 | 101 | 99.3183909140115 | 1.68160908598851 |
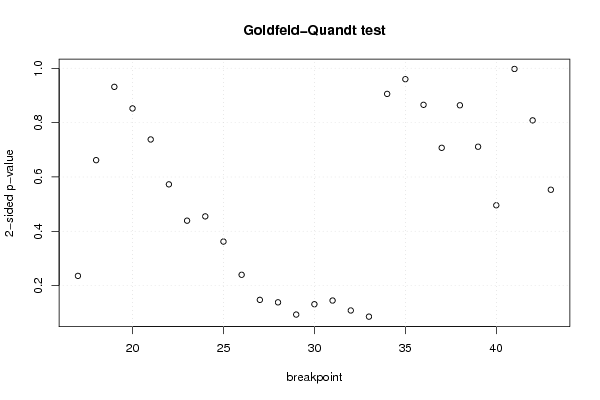
| Goldfeld-Quandt test for Heteroskedasticity | |||
| p-values | Alternative Hypothesis | ||
| breakpoint index | greater | 2-sided | less |
| 17 | 0.117915118832620 | 0.235830237665240 | 0.88208488116738 |
| 18 | 0.669119897642092 | 0.661760204715816 | 0.330880102357908 |
| 19 | 0.534201641346125 | 0.93159671730775 | 0.465798358653875 |
| 20 | 0.426092123603887 | 0.852184247207775 | 0.573907876396113 |
| 21 | 0.368988038765255 | 0.737976077530509 | 0.631011961234745 |
| 22 | 0.286366660834793 | 0.572733321669585 | 0.713633339165207 |
| 23 | 0.219543857156316 | 0.439087714312632 | 0.780456142843684 |
| 24 | 0.227455230415668 | 0.454910460831337 | 0.772544769584332 |
| 25 | 0.181112730615597 | 0.362225461231194 | 0.818887269384403 |
| 26 | 0.119980692282968 | 0.239961384565935 | 0.880019307717032 |
| 27 | 0.0737994389073882 | 0.147598877814776 | 0.926200561092612 |
| 28 | 0.0693029613401554 | 0.138605922680311 | 0.930697038659845 |
| 29 | 0.0467686664687126 | 0.0935373329374253 | 0.953231333531287 |
| 30 | 0.0657919213349363 | 0.131583842669873 | 0.934208078665064 |
| 31 | 0.0725837543393367 | 0.145167508678673 | 0.927416245660663 |
| 32 | 0.0543034651069253 | 0.108606930213851 | 0.945696534893075 |
| 33 | 0.0429249078545572 | 0.0858498157091145 | 0.957075092145443 |
| 34 | 0.452841518433914 | 0.905683036867828 | 0.547158481566086 |
| 35 | 0.520089485042161 | 0.959821029915678 | 0.479910514957839 |
| 36 | 0.432761168990491 | 0.865522337980982 | 0.567238831009509 |
| 37 | 0.353614586807036 | 0.707229173614072 | 0.646385413192964 |
| 38 | 0.431911901468352 | 0.863823802936704 | 0.568088098531648 |
| 39 | 0.355621736083964 | 0.711243472167929 | 0.644378263916036 |
| 40 | 0.247886374143954 | 0.495772748287908 | 0.752113625856046 |
| 41 | 0.498751580339638 | 0.997503160679276 | 0.501248419660362 |
| 42 | 0.404151730578281 | 0.808303461156563 | 0.595848269421719 |
| 43 | 0.276446229730004 | 0.552892459460008 | 0.723553770269996 |
| Meta Analysis of Goldfeld-Quandt test for Heteroskedasticity | |||
| Description | # significant tests | % significant tests | OK/NOK |
| 1% type I error level | 0 | 0 | OK |
| 5% type I error level | 0 | 0 | OK |
| 10% type I error level | 2 | 0.0740740740740741 | OK |