| Multiple Linear Regression - Estimated Regression Equation |
| PSS [t] = + 10.1553588186132 -0.520868917539679IDT[t] + 1.95835376594494HPP[t] + 0.0420113088658964TGYW[t] -0.876103192773687POP[t] + e[t] |
| Multiple Linear Regression - Ordinary Least Squares | |||||
| Variable | Parameter | S.D. | T-STAT H0: parameter = 0 | 2-tail p-value | 1-tail p-value |
| (Intercept) | 10.1553588186132 | 1.266727 | 8.017 | 0 | 0 |
| IDT | -0.520868917539679 | 0.218734 | -2.3813 | 0.020388 | 0.010194 |
| HPP | 1.95835376594494 | 0.216052 | 9.0643 | 0 | 0 |
| TGYW | 0.0420113088658964 | 0.19652 | 0.2138 | 0.831434 | 0.415717 |
| POP | -0.876103192773687 | 0.04024 | -21.7721 | 0 | 0 |
| Multiple Linear Regression - Regression Statistics | |
| Multiple R | 0.978298437003284 |
| R-squared | 0.957067831843069 |
| Adjusted R-squared | 0.95425260770163 |
| F-TEST (value) | 339.961503510753 |
| F-TEST (DF numerator) | 4 |
| F-TEST (DF denominator) | 61 |
| p-value | 0 |
| Multiple Linear Regression - Residual Statistics | |
| Residual Standard Deviation | 1.26192173482487 |
| Sum Squared Residuals | 97.1392343542274 |
| Multiple Linear Regression - Actuals, Interpolation, and Residuals | |||
| Time or Index | Actuals | Interpolation Forecast | Residuals Prediction Error |
| 1 | 14 | 13.3625098224190 | 0.63749017758097 |
| 2 | 18 | 18.1973318559485 | -0.197331855948476 |
| 3 | 11 | 12.2787606784738 | -1.27876067847376 |
| 4 | 12 | 12.7996295960134 | -0.799629596013432 |
| 5 | 16 | 15.7181091724639 | 0.281890827536145 |
| 6 | 18 | 18.1973318559485 | -0.197331855948481 |
| 7 | 14 | 14.3211370621505 | -0.321137062150492 |
| 8 | 14 | 13.9659027869165 | 0.0340972130835166 |
| 9 | 15 | 15.3208635883640 | -0.320863588363953 |
| 10 | 15 | 15.3208635883640 | -0.320863588363953 |
| 11 | 17 | 15.4048862060957 | 1.59511379390425 |
| 12 | 19 | 18.7182007734882 | 0.28179922651184 |
| 13 | 10 | 9.6099383620608 | 0.390061637939208 |
| 14 | 16 | 15.8417325059036 | 0.158267494096370 |
| 15 | 18 | 17.3632399720407 | 0.636760027959309 |
| 16 | 14 | 13.9659027869165 | 0.0340972130835166 |
| 17 | 14 | 14.4447603955903 | -0.444760395590265 |
| 18 | 17 | 16.2389780900035 | 0.761021909996464 |
| 19 | 14 | 15.6340865547321 | -1.63408655473206 |
| 20 | 16 | 17.2792173543089 | -1.27921735430890 |
| 21 | 18 | 16.7598470075432 | 1.24015299245679 |
| 22 | 11 | 11.9235264032397 | -0.923526403239746 |
| 23 | 14 | 12.4047946050714 | 1.59520539492856 |
| 24 | 12 | 11.9655377121056 | 0.0344622878943579 |
| 25 | 17 | 17.3212286631748 | -0.321228663174794 |
| 26 | 9 | 8.61021183584733 | 0.389788164152668 |
| 27 | 16 | 15.3628748972298 | 0.637125102770151 |
| 28 | 14 | 14.3211370621505 | -0.321137062150492 |
| 29 | 15 | 14.8420059796902 | 0.157994020309829 |
| 30 | 11 | 12.2787606784738 | -1.27876067847375 |
| 31 | 16 | 15.3628748972298 | 0.637125102770151 |
| 32 | 13 | 12.0075490209715 | 0.992450979028461 |
| 33 | 17 | 15.8837438147695 | 1.11625618523047 |
| 34 | 15 | 15.3208635883640 | -0.320863588363953 |
| 35 | 14 | 13.9659027869165 | 0.0340972130835166 |
| 36 | 16 | 15.3628748972298 | 0.637125102770151 |
| 37 | 9 | 8.61021183584733 | 0.389788164152668 |
| 38 | 15 | 15.3208635883640 | -0.320863588363953 |
| 39 | 17 | 17.3212286631748 | -0.321228663174794 |
| 40 | 13 | 11.6523147457375 | 1.34768525426247 |
| 41 | 15 | 14.4867717044562 | 0.513228295543838 |
| 42 | 16 | 15.3628748972298 | 0.637125102770151 |
| 43 | 16 | 16.4451254704011 | -0.445125470401108 |
| 44 | 12 | 11.1314458281979 | 0.868554171802148 |
| 45 | 4 | 6.51782035176119 | -2.51782035176119 |
| 46 | 2 | 4.95671216991615 | -2.95671216991615 |
| 47 | 2 | 2.88978424722667 | -0.889784247226668 |
| 48 | 3 | 0.889419172415828 | 2.11058082758417 |
| 49 | 4 | 0.532686326407824 | 3.46731367359218 |
| 50 | 2 | 2.6416255579632 | -0.641625557963201 |
| 51 | 2 | 2.45052735426087 | -0.450527354260866 |
| 52 | 4 | 2.28639128272919 | 1.71360871727081 |
| 53 | 2 | 2.47748948643153 | -0.477489486431525 |
| 54 | 3 | 4.12262028600836 | -1.12262028600836 |
| 55 | 2 | 5.60211644327952 | -3.60211644327952 |
| 56 | 2 | 2.88978424722667 | -0.889784247226668 |
| 57 | 2 | 1.97166974558709 | 0.0283302544129144 |
| 58 | 3 | 3.36864185590045 | -0.368641855900451 |
| 59 | 4 | 4.08060897714246 | -0.0806089771424606 |
| 60 | 5 | 4.03859766827656 | 0.961402331723435 |
| 61 | 3 | 5.66867929115816 | -2.66867929115816 |
| 62 | 5 | 2.68363686682910 | 2.31636313317090 |
| 63 | 3 | 2.43547817756563 | 0.564521822434371 |
| 64 | 3 | 1.76552236518951 | 1.23447763481049 |
| 65 | 4 | 2.84777293836077 | 1.15222706163923 |
| 66 | 2 | 3.87446159674489 | -1.87446159674489 |
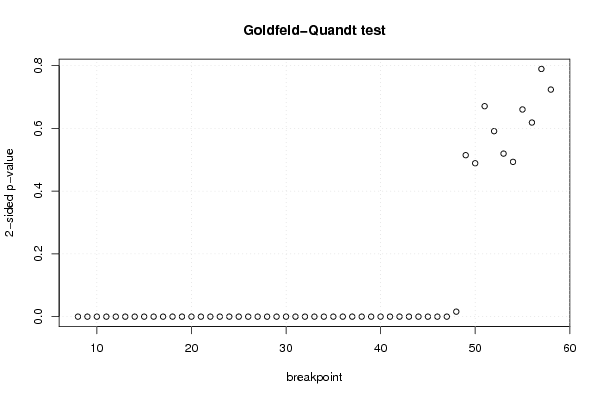
| Goldfeld-Quandt test for Heteroskedasticity | |||
| p-values | Alternative Hypothesis | ||
| breakpoint index | greater | 2-sided | less |
| 8 | 2.79998503580386e-45 | 5.59997007160772e-45 | 1 |
| 9 | 8.16327510657914e-62 | 1.63265502131583e-61 | 1 |
| 10 | 1.75052235359545e-76 | 3.50104470719089e-76 | 1 |
| 11 | 7.84368455104672e-90 | 1.56873691020934e-89 | 1 |
| 12 | 7.74145762327922e-104 | 1.54829152465584e-103 | 1 |
| 13 | 1.99595884950762e-122 | 3.99191769901524e-122 | 1 |
| 14 | 1.33360477526321e-136 | 2.66720955052643e-136 | 1 |
| 15 | 1.94867286447563e-151 | 3.89734572895126e-151 | 1 |
| 16 | 6.99764990601721e-169 | 1.39952998120344e-168 | 1 |
| 17 | 3.19756635816382e-177 | 6.39513271632765e-177 | 1 |
| 18 | 5.58257896207352e-190 | 1.11651579241470e-189 | 1 |
| 19 | 2.73148604118621e-202 | 5.46297208237241e-202 | 1 |
| 20 | 4.10852543346868e-228 | 8.21705086693736e-228 | 1 |
| 21 | 2.61492743630928e-244 | 5.22985487261855e-244 | 1 |
| 22 | 2.94211822248889e-251 | 5.88423644497778e-251 | 1 |
| 23 | 1.20311867757799e-266 | 2.40623735515598e-266 | 1 |
| 24 | 2.12486940231445e-284 | 4.2497388046289e-284 | 1 |
| 25 | 4.91166617772329e-308 | 9.82333235544658e-308 | 1 |
| 26 | 1.48318020413822e-309 | 2.96636040827643e-309 | 1 |
| 27 | 0 | 0 | 1 |
| 28 | 0 | 0 | 1 |
| 29 | 0 | 0 | 1 |
| 30 | 0 | 0 | 1 |
| 31 | 0 | 0 | 1 |
| 32 | 0 | 0 | 1 |
| 33 | 0 | 0 | 1 |
| 34 | 0 | 0 | 1 |
| 35 | 0 | 0 | 1 |
| 36 | 0 | 0 | 1 |
| 37 | 0 | 0 | 1 |
| 38 | 0 | 0 | 1 |
| 39 | 0 | 0 | 1 |
| 40 | 0 | 0 | 1 |
| 41 | 0 | 0 | 1 |
| 42 | 0 | 0 | 1 |
| 43 | 0 | 0 | 1 |
| 44 | 0 | 0 | 1 |
| 45 | 0 | 0 | 1 |
| 46 | 2.16775240647460e-14 | 4.33550481294919e-14 | 0.999999999999978 |
| 47 | 2.1716179903156e-07 | 4.3432359806312e-07 | 0.999999782838201 |
| 48 | 0.00795327242063893 | 0.0159065448412779 | 0.992046727579361 |
| 49 | 0.257307345031696 | 0.514614690063391 | 0.742692654968304 |
| 50 | 0.244452910896672 | 0.488905821793344 | 0.755547089103328 |
| 51 | 0.335344146462831 | 0.670688292925662 | 0.664655853537169 |
| 52 | 0.295571000928419 | 0.591142001856838 | 0.704428999071581 |
| 53 | 0.259797516979347 | 0.519595033958694 | 0.740202483020653 |
| 54 | 0.246673236802684 | 0.493346473605369 | 0.753326763197316 |
| 55 | 0.330158003559144 | 0.660316007118288 | 0.669841996440856 |
| 56 | 0.309329550128396 | 0.618659100256791 | 0.690670449871604 |
| 57 | 0.394726138363535 | 0.78945227672707 | 0.605273861636465 |
| 58 | 0.361849254561772 | 0.723698509123544 | 0.638150745438228 |
| Meta Analysis of Goldfeld-Quandt test for Heteroskedasticity | |||
| Description | # significant tests | % significant tests | OK/NOK |
| 1% type I error level | 40 | 0.784313725490196 | NOK |
| 5% type I error level | 41 | 0.803921568627451 | NOK |
| 10% type I error level | 41 | 0.803921568627451 | NOK |