Free Statistics
of Irreproducible Research!
Description of Statistical Computation | |||||||||||||||||||||||||||||||||||||||||||||||||||||||||
|---|---|---|---|---|---|---|---|---|---|---|---|---|---|---|---|---|---|---|---|---|---|---|---|---|---|---|---|---|---|---|---|---|---|---|---|---|---|---|---|---|---|---|---|---|---|---|---|---|---|---|---|---|---|---|---|---|---|
| Author's title | |||||||||||||||||||||||||||||||||||||||||||||||||||||||||
| Author | *The author of this computation has been verified* | ||||||||||||||||||||||||||||||||||||||||||||||||||||||||
| R Software Module | rwasp_edauni.wasp | ||||||||||||||||||||||||||||||||||||||||||||||||||||||||
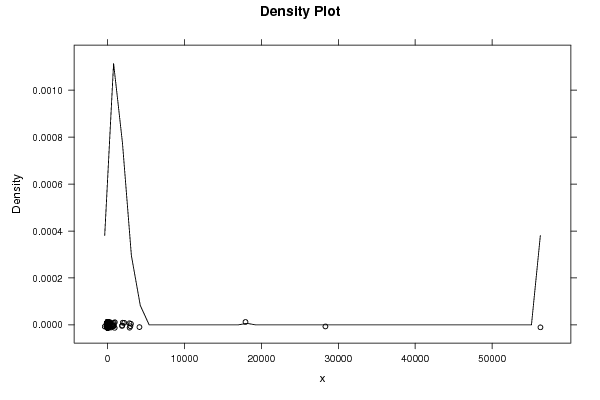
| Title produced by software | Univariate Explorative Data Analysis | ||||||||||||||||||||||||||||||||||||||||||||||||||||||||
| Date of computation | Wed, 01 Dec 2010 13:18:58 +0000 | ||||||||||||||||||||||||||||||||||||||||||||||||||||||||
| Cite this page as follows | Statistical Computations at FreeStatistics.org, Office for Research Development and Education, URL https://freestatistics.org/blog/index.php?v=date/2010/Dec/01/t1291209426i2g5g6hgtladycs.htm/, Retrieved Sat, 04 May 2024 22:36:52 +0000 | ||||||||||||||||||||||||||||||||||||||||||||||||||||||||
| Statistical Computations at FreeStatistics.org, Office for Research Development and Education, URL https://freestatistics.org/blog/index.php?pk=103964, Retrieved Sat, 04 May 2024 22:36:52 +0000 | |||||||||||||||||||||||||||||||||||||||||||||||||||||||||
| QR Codes: | |||||||||||||||||||||||||||||||||||||||||||||||||||||||||
|
| |||||||||||||||||||||||||||||||||||||||||||||||||||||||||
| Original text written by user: | |||||||||||||||||||||||||||||||||||||||||||||||||||||||||
| IsPrivate? | No (this computation is public) | ||||||||||||||||||||||||||||||||||||||||||||||||||||||||
| User-defined keywords | |||||||||||||||||||||||||||||||||||||||||||||||||||||||||
| Estimated Impact | 196 | ||||||||||||||||||||||||||||||||||||||||||||||||||||||||
Tree of Dependent Computations | |||||||||||||||||||||||||||||||||||||||||||||||||||||||||
| Family? (F = Feedback message, R = changed R code, M = changed R Module, P = changed Parameters, D = changed Data) | |||||||||||||||||||||||||||||||||||||||||||||||||||||||||
| - [Univariate Explorative Data Analysis] [time effect in su...] [2010-11-17 08:55:33] [b98453cac15ba1066b407e146608df68] - PD [Univariate Explorative Data Analysis] [sequence plot cc-...] [2010-12-01 13:18:58] [9b9a58c480cb5dafe4bfceb51e1cfd12] [Current] - [Univariate Explorative Data Analysis] [sequence plot CC-...] [2010-12-02 14:37:45] [75b8170d590d2aca2c97c1862bb2167f] - [Univariate Explorative Data Analysis] [sequence plot yt] [2010-12-02 15:01:10] [75b8170d590d2aca2c97c1862bb2167f] - [Univariate Explorative Data Analysis] [ run sequence plo...] [2010-12-03 19:02:55] [75b8170d590d2aca2c97c1862bb2167f] - D [Univariate Explorative Data Analysis] [] [2010-12-18 13:09:57] [75b8170d590d2aca2c97c1862bb2167f] - [Univariate Explorative Data Analysis] [run sequence plot...] [2010-12-28 08:03:13] [75b8170d590d2aca2c97c1862bb2167f] - [Univariate Explorative Data Analysis] [berekening 2] [2010-12-28 13:00:55] [916599f00c9c716123aa8433d9efa14f] - [Univariate Explorative Data Analysis] [berekening 2] [2010-12-28 13:09:16] [916599f00c9c716123aa8433d9efa14f] - [Univariate Explorative Data Analysis] [] [2010-12-29 16:10:38] [c895532cb7349383dee5125244983cc8] | |||||||||||||||||||||||||||||||||||||||||||||||||||||||||
| Feedback Forum | |||||||||||||||||||||||||||||||||||||||||||||||||||||||||
Post a new message | |||||||||||||||||||||||||||||||||||||||||||||||||||||||||
Dataset | |||||||||||||||||||||||||||||||||||||||||||||||||||||||||
| Dataseries X: | |||||||||||||||||||||||||||||||||||||||||||||||||||||||||
56289 28328 17936 4145 3040 2964 2865 2854 2167 1974 1910 1871 943 929 822 819 769 745 652 643 601 446 436 379 305 284 247 238 223 220 217 199 195 163 154 143 135 132 120 119 108 104 101 90 85 74 73 70 67 66 66 66 59 58 58 54 53 49 49 44 39 38 38 37 36 35 34 33 32 32 31 31 30 30 30 28 26 26 26 25 25 24 24 23 23 22 22 22 20 20 19 18 17 16 14 14 14 13 13 13 13 13 12 12 11 10 10 10 10 10 9 9 9 6 6 6 5 5 5 4 4 3 2 2 1 1 0 0 0 0 0 0 0 0 0 0 0 0 0 0 0 0 0 0 0 0 0 0 0 0 0 0 0 0 0 0 0 0 0 0 0 0 0 0 0 0 0 0 0 0 0 0 0 0 0 0 0 0 0 0 0 0 0 0 0 0 0 0 0 0 0 0 0 0 0 0 0 0 0 0 0 0 0 0 0 0 0 0 0 0 0 0 0 0 0 0 0 0 0 0 0 0 0 0 0 0 0 0 0 0 0 0 0 0 0 0 0 0 0 0 0 0 0 0 0 0 0 0 0 0 0 0 0 0 0 0 0 0 0 0 0 0 0 0 0 0 0 0 0 0 0 0 0 0 0 0 0 0 0 0 0 0 0 0 0 0 0 0 0 0 0 0 0 0 0 0 0 0 0 0 0 0 0 0 0 0 0 0 0 0 0 0 0 0 0 0 0 0 0 0 0 0 0 0 0 0 0 0 0 0 0 0 0 0 0 0 0 0 0 0 0 0 0 0 0 0 0 0 0 0 0 0 0 0 0 0 0 0 0 0 0 0 0 0 0 0 0 0 0 0 0 0 0 0 0 0 0 0 0 0 0 0 0 0 0 0 0 0 -1 -1 -1 -2 -2 -3 -3 -3 -3 -3 -3 -4 -4 -4 -4 -4 -5 -5 -5 -5 -5 -5 -5 -6 -6 -6 -8 -8 -9 -10 -12 -14 -15 -25 -28 -31 -31 -58 -70 -129 -158 -366 | |||||||||||||||||||||||||||||||||||||||||||||||||||||||||
Tables (Output of Computation) | |||||||||||||||||||||||||||||||||||||||||||||||||||||||||
| |||||||||||||||||||||||||||||||||||||||||||||||||||||||||
Figures (Output of Computation) | |||||||||||||||||||||||||||||||||||||||||||||||||||||||||
Input Parameters & R Code | |||||||||||||||||||||||||||||||||||||||||||||||||||||||||
| Parameters (Session): | |||||||||||||||||||||||||||||||||||||||||||||||||||||||||
| par1 = 0 ; par2 = 20 ; | |||||||||||||||||||||||||||||||||||||||||||||||||||||||||
| Parameters (R input): | |||||||||||||||||||||||||||||||||||||||||||||||||||||||||
| par1 = 0 ; par2 = 20 ; | |||||||||||||||||||||||||||||||||||||||||||||||||||||||||
| R code (references can be found in the software module): | |||||||||||||||||||||||||||||||||||||||||||||||||||||||||
par1 <- as.numeric(par1) | |||||||||||||||||||||||||||||||||||||||||||||||||||||||||