Free Statistics

of Irreproducible Research!

Author's title

Author*Unverified author*
R Software Modulerwasp_autocorrelation.wasp
Title produced by software(Partial) Autocorrelation Function
Date of computationFri, 20 Aug 2010 08:20:56 +0000
Cite this page as followsStatistical Computations at FreeStatistics.org, Office for Research Development and Education, URL https://freestatistics.org/blog/index.php?v=date/2010/Aug/20/t1282292582x1n7xua4h607irv.htm/, Retrieved Wed, 08 May 2024 08:48:08 +0000
Statistical Computations at FreeStatistics.org, Office for Research Development and Education, URL https://freestatistics.org/blog/index.php?pk=79448, Retrieved Wed, 08 May 2024 08:48:08 +0000
QR Codes:

Original text written by user:
IsPrivate?No (this computation is public)
User-defined keywordsWillem Van Tendeloo MAR 201 A
Estimated Impact154
Family? (F = Feedback message, R = changed R code, M = changed R Module, P = changed Parameters, D = changed Data)
-       [(Partial) Autocorrelation Function] [Tijdreeks B Stap 18] [2010-08-20 08:20:56] [6b796205aa6c71fffca3ea7e892beea1] [Current]
Feedback Forum

Post a new message
Dataseries X:
76
75
74
72
70
69
70
72
73
73
74
76
74
67
66
58
55
58
64
68
66
76
75
88
85
83
77
66
65
65
63
62
57
68
69
79
74
76
82
75
75
76
78
77
67
74
68
87
76
88
95
96
96
105
108
113
101
107
102
116
105
121
134
140
131
141
131
128
123
129
125
144
135
141
156
159
146
154
145
133
126
127
122
148


Summary of computational transaction
Raw Inputview raw input (R code)
Raw Outputview raw output of R engine
Computing time3 seconds
R Server'George Udny Yule' @ 72.249.76.132

\begin{tabular}{lllllllll}
\hline
Summary of computational transaction \tabularnewline
Raw Input & view raw input (R code)  \tabularnewline
Raw Output & view raw output of R engine  \tabularnewline
Computing time & 3 seconds \tabularnewline
R Server & 'George Udny Yule' @ 72.249.76.132 \tabularnewline
\hline
\end{tabular}
%Source: https://freestatistics.org/blog/index.php?pk=79448&T=0

[TABLE]
[ROW][C]Summary of computational transaction[/C][/ROW]
[ROW][C]Raw Input[/C][C]view raw input (R code) [/C][/ROW]
[ROW][C]Raw Output[/C][C]view raw output of R engine [/C][/ROW]
[ROW][C]Computing time[/C][C]3 seconds[/C][/ROW]
[ROW][C]R Server[/C][C]'George Udny Yule' @ 72.249.76.132[/C][/ROW]
[/TABLE]
Source: https://freestatistics.org/blog/index.php?pk=79448&T=0

Globally Unique Identifier (entire table): ba.freestatistics.org/blog/index.php?pk=79448&T=0

As an alternative you can also use a QR Code:  

The GUIDs for individual cells are displayed in the table below:

Summary of computational transaction
Raw Inputview raw input (R code)
Raw Outputview raw output of R engine
Computing time3 seconds
R Server'George Udny Yule' @ 72.249.76.132


Autocorrelation Function
Time lag kACF(k)T-STATP-value
10.9301587.89270
20.851037.22120
30.7434476.30840
40.6430235.45620
50.5425594.60389e-06
60.4693683.98278.1e-05
70.4013253.40540.000542
80.347612.94960.002145
90.3140912.66510.004747
100.2879212.44310.008508
110.2681562.27540.012931
120.2661632.25850.013474
130.2669132.26480.013267
140.2580452.18960.015898
150.2328681.97590.025996
160.185141.5710.060287
170.1266211.07440.143112
180.0758960.6440.260811
190.0282810.240.405516
20-0.020968-0.17790.429644
21-0.07108-0.60310.274156
22-0.131525-1.1160.13406
23-0.190062-1.61270.055589
24-0.23764-2.01640.023742
25-0.278831-2.3660.010339
26-0.297774-2.52670.006856
27-0.293237-2.48820.007577
28-0.266542-2.26170.013369
29-0.236345-2.00550.024337
30-0.204325-1.73380.043621
31-0.184977-1.56960.060449
32-0.17449-1.48060.071539
33-0.174669-1.48210.071336
34-0.192294-1.63170.053558
35-0.223401-1.89560.031012
36-0.253843-2.15390.017297
37-0.287159-2.43660.008649
38-0.320077-2.71590.004135
39-0.338575-2.87290.00267
40-0.339629-2.88190.002604
41-0.340758-2.89140.002534
42-0.321285-2.72620.00402
43-0.295947-2.51120.007139
44-0.257194-2.18240.016173
45-0.227564-1.93090.028714
46-0.20423-1.73290.043693
47-0.1887-1.60120.056859
48-0.183989-1.56120.061431

\begin{tabular}{lllllllll}
\hline
Autocorrelation Function \tabularnewline
Time lag k & ACF(k) & T-STAT & P-value \tabularnewline
1 & 0.930158 & 7.8927 & 0 \tabularnewline
2 & 0.85103 & 7.2212 & 0 \tabularnewline
3 & 0.743447 & 6.3084 & 0 \tabularnewline
4 & 0.643023 & 5.4562 & 0 \tabularnewline
5 & 0.542559 & 4.6038 & 9e-06 \tabularnewline
6 & 0.469368 & 3.9827 & 8.1e-05 \tabularnewline
7 & 0.401325 & 3.4054 & 0.000542 \tabularnewline
8 & 0.34761 & 2.9496 & 0.002145 \tabularnewline
9 & 0.314091 & 2.6651 & 0.004747 \tabularnewline
10 & 0.287921 & 2.4431 & 0.008508 \tabularnewline
11 & 0.268156 & 2.2754 & 0.012931 \tabularnewline
12 & 0.266163 & 2.2585 & 0.013474 \tabularnewline
13 & 0.266913 & 2.2648 & 0.013267 \tabularnewline
14 & 0.258045 & 2.1896 & 0.015898 \tabularnewline
15 & 0.232868 & 1.9759 & 0.025996 \tabularnewline
16 & 0.18514 & 1.571 & 0.060287 \tabularnewline
17 & 0.126621 & 1.0744 & 0.143112 \tabularnewline
18 & 0.075896 & 0.644 & 0.260811 \tabularnewline
19 & 0.028281 & 0.24 & 0.405516 \tabularnewline
20 & -0.020968 & -0.1779 & 0.429644 \tabularnewline
21 & -0.07108 & -0.6031 & 0.274156 \tabularnewline
22 & -0.131525 & -1.116 & 0.13406 \tabularnewline
23 & -0.190062 & -1.6127 & 0.055589 \tabularnewline
24 & -0.23764 & -2.0164 & 0.023742 \tabularnewline
25 & -0.278831 & -2.366 & 0.010339 \tabularnewline
26 & -0.297774 & -2.5267 & 0.006856 \tabularnewline
27 & -0.293237 & -2.4882 & 0.007577 \tabularnewline
28 & -0.266542 & -2.2617 & 0.013369 \tabularnewline
29 & -0.236345 & -2.0055 & 0.024337 \tabularnewline
30 & -0.204325 & -1.7338 & 0.043621 \tabularnewline
31 & -0.184977 & -1.5696 & 0.060449 \tabularnewline
32 & -0.17449 & -1.4806 & 0.071539 \tabularnewline
33 & -0.174669 & -1.4821 & 0.071336 \tabularnewline
34 & -0.192294 & -1.6317 & 0.053558 \tabularnewline
35 & -0.223401 & -1.8956 & 0.031012 \tabularnewline
36 & -0.253843 & -2.1539 & 0.017297 \tabularnewline
37 & -0.287159 & -2.4366 & 0.008649 \tabularnewline
38 & -0.320077 & -2.7159 & 0.004135 \tabularnewline
39 & -0.338575 & -2.8729 & 0.00267 \tabularnewline
40 & -0.339629 & -2.8819 & 0.002604 \tabularnewline
41 & -0.340758 & -2.8914 & 0.002534 \tabularnewline
42 & -0.321285 & -2.7262 & 0.00402 \tabularnewline
43 & -0.295947 & -2.5112 & 0.007139 \tabularnewline
44 & -0.257194 & -2.1824 & 0.016173 \tabularnewline
45 & -0.227564 & -1.9309 & 0.028714 \tabularnewline
46 & -0.20423 & -1.7329 & 0.043693 \tabularnewline
47 & -0.1887 & -1.6012 & 0.056859 \tabularnewline
48 & -0.183989 & -1.5612 & 0.061431 \tabularnewline
\hline
\end{tabular}
%Source: https://freestatistics.org/blog/index.php?pk=79448&T=1

[TABLE]
[ROW][C]Autocorrelation Function[/C][/ROW]
[ROW][C]Time lag k[/C][C]ACF(k)[/C][C]T-STAT[/C][C]P-value[/C][/ROW]
[ROW][C]1[/C][C]0.930158[/C][C]7.8927[/C][C]0[/C][/ROW]
[ROW][C]2[/C][C]0.85103[/C][C]7.2212[/C][C]0[/C][/ROW]
[ROW][C]3[/C][C]0.743447[/C][C]6.3084[/C][C]0[/C][/ROW]
[ROW][C]4[/C][C]0.643023[/C][C]5.4562[/C][C]0[/C][/ROW]
[ROW][C]5[/C][C]0.542559[/C][C]4.6038[/C][C]9e-06[/C][/ROW]
[ROW][C]6[/C][C]0.469368[/C][C]3.9827[/C][C]8.1e-05[/C][/ROW]
[ROW][C]7[/C][C]0.401325[/C][C]3.4054[/C][C]0.000542[/C][/ROW]
[ROW][C]8[/C][C]0.34761[/C][C]2.9496[/C][C]0.002145[/C][/ROW]
[ROW][C]9[/C][C]0.314091[/C][C]2.6651[/C][C]0.004747[/C][/ROW]
[ROW][C]10[/C][C]0.287921[/C][C]2.4431[/C][C]0.008508[/C][/ROW]
[ROW][C]11[/C][C]0.268156[/C][C]2.2754[/C][C]0.012931[/C][/ROW]
[ROW][C]12[/C][C]0.266163[/C][C]2.2585[/C][C]0.013474[/C][/ROW]
[ROW][C]13[/C][C]0.266913[/C][C]2.2648[/C][C]0.013267[/C][/ROW]
[ROW][C]14[/C][C]0.258045[/C][C]2.1896[/C][C]0.015898[/C][/ROW]
[ROW][C]15[/C][C]0.232868[/C][C]1.9759[/C][C]0.025996[/C][/ROW]
[ROW][C]16[/C][C]0.18514[/C][C]1.571[/C][C]0.060287[/C][/ROW]
[ROW][C]17[/C][C]0.126621[/C][C]1.0744[/C][C]0.143112[/C][/ROW]
[ROW][C]18[/C][C]0.075896[/C][C]0.644[/C][C]0.260811[/C][/ROW]
[ROW][C]19[/C][C]0.028281[/C][C]0.24[/C][C]0.405516[/C][/ROW]
[ROW][C]20[/C][C]-0.020968[/C][C]-0.1779[/C][C]0.429644[/C][/ROW]
[ROW][C]21[/C][C]-0.07108[/C][C]-0.6031[/C][C]0.274156[/C][/ROW]
[ROW][C]22[/C][C]-0.131525[/C][C]-1.116[/C][C]0.13406[/C][/ROW]
[ROW][C]23[/C][C]-0.190062[/C][C]-1.6127[/C][C]0.055589[/C][/ROW]
[ROW][C]24[/C][C]-0.23764[/C][C]-2.0164[/C][C]0.023742[/C][/ROW]
[ROW][C]25[/C][C]-0.278831[/C][C]-2.366[/C][C]0.010339[/C][/ROW]
[ROW][C]26[/C][C]-0.297774[/C][C]-2.5267[/C][C]0.006856[/C][/ROW]
[ROW][C]27[/C][C]-0.293237[/C][C]-2.4882[/C][C]0.007577[/C][/ROW]
[ROW][C]28[/C][C]-0.266542[/C][C]-2.2617[/C][C]0.013369[/C][/ROW]
[ROW][C]29[/C][C]-0.236345[/C][C]-2.0055[/C][C]0.024337[/C][/ROW]
[ROW][C]30[/C][C]-0.204325[/C][C]-1.7338[/C][C]0.043621[/C][/ROW]
[ROW][C]31[/C][C]-0.184977[/C][C]-1.5696[/C][C]0.060449[/C][/ROW]
[ROW][C]32[/C][C]-0.17449[/C][C]-1.4806[/C][C]0.071539[/C][/ROW]
[ROW][C]33[/C][C]-0.174669[/C][C]-1.4821[/C][C]0.071336[/C][/ROW]
[ROW][C]34[/C][C]-0.192294[/C][C]-1.6317[/C][C]0.053558[/C][/ROW]
[ROW][C]35[/C][C]-0.223401[/C][C]-1.8956[/C][C]0.031012[/C][/ROW]
[ROW][C]36[/C][C]-0.253843[/C][C]-2.1539[/C][C]0.017297[/C][/ROW]
[ROW][C]37[/C][C]-0.287159[/C][C]-2.4366[/C][C]0.008649[/C][/ROW]
[ROW][C]38[/C][C]-0.320077[/C][C]-2.7159[/C][C]0.004135[/C][/ROW]
[ROW][C]39[/C][C]-0.338575[/C][C]-2.8729[/C][C]0.00267[/C][/ROW]
[ROW][C]40[/C][C]-0.339629[/C][C]-2.8819[/C][C]0.002604[/C][/ROW]
[ROW][C]41[/C][C]-0.340758[/C][C]-2.8914[/C][C]0.002534[/C][/ROW]
[ROW][C]42[/C][C]-0.321285[/C][C]-2.7262[/C][C]0.00402[/C][/ROW]
[ROW][C]43[/C][C]-0.295947[/C][C]-2.5112[/C][C]0.007139[/C][/ROW]
[ROW][C]44[/C][C]-0.257194[/C][C]-2.1824[/C][C]0.016173[/C][/ROW]
[ROW][C]45[/C][C]-0.227564[/C][C]-1.9309[/C][C]0.028714[/C][/ROW]
[ROW][C]46[/C][C]-0.20423[/C][C]-1.7329[/C][C]0.043693[/C][/ROW]
[ROW][C]47[/C][C]-0.1887[/C][C]-1.6012[/C][C]0.056859[/C][/ROW]
[ROW][C]48[/C][C]-0.183989[/C][C]-1.5612[/C][C]0.061431[/C][/ROW]
[/TABLE]
Source: https://freestatistics.org/blog/index.php?pk=79448&T=1

Globally Unique Identifier (entire table): ba.freestatistics.org/blog/index.php?pk=79448&T=1

As an alternative you can also use a QR Code:  

The GUIDs for individual cells are displayed in the table below:

Autocorrelation Function
Time lag kACF(k)T-STATP-value
10.9301587.89270
20.851037.22120
30.7434476.30840
40.6430235.45620
50.5425594.60389e-06
60.4693683.98278.1e-05
70.4013253.40540.000542
80.347612.94960.002145
90.3140912.66510.004747
100.2879212.44310.008508
110.2681562.27540.012931
120.2661632.25850.013474
130.2669132.26480.013267
140.2580452.18960.015898
150.2328681.97590.025996
160.185141.5710.060287
170.1266211.07440.143112
180.0758960.6440.260811
190.0282810.240.405516
20-0.020968-0.17790.429644
21-0.07108-0.60310.274156
22-0.131525-1.1160.13406
23-0.190062-1.61270.055589
24-0.23764-2.01640.023742
25-0.278831-2.3660.010339
26-0.297774-2.52670.006856
27-0.293237-2.48820.007577
28-0.266542-2.26170.013369
29-0.236345-2.00550.024337
30-0.204325-1.73380.043621
31-0.184977-1.56960.060449
32-0.17449-1.48060.071539
33-0.174669-1.48210.071336
34-0.192294-1.63170.053558
35-0.223401-1.89560.031012
36-0.253843-2.15390.017297
37-0.287159-2.43660.008649
38-0.320077-2.71590.004135
39-0.338575-2.87290.00267
40-0.339629-2.88190.002604
41-0.340758-2.89140.002534
42-0.321285-2.72620.00402
43-0.295947-2.51120.007139
44-0.257194-2.18240.016173
45-0.227564-1.93090.028714
46-0.20423-1.73290.043693
47-0.1887-1.60120.056859
48-0.183989-1.56120.061431


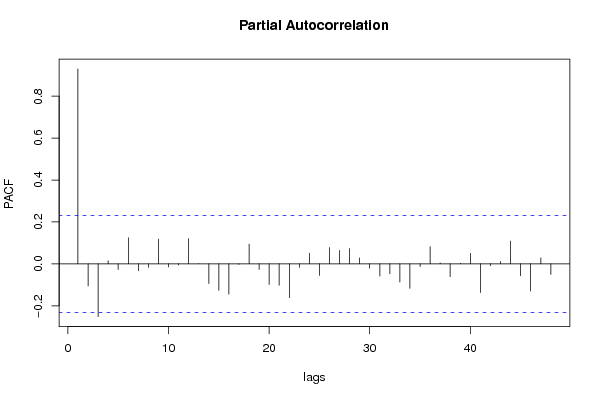
Partial Autocorrelation Function
Time lag kPACF(k)T-STATP-value
10.9301587.89270
2-0.105069-0.89150.187804
3-0.251928-2.13770.017969
40.0151650.12870.448986
5-0.026328-0.22340.411927
60.124251.05430.147635
7-0.033271-0.28230.389255
8-0.016533-0.14030.444411
90.1180541.00170.159917
10-0.014991-0.12720.449566
11-0.004942-0.04190.483332
120.1199381.01770.156113
130.0009070.00770.496941
14-0.093809-0.7960.214325
15-0.126188-1.07070.143932
16-0.144892-1.22940.111454
17-0.00256-0.02170.491365
180.0942150.79940.213331
19-0.026408-0.22410.411666
20-0.098074-0.83220.204029
21-0.102115-0.86650.194553
22-0.161624-1.37140.087251
23-0.017131-0.14540.442415
240.0508120.43120.333822
25-0.05516-0.4680.320583
260.0780390.66220.254983
270.0639520.54270.294522
280.0731160.62040.268475
290.0285520.24230.40463
30-0.020376-0.17290.43161
31-0.058178-0.49370.311524
32-0.04711-0.39970.345265
33-0.08667-0.73540.232236
34-0.116553-0.9890.162991
35-0.012877-0.10930.456649
360.0819860.69570.244436
370.004350.03690.485329
38-0.06144-0.52130.301867
390.002690.02280.490927
400.0505930.42930.334496
41-0.137214-1.16430.124073
42-0.008578-0.07280.47109
430.0115260.09780.461181
440.1089950.92490.179066
45-0.05728-0.4860.314209
46-0.129993-1.1030.136844
470.0280410.23790.406304
48-0.050242-0.42630.335575

\begin{tabular}{lllllllll}
\hline
Partial Autocorrelation Function \tabularnewline
Time lag k & PACF(k) & T-STAT & P-value \tabularnewline
1 & 0.930158 & 7.8927 & 0 \tabularnewline
2 & -0.105069 & -0.8915 & 0.187804 \tabularnewline
3 & -0.251928 & -2.1377 & 0.017969 \tabularnewline
4 & 0.015165 & 0.1287 & 0.448986 \tabularnewline
5 & -0.026328 & -0.2234 & 0.411927 \tabularnewline
6 & 0.12425 & 1.0543 & 0.147635 \tabularnewline
7 & -0.033271 & -0.2823 & 0.389255 \tabularnewline
8 & -0.016533 & -0.1403 & 0.444411 \tabularnewline
9 & 0.118054 & 1.0017 & 0.159917 \tabularnewline
10 & -0.014991 & -0.1272 & 0.449566 \tabularnewline
11 & -0.004942 & -0.0419 & 0.483332 \tabularnewline
12 & 0.119938 & 1.0177 & 0.156113 \tabularnewline
13 & 0.000907 & 0.0077 & 0.496941 \tabularnewline
14 & -0.093809 & -0.796 & 0.214325 \tabularnewline
15 & -0.126188 & -1.0707 & 0.143932 \tabularnewline
16 & -0.144892 & -1.2294 & 0.111454 \tabularnewline
17 & -0.00256 & -0.0217 & 0.491365 \tabularnewline
18 & 0.094215 & 0.7994 & 0.213331 \tabularnewline
19 & -0.026408 & -0.2241 & 0.411666 \tabularnewline
20 & -0.098074 & -0.8322 & 0.204029 \tabularnewline
21 & -0.102115 & -0.8665 & 0.194553 \tabularnewline
22 & -0.161624 & -1.3714 & 0.087251 \tabularnewline
23 & -0.017131 & -0.1454 & 0.442415 \tabularnewline
24 & 0.050812 & 0.4312 & 0.333822 \tabularnewline
25 & -0.05516 & -0.468 & 0.320583 \tabularnewline
26 & 0.078039 & 0.6622 & 0.254983 \tabularnewline
27 & 0.063952 & 0.5427 & 0.294522 \tabularnewline
28 & 0.073116 & 0.6204 & 0.268475 \tabularnewline
29 & 0.028552 & 0.2423 & 0.40463 \tabularnewline
30 & -0.020376 & -0.1729 & 0.43161 \tabularnewline
31 & -0.058178 & -0.4937 & 0.311524 \tabularnewline
32 & -0.04711 & -0.3997 & 0.345265 \tabularnewline
33 & -0.08667 & -0.7354 & 0.232236 \tabularnewline
34 & -0.116553 & -0.989 & 0.162991 \tabularnewline
35 & -0.012877 & -0.1093 & 0.456649 \tabularnewline
36 & 0.081986 & 0.6957 & 0.244436 \tabularnewline
37 & 0.00435 & 0.0369 & 0.485329 \tabularnewline
38 & -0.06144 & -0.5213 & 0.301867 \tabularnewline
39 & 0.00269 & 0.0228 & 0.490927 \tabularnewline
40 & 0.050593 & 0.4293 & 0.334496 \tabularnewline
41 & -0.137214 & -1.1643 & 0.124073 \tabularnewline
42 & -0.008578 & -0.0728 & 0.47109 \tabularnewline
43 & 0.011526 & 0.0978 & 0.461181 \tabularnewline
44 & 0.108995 & 0.9249 & 0.179066 \tabularnewline
45 & -0.05728 & -0.486 & 0.314209 \tabularnewline
46 & -0.129993 & -1.103 & 0.136844 \tabularnewline
47 & 0.028041 & 0.2379 & 0.406304 \tabularnewline
48 & -0.050242 & -0.4263 & 0.335575 \tabularnewline
\hline
\end{tabular}
%Source: https://freestatistics.org/blog/index.php?pk=79448&T=2

[TABLE]
[ROW][C]Partial Autocorrelation Function[/C][/ROW]
[ROW][C]Time lag k[/C][C]PACF(k)[/C][C]T-STAT[/C][C]P-value[/C][/ROW]
[ROW][C]1[/C][C]0.930158[/C][C]7.8927[/C][C]0[/C][/ROW]
[ROW][C]2[/C][C]-0.105069[/C][C]-0.8915[/C][C]0.187804[/C][/ROW]
[ROW][C]3[/C][C]-0.251928[/C][C]-2.1377[/C][C]0.017969[/C][/ROW]
[ROW][C]4[/C][C]0.015165[/C][C]0.1287[/C][C]0.448986[/C][/ROW]
[ROW][C]5[/C][C]-0.026328[/C][C]-0.2234[/C][C]0.411927[/C][/ROW]
[ROW][C]6[/C][C]0.12425[/C][C]1.0543[/C][C]0.147635[/C][/ROW]
[ROW][C]7[/C][C]-0.033271[/C][C]-0.2823[/C][C]0.389255[/C][/ROW]
[ROW][C]8[/C][C]-0.016533[/C][C]-0.1403[/C][C]0.444411[/C][/ROW]
[ROW][C]9[/C][C]0.118054[/C][C]1.0017[/C][C]0.159917[/C][/ROW]
[ROW][C]10[/C][C]-0.014991[/C][C]-0.1272[/C][C]0.449566[/C][/ROW]
[ROW][C]11[/C][C]-0.004942[/C][C]-0.0419[/C][C]0.483332[/C][/ROW]
[ROW][C]12[/C][C]0.119938[/C][C]1.0177[/C][C]0.156113[/C][/ROW]
[ROW][C]13[/C][C]0.000907[/C][C]0.0077[/C][C]0.496941[/C][/ROW]
[ROW][C]14[/C][C]-0.093809[/C][C]-0.796[/C][C]0.214325[/C][/ROW]
[ROW][C]15[/C][C]-0.126188[/C][C]-1.0707[/C][C]0.143932[/C][/ROW]
[ROW][C]16[/C][C]-0.144892[/C][C]-1.2294[/C][C]0.111454[/C][/ROW]
[ROW][C]17[/C][C]-0.00256[/C][C]-0.0217[/C][C]0.491365[/C][/ROW]
[ROW][C]18[/C][C]0.094215[/C][C]0.7994[/C][C]0.213331[/C][/ROW]
[ROW][C]19[/C][C]-0.026408[/C][C]-0.2241[/C][C]0.411666[/C][/ROW]
[ROW][C]20[/C][C]-0.098074[/C][C]-0.8322[/C][C]0.204029[/C][/ROW]
[ROW][C]21[/C][C]-0.102115[/C][C]-0.8665[/C][C]0.194553[/C][/ROW]
[ROW][C]22[/C][C]-0.161624[/C][C]-1.3714[/C][C]0.087251[/C][/ROW]
[ROW][C]23[/C][C]-0.017131[/C][C]-0.1454[/C][C]0.442415[/C][/ROW]
[ROW][C]24[/C][C]0.050812[/C][C]0.4312[/C][C]0.333822[/C][/ROW]
[ROW][C]25[/C][C]-0.05516[/C][C]-0.468[/C][C]0.320583[/C][/ROW]
[ROW][C]26[/C][C]0.078039[/C][C]0.6622[/C][C]0.254983[/C][/ROW]
[ROW][C]27[/C][C]0.063952[/C][C]0.5427[/C][C]0.294522[/C][/ROW]
[ROW][C]28[/C][C]0.073116[/C][C]0.6204[/C][C]0.268475[/C][/ROW]
[ROW][C]29[/C][C]0.028552[/C][C]0.2423[/C][C]0.40463[/C][/ROW]
[ROW][C]30[/C][C]-0.020376[/C][C]-0.1729[/C][C]0.43161[/C][/ROW]
[ROW][C]31[/C][C]-0.058178[/C][C]-0.4937[/C][C]0.311524[/C][/ROW]
[ROW][C]32[/C][C]-0.04711[/C][C]-0.3997[/C][C]0.345265[/C][/ROW]
[ROW][C]33[/C][C]-0.08667[/C][C]-0.7354[/C][C]0.232236[/C][/ROW]
[ROW][C]34[/C][C]-0.116553[/C][C]-0.989[/C][C]0.162991[/C][/ROW]
[ROW][C]35[/C][C]-0.012877[/C][C]-0.1093[/C][C]0.456649[/C][/ROW]
[ROW][C]36[/C][C]0.081986[/C][C]0.6957[/C][C]0.244436[/C][/ROW]
[ROW][C]37[/C][C]0.00435[/C][C]0.0369[/C][C]0.485329[/C][/ROW]
[ROW][C]38[/C][C]-0.06144[/C][C]-0.5213[/C][C]0.301867[/C][/ROW]
[ROW][C]39[/C][C]0.00269[/C][C]0.0228[/C][C]0.490927[/C][/ROW]
[ROW][C]40[/C][C]0.050593[/C][C]0.4293[/C][C]0.334496[/C][/ROW]
[ROW][C]41[/C][C]-0.137214[/C][C]-1.1643[/C][C]0.124073[/C][/ROW]
[ROW][C]42[/C][C]-0.008578[/C][C]-0.0728[/C][C]0.47109[/C][/ROW]
[ROW][C]43[/C][C]0.011526[/C][C]0.0978[/C][C]0.461181[/C][/ROW]
[ROW][C]44[/C][C]0.108995[/C][C]0.9249[/C][C]0.179066[/C][/ROW]
[ROW][C]45[/C][C]-0.05728[/C][C]-0.486[/C][C]0.314209[/C][/ROW]
[ROW][C]46[/C][C]-0.129993[/C][C]-1.103[/C][C]0.136844[/C][/ROW]
[ROW][C]47[/C][C]0.028041[/C][C]0.2379[/C][C]0.406304[/C][/ROW]
[ROW][C]48[/C][C]-0.050242[/C][C]-0.4263[/C][C]0.335575[/C][/ROW]
[/TABLE]
Source: https://freestatistics.org/blog/index.php?pk=79448&T=2

Globally Unique Identifier (entire table): ba.freestatistics.org/blog/index.php?pk=79448&T=2

As an alternative you can also use a QR Code:  

The GUIDs for individual cells are displayed in the table below:

Partial Autocorrelation Function
Time lag kPACF(k)T-STATP-value
10.9301587.89270
2-0.105069-0.89150.187804
3-0.251928-2.13770.017969
40.0151650.12870.448986
5-0.026328-0.22340.411927
60.124251.05430.147635
7-0.033271-0.28230.389255
8-0.016533-0.14030.444411
90.1180541.00170.159917
10-0.014991-0.12720.449566
11-0.004942-0.04190.483332
120.1199381.01770.156113
130.0009070.00770.496941
14-0.093809-0.7960.214325
15-0.126188-1.07070.143932
16-0.144892-1.22940.111454
17-0.00256-0.02170.491365
180.0942150.79940.213331
19-0.026408-0.22410.411666
20-0.098074-0.83220.204029
21-0.102115-0.86650.194553
22-0.161624-1.37140.087251
23-0.017131-0.14540.442415
240.0508120.43120.333822
25-0.05516-0.4680.320583
260.0780390.66220.254983
270.0639520.54270.294522
280.0731160.62040.268475
290.0285520.24230.40463
30-0.020376-0.17290.43161
31-0.058178-0.49370.311524
32-0.04711-0.39970.345265
33-0.08667-0.73540.232236
34-0.116553-0.9890.162991
35-0.012877-0.10930.456649
360.0819860.69570.244436
370.004350.03690.485329
38-0.06144-0.52130.301867
390.002690.02280.490927
400.0505930.42930.334496
41-0.137214-1.16430.124073
42-0.008578-0.07280.47109
430.0115260.09780.461181
440.1089950.92490.179066
45-0.05728-0.4860.314209
46-0.129993-1.1030.136844
470.0280410.23790.406304
48-0.050242-0.42630.335575


Parameters (Session):
par1 = 12 ;
Parameters (R input):
par1 = 48 ; par2 = 1 ; par3 = 0 ; par4 = 1 ; par5 = 12 ; par6 = White Noise ; par7 = 0.95 ;
R code (references can be found in the software module):
if (par1 == 'Default') {
par1 = 10*log10(length(x))
} else {
par1 <- as.numeric(par1)
}
par2 <- as.numeric(par2)
par3 <- as.numeric(par3)
par4 <- as.numeric(par4)
par5 <- as.numeric(par5)
if (par6 == 'White Noise') par6 <- 'white' else par6 <- 'ma'
par7 <- as.numeric(par7)
if (par2 == 0) {
x <- log(x)
} else {
x <- (x ^ par2 - 1) / par2
}
if (par3 > 0) x <- diff(x,lag=1,difference=par3)
if (par4 > 0) x <- diff(x,lag=par5,difference=par4)
bitmap(file='pic1.png')
racf <- acf(x, par1, main='Autocorrelation', xlab='time lag', ylab='ACF', ci.type=par6, ci=par7, sub=paste('(lambda=',par2,', d=',par3,', D=',par4,', CI=', par7, ', CI type=',par6,')',sep=''))
dev.off()
bitmap(file='pic2.png')
rpacf <- pacf(x,par1,main='Partial Autocorrelation',xlab='lags',ylab='PACF')
dev.off()
(myacf <- c(racf$acf))
(mypacf <- c(rpacf$acf))
lengthx <- length(x)
sqrtn <- sqrt(lengthx)
load(file='createtable')
a<-table.start()
a<-table.row.start(a)
a<-table.element(a,'Autocorrelation Function',4,TRUE)
a<-table.row.end(a)
a<-table.row.start(a)
a<-table.element(a,'Time lag k',header=TRUE)
a<-table.element(a,hyperlink('basics.htm','ACF(k)','click here for more information about the Autocorrelation Function'),header=TRUE)
a<-table.element(a,'T-STAT',header=TRUE)
a<-table.element(a,'P-value',header=TRUE)
a<-table.row.end(a)
for (i in 2:(par1+1)) {
a<-table.row.start(a)
a<-table.element(a,i-1,header=TRUE)
a<-table.element(a,round(myacf[i],6))
mytstat <- myacf[i]*sqrtn
a<-table.element(a,round(mytstat,4))
a<-table.element(a,round(1-pt(abs(mytstat),lengthx),6))
a<-table.row.end(a)
}
a<-table.end(a)
table.save(a,file='mytable.tab')
a<-table.start()
a<-table.row.start(a)
a<-table.element(a,'Partial Autocorrelation Function',4,TRUE)
a<-table.row.end(a)
a<-table.row.start(a)
a<-table.element(a,'Time lag k',header=TRUE)
a<-table.element(a,hyperlink('basics.htm','PACF(k)','click here for more information about the Partial Autocorrelation Function'),header=TRUE)
a<-table.element(a,'T-STAT',header=TRUE)
a<-table.element(a,'P-value',header=TRUE)
a<-table.row.end(a)
for (i in 1:par1) {
a<-table.row.start(a)
a<-table.element(a,i,header=TRUE)
a<-table.element(a,round(mypacf[i],6))
mytstat <- mypacf[i]*sqrtn
a<-table.element(a,round(mytstat,4))
a<-table.element(a,round(1-pt(abs(mytstat),lengthx),6))
a<-table.row.end(a)
}
a<-table.end(a)
table.save(a,file='mytable1.tab')