Free Statistics

of Irreproducible Research!

Author's title

Author*Unverified author*
R Software Modulerwasp_autocorrelation.wasp
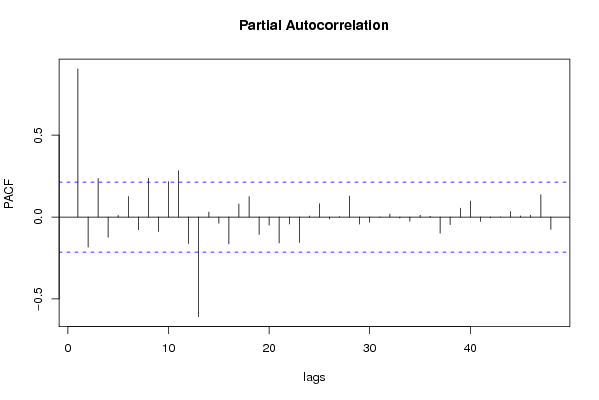
Title produced by software(Partial) Autocorrelation Function
Date of computationThu, 19 Aug 2010 20:28:58 +0000
Cite this page as followsStatistical Computations at FreeStatistics.org, Office for Research Development and Education, URL https://freestatistics.org/blog/index.php?v=date/2010/Aug/19/t1282249702pdo28hxwstvz89k.htm/, Retrieved Fri, 03 May 2024 05:40:24 +0000
Statistical Computations at FreeStatistics.org, Office for Research Development and Education, URL https://freestatistics.org/blog/index.php?pk=79374, Retrieved Fri, 03 May 2024 05:40:24 +0000
QR Codes:

Original text written by user:
IsPrivate?No (this computation is public)
User-defined keywordsgilian keirsebelik
Estimated Impact123
Family? (F = Feedback message, R = changed R code, M = changed R Module, P = changed Parameters, D = changed Data)
-       [(Partial) Autocorrelation Function] [tijdreeks B-Stap17] [2010-08-19 20:28:58] [46199ea7e385a69efb178ac615a86e3a] [Current]
Feedback Forum

Post a new message
Dataseries X:
51
50
49
47
45
44
45
47
48
48
49
51
45
42
40
37
28
33
32
38
38
34
38
48
41
41
43
37
22
30
32
41
44
37
53
67
62
63
68
62
50
64
71
76
73
68
78
89
74
74
73
65
55
69
80
81
80
86
90
100
90
89
83
63
48
62
69
73
76
77
75
77
78
73
74
55
36
41
52
53
49
47
44
55


Summary of computational transaction
Raw Inputview raw input (R code)
Raw Outputview raw output of R engine
Computing time1 seconds
R Server'George Udny Yule' @ 72.249.76.132

\begin{tabular}{lllllllll}
\hline
Summary of computational transaction \tabularnewline
Raw Input & view raw input (R code)  \tabularnewline
Raw Output & view raw output of R engine  \tabularnewline
Computing time & 1 seconds \tabularnewline
R Server & 'George Udny Yule' @ 72.249.76.132 \tabularnewline
\hline
\end{tabular}
%Source: https://freestatistics.org/blog/index.php?pk=79374&T=0

[TABLE]
[ROW][C]Summary of computational transaction[/C][/ROW]
[ROW][C]Raw Input[/C][C]view raw input (R code) [/C][/ROW]
[ROW][C]Raw Output[/C][C]view raw output of R engine [/C][/ROW]
[ROW][C]Computing time[/C][C]1 seconds[/C][/ROW]
[ROW][C]R Server[/C][C]'George Udny Yule' @ 72.249.76.132[/C][/ROW]
[/TABLE]
Source: https://freestatistics.org/blog/index.php?pk=79374&T=0

Globally Unique Identifier (entire table): ba.freestatistics.org/blog/index.php?pk=79374&T=0

As an alternative you can also use a QR Code:  

The GUIDs for individual cells are displayed in the table below:

Summary of computational transaction
Raw Inputview raw input (R code)
Raw Outputview raw output of R engine
Computing time1 seconds
R Server'George Udny Yule' @ 72.249.76.132


Autocorrelation Function
Time lag kACF(k)T-STATP-value
10.9043468.28850
20.7844767.18980
30.7151326.55430
40.6471445.93120
50.5721985.24431e-06
60.5296164.8543e-06
70.4908024.49831.1e-05
80.4772594.37411.7e-05
90.469374.30192.3e-05
100.4768564.37051.8e-05
110.5320994.87683e-06
120.5713385.23641e-06
130.4748264.35191.9e-05
140.3615773.31390.00068
150.2939012.69360.004266
160.2081381.90760.029929
170.1147451.05170.147987
180.0705130.64630.259937
190.0264450.24240.404541
20-0.012067-0.11060.456101
21-0.047713-0.43730.33151
22-0.06243-0.57220.284365
23-0.042543-0.38990.348794
24-0.029319-0.26870.394404
25-0.103146-0.94530.173597
26-0.18176-1.66590.049734
27-0.224505-2.05760.021364
28-0.280346-2.56940.005977
29-0.338894-3.1060.001293
30-0.342545-3.13950.001168
31-0.347093-3.18120.001028
32-0.358729-3.28780.000738
33-0.364611-3.34170.000622
34-0.354843-3.25220.000825
35-0.329641-3.02120.001668
36-0.30927-2.83450.002874
37-0.348757-3.19640.000981
38-0.39337-3.60530.000264
39-0.409714-3.75510.000159
40-0.423653-3.88280.000102
41-0.436793-4.00336.7e-05
42-0.404746-3.70960.000186
43-0.373753-3.42550.000476
44-0.347692-3.18670.001011
45-0.309878-2.84010.002828
46-0.261765-2.39910.009324
47-0.209015-1.91570.029406
48-0.165198-1.51410.066881

\begin{tabular}{lllllllll}
\hline
Autocorrelation Function \tabularnewline
Time lag k & ACF(k) & T-STAT & P-value \tabularnewline
1 & 0.904346 & 8.2885 & 0 \tabularnewline
2 & 0.784476 & 7.1898 & 0 \tabularnewline
3 & 0.715132 & 6.5543 & 0 \tabularnewline
4 & 0.647144 & 5.9312 & 0 \tabularnewline
5 & 0.572198 & 5.2443 & 1e-06 \tabularnewline
6 & 0.529616 & 4.854 & 3e-06 \tabularnewline
7 & 0.490802 & 4.4983 & 1.1e-05 \tabularnewline
8 & 0.477259 & 4.3741 & 1.7e-05 \tabularnewline
9 & 0.46937 & 4.3019 & 2.3e-05 \tabularnewline
10 & 0.476856 & 4.3705 & 1.8e-05 \tabularnewline
11 & 0.532099 & 4.8768 & 3e-06 \tabularnewline
12 & 0.571338 & 5.2364 & 1e-06 \tabularnewline
13 & 0.474826 & 4.3519 & 1.9e-05 \tabularnewline
14 & 0.361577 & 3.3139 & 0.00068 \tabularnewline
15 & 0.293901 & 2.6936 & 0.004266 \tabularnewline
16 & 0.208138 & 1.9076 & 0.029929 \tabularnewline
17 & 0.114745 & 1.0517 & 0.147987 \tabularnewline
18 & 0.070513 & 0.6463 & 0.259937 \tabularnewline
19 & 0.026445 & 0.2424 & 0.404541 \tabularnewline
20 & -0.012067 & -0.1106 & 0.456101 \tabularnewline
21 & -0.047713 & -0.4373 & 0.33151 \tabularnewline
22 & -0.06243 & -0.5722 & 0.284365 \tabularnewline
23 & -0.042543 & -0.3899 & 0.348794 \tabularnewline
24 & -0.029319 & -0.2687 & 0.394404 \tabularnewline
25 & -0.103146 & -0.9453 & 0.173597 \tabularnewline
26 & -0.18176 & -1.6659 & 0.049734 \tabularnewline
27 & -0.224505 & -2.0576 & 0.021364 \tabularnewline
28 & -0.280346 & -2.5694 & 0.005977 \tabularnewline
29 & -0.338894 & -3.106 & 0.001293 \tabularnewline
30 & -0.342545 & -3.1395 & 0.001168 \tabularnewline
31 & -0.347093 & -3.1812 & 0.001028 \tabularnewline
32 & -0.358729 & -3.2878 & 0.000738 \tabularnewline
33 & -0.364611 & -3.3417 & 0.000622 \tabularnewline
34 & -0.354843 & -3.2522 & 0.000825 \tabularnewline
35 & -0.329641 & -3.0212 & 0.001668 \tabularnewline
36 & -0.30927 & -2.8345 & 0.002874 \tabularnewline
37 & -0.348757 & -3.1964 & 0.000981 \tabularnewline
38 & -0.39337 & -3.6053 & 0.000264 \tabularnewline
39 & -0.409714 & -3.7551 & 0.000159 \tabularnewline
40 & -0.423653 & -3.8828 & 0.000102 \tabularnewline
41 & -0.436793 & -4.0033 & 6.7e-05 \tabularnewline
42 & -0.404746 & -3.7096 & 0.000186 \tabularnewline
43 & -0.373753 & -3.4255 & 0.000476 \tabularnewline
44 & -0.347692 & -3.1867 & 0.001011 \tabularnewline
45 & -0.309878 & -2.8401 & 0.002828 \tabularnewline
46 & -0.261765 & -2.3991 & 0.009324 \tabularnewline
47 & -0.209015 & -1.9157 & 0.029406 \tabularnewline
48 & -0.165198 & -1.5141 & 0.066881 \tabularnewline
\hline
\end{tabular}
%Source: https://freestatistics.org/blog/index.php?pk=79374&T=1

[TABLE]
[ROW][C]Autocorrelation Function[/C][/ROW]
[ROW][C]Time lag k[/C][C]ACF(k)[/C][C]T-STAT[/C][C]P-value[/C][/ROW]
[ROW][C]1[/C][C]0.904346[/C][C]8.2885[/C][C]0[/C][/ROW]
[ROW][C]2[/C][C]0.784476[/C][C]7.1898[/C][C]0[/C][/ROW]
[ROW][C]3[/C][C]0.715132[/C][C]6.5543[/C][C]0[/C][/ROW]
[ROW][C]4[/C][C]0.647144[/C][C]5.9312[/C][C]0[/C][/ROW]
[ROW][C]5[/C][C]0.572198[/C][C]5.2443[/C][C]1e-06[/C][/ROW]
[ROW][C]6[/C][C]0.529616[/C][C]4.854[/C][C]3e-06[/C][/ROW]
[ROW][C]7[/C][C]0.490802[/C][C]4.4983[/C][C]1.1e-05[/C][/ROW]
[ROW][C]8[/C][C]0.477259[/C][C]4.3741[/C][C]1.7e-05[/C][/ROW]
[ROW][C]9[/C][C]0.46937[/C][C]4.3019[/C][C]2.3e-05[/C][/ROW]
[ROW][C]10[/C][C]0.476856[/C][C]4.3705[/C][C]1.8e-05[/C][/ROW]
[ROW][C]11[/C][C]0.532099[/C][C]4.8768[/C][C]3e-06[/C][/ROW]
[ROW][C]12[/C][C]0.571338[/C][C]5.2364[/C][C]1e-06[/C][/ROW]
[ROW][C]13[/C][C]0.474826[/C][C]4.3519[/C][C]1.9e-05[/C][/ROW]
[ROW][C]14[/C][C]0.361577[/C][C]3.3139[/C][C]0.00068[/C][/ROW]
[ROW][C]15[/C][C]0.293901[/C][C]2.6936[/C][C]0.004266[/C][/ROW]
[ROW][C]16[/C][C]0.208138[/C][C]1.9076[/C][C]0.029929[/C][/ROW]
[ROW][C]17[/C][C]0.114745[/C][C]1.0517[/C][C]0.147987[/C][/ROW]
[ROW][C]18[/C][C]0.070513[/C][C]0.6463[/C][C]0.259937[/C][/ROW]
[ROW][C]19[/C][C]0.026445[/C][C]0.2424[/C][C]0.404541[/C][/ROW]
[ROW][C]20[/C][C]-0.012067[/C][C]-0.1106[/C][C]0.456101[/C][/ROW]
[ROW][C]21[/C][C]-0.047713[/C][C]-0.4373[/C][C]0.33151[/C][/ROW]
[ROW][C]22[/C][C]-0.06243[/C][C]-0.5722[/C][C]0.284365[/C][/ROW]
[ROW][C]23[/C][C]-0.042543[/C][C]-0.3899[/C][C]0.348794[/C][/ROW]
[ROW][C]24[/C][C]-0.029319[/C][C]-0.2687[/C][C]0.394404[/C][/ROW]
[ROW][C]25[/C][C]-0.103146[/C][C]-0.9453[/C][C]0.173597[/C][/ROW]
[ROW][C]26[/C][C]-0.18176[/C][C]-1.6659[/C][C]0.049734[/C][/ROW]
[ROW][C]27[/C][C]-0.224505[/C][C]-2.0576[/C][C]0.021364[/C][/ROW]
[ROW][C]28[/C][C]-0.280346[/C][C]-2.5694[/C][C]0.005977[/C][/ROW]
[ROW][C]29[/C][C]-0.338894[/C][C]-3.106[/C][C]0.001293[/C][/ROW]
[ROW][C]30[/C][C]-0.342545[/C][C]-3.1395[/C][C]0.001168[/C][/ROW]
[ROW][C]31[/C][C]-0.347093[/C][C]-3.1812[/C][C]0.001028[/C][/ROW]
[ROW][C]32[/C][C]-0.358729[/C][C]-3.2878[/C][C]0.000738[/C][/ROW]
[ROW][C]33[/C][C]-0.364611[/C][C]-3.3417[/C][C]0.000622[/C][/ROW]
[ROW][C]34[/C][C]-0.354843[/C][C]-3.2522[/C][C]0.000825[/C][/ROW]
[ROW][C]35[/C][C]-0.329641[/C][C]-3.0212[/C][C]0.001668[/C][/ROW]
[ROW][C]36[/C][C]-0.30927[/C][C]-2.8345[/C][C]0.002874[/C][/ROW]
[ROW][C]37[/C][C]-0.348757[/C][C]-3.1964[/C][C]0.000981[/C][/ROW]
[ROW][C]38[/C][C]-0.39337[/C][C]-3.6053[/C][C]0.000264[/C][/ROW]
[ROW][C]39[/C][C]-0.409714[/C][C]-3.7551[/C][C]0.000159[/C][/ROW]
[ROW][C]40[/C][C]-0.423653[/C][C]-3.8828[/C][C]0.000102[/C][/ROW]
[ROW][C]41[/C][C]-0.436793[/C][C]-4.0033[/C][C]6.7e-05[/C][/ROW]
[ROW][C]42[/C][C]-0.404746[/C][C]-3.7096[/C][C]0.000186[/C][/ROW]
[ROW][C]43[/C][C]-0.373753[/C][C]-3.4255[/C][C]0.000476[/C][/ROW]
[ROW][C]44[/C][C]-0.347692[/C][C]-3.1867[/C][C]0.001011[/C][/ROW]
[ROW][C]45[/C][C]-0.309878[/C][C]-2.8401[/C][C]0.002828[/C][/ROW]
[ROW][C]46[/C][C]-0.261765[/C][C]-2.3991[/C][C]0.009324[/C][/ROW]
[ROW][C]47[/C][C]-0.209015[/C][C]-1.9157[/C][C]0.029406[/C][/ROW]
[ROW][C]48[/C][C]-0.165198[/C][C]-1.5141[/C][C]0.066881[/C][/ROW]
[/TABLE]
Source: https://freestatistics.org/blog/index.php?pk=79374&T=1

Globally Unique Identifier (entire table): ba.freestatistics.org/blog/index.php?pk=79374&T=1

As an alternative you can also use a QR Code:  

The GUIDs for individual cells are displayed in the table below:

Autocorrelation Function
Time lag kACF(k)T-STATP-value
10.9043468.28850
20.7844767.18980
30.7151326.55430
40.6471445.93120
50.5721985.24431e-06
60.5296164.8543e-06
70.4908024.49831.1e-05
80.4772594.37411.7e-05
90.469374.30192.3e-05
100.4768564.37051.8e-05
110.5320994.87683e-06
120.5713385.23641e-06
130.4748264.35191.9e-05
140.3615773.31390.00068
150.2939012.69360.004266
160.2081381.90760.029929
170.1147451.05170.147987
180.0705130.64630.259937
190.0264450.24240.404541
20-0.012067-0.11060.456101
21-0.047713-0.43730.33151
22-0.06243-0.57220.284365
23-0.042543-0.38990.348794
24-0.029319-0.26870.394404
25-0.103146-0.94530.173597
26-0.18176-1.66590.049734
27-0.224505-2.05760.021364
28-0.280346-2.56940.005977
29-0.338894-3.1060.001293
30-0.342545-3.13950.001168
31-0.347093-3.18120.001028
32-0.358729-3.28780.000738
33-0.364611-3.34170.000622
34-0.354843-3.25220.000825
35-0.329641-3.02120.001668
36-0.30927-2.83450.002874
37-0.348757-3.19640.000981
38-0.39337-3.60530.000264
39-0.409714-3.75510.000159
40-0.423653-3.88280.000102
41-0.436793-4.00336.7e-05
42-0.404746-3.70960.000186
43-0.373753-3.42550.000476
44-0.347692-3.18670.001011
45-0.309878-2.84010.002828
46-0.261765-2.39910.009324
47-0.209015-1.91570.029406
48-0.165198-1.51410.066881


Partial Autocorrelation Function
Time lag kPACF(k)T-STATP-value
10.9043468.28850
2-0.183166-1.67870.048459
30.2351322.1550.017011
4-0.122813-1.12560.13177
50.0101640.09320.463001
60.1260021.15480.125718
7-0.077032-0.7060.241067
80.2372182.17410.016254
9-0.08804-0.80690.211002
100.217211.99080.024879
110.2834772.59810.005534
12-0.161689-1.48190.071054
13-0.607944-5.57190
140.0308810.2830.388924
15-0.037151-0.34050.367168
16-0.16413-1.50430.06813
170.0798720.7320.233091
180.1253981.14930.126848
19-0.105894-0.97050.167283
20-0.04957-0.45430.325385
21-0.157908-1.44730.075774
22-0.041786-0.3830.351352
23-0.155349-1.42380.079104
240.0063330.0580.476926
250.0811130.74340.229654
26-0.012057-0.11050.456135
270.0025260.02310.490793
280.1279961.17310.122036
29-0.042721-0.39150.348194
30-0.031191-0.28590.38784
31-0.002222-0.02040.491901
320.0186470.17090.432356
33-0.005892-0.0540.478532
34-0.025576-0.23440.40762
350.010490.09610.461819
360.0047240.04330.482784
37-0.098232-0.90030.185265
38-0.045381-0.41590.339263
390.05450.49950.309366
400.0981210.89930.185534
41-0.026982-0.24730.40264
42-0.004397-0.04030.483975
430.0006360.00580.497681
440.0344160.31540.376609
450.0065970.06050.475966
460.0111850.10250.459296
470.1369871.25550.106388
48-0.075641-0.69330.24503

\begin{tabular}{lllllllll}
\hline
Partial Autocorrelation Function \tabularnewline
Time lag k & PACF(k) & T-STAT & P-value \tabularnewline
1 & 0.904346 & 8.2885 & 0 \tabularnewline
2 & -0.183166 & -1.6787 & 0.048459 \tabularnewline
3 & 0.235132 & 2.155 & 0.017011 \tabularnewline
4 & -0.122813 & -1.1256 & 0.13177 \tabularnewline
5 & 0.010164 & 0.0932 & 0.463001 \tabularnewline
6 & 0.126002 & 1.1548 & 0.125718 \tabularnewline
7 & -0.077032 & -0.706 & 0.241067 \tabularnewline
8 & 0.237218 & 2.1741 & 0.016254 \tabularnewline
9 & -0.08804 & -0.8069 & 0.211002 \tabularnewline
10 & 0.21721 & 1.9908 & 0.024879 \tabularnewline
11 & 0.283477 & 2.5981 & 0.005534 \tabularnewline
12 & -0.161689 & -1.4819 & 0.071054 \tabularnewline
13 & -0.607944 & -5.5719 & 0 \tabularnewline
14 & 0.030881 & 0.283 & 0.388924 \tabularnewline
15 & -0.037151 & -0.3405 & 0.367168 \tabularnewline
16 & -0.16413 & -1.5043 & 0.06813 \tabularnewline
17 & 0.079872 & 0.732 & 0.233091 \tabularnewline
18 & 0.125398 & 1.1493 & 0.126848 \tabularnewline
19 & -0.105894 & -0.9705 & 0.167283 \tabularnewline
20 & -0.04957 & -0.4543 & 0.325385 \tabularnewline
21 & -0.157908 & -1.4473 & 0.075774 \tabularnewline
22 & -0.041786 & -0.383 & 0.351352 \tabularnewline
23 & -0.155349 & -1.4238 & 0.079104 \tabularnewline
24 & 0.006333 & 0.058 & 0.476926 \tabularnewline
25 & 0.081113 & 0.7434 & 0.229654 \tabularnewline
26 & -0.012057 & -0.1105 & 0.456135 \tabularnewline
27 & 0.002526 & 0.0231 & 0.490793 \tabularnewline
28 & 0.127996 & 1.1731 & 0.122036 \tabularnewline
29 & -0.042721 & -0.3915 & 0.348194 \tabularnewline
30 & -0.031191 & -0.2859 & 0.38784 \tabularnewline
31 & -0.002222 & -0.0204 & 0.491901 \tabularnewline
32 & 0.018647 & 0.1709 & 0.432356 \tabularnewline
33 & -0.005892 & -0.054 & 0.478532 \tabularnewline
34 & -0.025576 & -0.2344 & 0.40762 \tabularnewline
35 & 0.01049 & 0.0961 & 0.461819 \tabularnewline
36 & 0.004724 & 0.0433 & 0.482784 \tabularnewline
37 & -0.098232 & -0.9003 & 0.185265 \tabularnewline
38 & -0.045381 & -0.4159 & 0.339263 \tabularnewline
39 & 0.0545 & 0.4995 & 0.309366 \tabularnewline
40 & 0.098121 & 0.8993 & 0.185534 \tabularnewline
41 & -0.026982 & -0.2473 & 0.40264 \tabularnewline
42 & -0.004397 & -0.0403 & 0.483975 \tabularnewline
43 & 0.000636 & 0.0058 & 0.497681 \tabularnewline
44 & 0.034416 & 0.3154 & 0.376609 \tabularnewline
45 & 0.006597 & 0.0605 & 0.475966 \tabularnewline
46 & 0.011185 & 0.1025 & 0.459296 \tabularnewline
47 & 0.136987 & 1.2555 & 0.106388 \tabularnewline
48 & -0.075641 & -0.6933 & 0.24503 \tabularnewline
\hline
\end{tabular}
%Source: https://freestatistics.org/blog/index.php?pk=79374&T=2

[TABLE]
[ROW][C]Partial Autocorrelation Function[/C][/ROW]
[ROW][C]Time lag k[/C][C]PACF(k)[/C][C]T-STAT[/C][C]P-value[/C][/ROW]
[ROW][C]1[/C][C]0.904346[/C][C]8.2885[/C][C]0[/C][/ROW]
[ROW][C]2[/C][C]-0.183166[/C][C]-1.6787[/C][C]0.048459[/C][/ROW]
[ROW][C]3[/C][C]0.235132[/C][C]2.155[/C][C]0.017011[/C][/ROW]
[ROW][C]4[/C][C]-0.122813[/C][C]-1.1256[/C][C]0.13177[/C][/ROW]
[ROW][C]5[/C][C]0.010164[/C][C]0.0932[/C][C]0.463001[/C][/ROW]
[ROW][C]6[/C][C]0.126002[/C][C]1.1548[/C][C]0.125718[/C][/ROW]
[ROW][C]7[/C][C]-0.077032[/C][C]-0.706[/C][C]0.241067[/C][/ROW]
[ROW][C]8[/C][C]0.237218[/C][C]2.1741[/C][C]0.016254[/C][/ROW]
[ROW][C]9[/C][C]-0.08804[/C][C]-0.8069[/C][C]0.211002[/C][/ROW]
[ROW][C]10[/C][C]0.21721[/C][C]1.9908[/C][C]0.024879[/C][/ROW]
[ROW][C]11[/C][C]0.283477[/C][C]2.5981[/C][C]0.005534[/C][/ROW]
[ROW][C]12[/C][C]-0.161689[/C][C]-1.4819[/C][C]0.071054[/C][/ROW]
[ROW][C]13[/C][C]-0.607944[/C][C]-5.5719[/C][C]0[/C][/ROW]
[ROW][C]14[/C][C]0.030881[/C][C]0.283[/C][C]0.388924[/C][/ROW]
[ROW][C]15[/C][C]-0.037151[/C][C]-0.3405[/C][C]0.367168[/C][/ROW]
[ROW][C]16[/C][C]-0.16413[/C][C]-1.5043[/C][C]0.06813[/C][/ROW]
[ROW][C]17[/C][C]0.079872[/C][C]0.732[/C][C]0.233091[/C][/ROW]
[ROW][C]18[/C][C]0.125398[/C][C]1.1493[/C][C]0.126848[/C][/ROW]
[ROW][C]19[/C][C]-0.105894[/C][C]-0.9705[/C][C]0.167283[/C][/ROW]
[ROW][C]20[/C][C]-0.04957[/C][C]-0.4543[/C][C]0.325385[/C][/ROW]
[ROW][C]21[/C][C]-0.157908[/C][C]-1.4473[/C][C]0.075774[/C][/ROW]
[ROW][C]22[/C][C]-0.041786[/C][C]-0.383[/C][C]0.351352[/C][/ROW]
[ROW][C]23[/C][C]-0.155349[/C][C]-1.4238[/C][C]0.079104[/C][/ROW]
[ROW][C]24[/C][C]0.006333[/C][C]0.058[/C][C]0.476926[/C][/ROW]
[ROW][C]25[/C][C]0.081113[/C][C]0.7434[/C][C]0.229654[/C][/ROW]
[ROW][C]26[/C][C]-0.012057[/C][C]-0.1105[/C][C]0.456135[/C][/ROW]
[ROW][C]27[/C][C]0.002526[/C][C]0.0231[/C][C]0.490793[/C][/ROW]
[ROW][C]28[/C][C]0.127996[/C][C]1.1731[/C][C]0.122036[/C][/ROW]
[ROW][C]29[/C][C]-0.042721[/C][C]-0.3915[/C][C]0.348194[/C][/ROW]
[ROW][C]30[/C][C]-0.031191[/C][C]-0.2859[/C][C]0.38784[/C][/ROW]
[ROW][C]31[/C][C]-0.002222[/C][C]-0.0204[/C][C]0.491901[/C][/ROW]
[ROW][C]32[/C][C]0.018647[/C][C]0.1709[/C][C]0.432356[/C][/ROW]
[ROW][C]33[/C][C]-0.005892[/C][C]-0.054[/C][C]0.478532[/C][/ROW]
[ROW][C]34[/C][C]-0.025576[/C][C]-0.2344[/C][C]0.40762[/C][/ROW]
[ROW][C]35[/C][C]0.01049[/C][C]0.0961[/C][C]0.461819[/C][/ROW]
[ROW][C]36[/C][C]0.004724[/C][C]0.0433[/C][C]0.482784[/C][/ROW]
[ROW][C]37[/C][C]-0.098232[/C][C]-0.9003[/C][C]0.185265[/C][/ROW]
[ROW][C]38[/C][C]-0.045381[/C][C]-0.4159[/C][C]0.339263[/C][/ROW]
[ROW][C]39[/C][C]0.0545[/C][C]0.4995[/C][C]0.309366[/C][/ROW]
[ROW][C]40[/C][C]0.098121[/C][C]0.8993[/C][C]0.185534[/C][/ROW]
[ROW][C]41[/C][C]-0.026982[/C][C]-0.2473[/C][C]0.40264[/C][/ROW]
[ROW][C]42[/C][C]-0.004397[/C][C]-0.0403[/C][C]0.483975[/C][/ROW]
[ROW][C]43[/C][C]0.000636[/C][C]0.0058[/C][C]0.497681[/C][/ROW]
[ROW][C]44[/C][C]0.034416[/C][C]0.3154[/C][C]0.376609[/C][/ROW]
[ROW][C]45[/C][C]0.006597[/C][C]0.0605[/C][C]0.475966[/C][/ROW]
[ROW][C]46[/C][C]0.011185[/C][C]0.1025[/C][C]0.459296[/C][/ROW]
[ROW][C]47[/C][C]0.136987[/C][C]1.2555[/C][C]0.106388[/C][/ROW]
[ROW][C]48[/C][C]-0.075641[/C][C]-0.6933[/C][C]0.24503[/C][/ROW]
[/TABLE]
Source: https://freestatistics.org/blog/index.php?pk=79374&T=2

Globally Unique Identifier (entire table): ba.freestatistics.org/blog/index.php?pk=79374&T=2

As an alternative you can also use a QR Code:  

The GUIDs for individual cells are displayed in the table below:

Partial Autocorrelation Function
Time lag kPACF(k)T-STATP-value
10.9043468.28850
2-0.183166-1.67870.048459
30.2351322.1550.017011
4-0.122813-1.12560.13177
50.0101640.09320.463001
60.1260021.15480.125718
7-0.077032-0.7060.241067
80.2372182.17410.016254
9-0.08804-0.80690.211002
100.217211.99080.024879
110.2834772.59810.005534
12-0.161689-1.48190.071054
13-0.607944-5.57190
140.0308810.2830.388924
15-0.037151-0.34050.367168
16-0.16413-1.50430.06813
170.0798720.7320.233091
180.1253981.14930.126848
19-0.105894-0.97050.167283
20-0.04957-0.45430.325385
21-0.157908-1.44730.075774
22-0.041786-0.3830.351352
23-0.155349-1.42380.079104
240.0063330.0580.476926
250.0811130.74340.229654
26-0.012057-0.11050.456135
270.0025260.02310.490793
280.1279961.17310.122036
29-0.042721-0.39150.348194
30-0.031191-0.28590.38784
31-0.002222-0.02040.491901
320.0186470.17090.432356
33-0.005892-0.0540.478532
34-0.025576-0.23440.40762
350.010490.09610.461819
360.0047240.04330.482784
37-0.098232-0.90030.185265
38-0.045381-0.41590.339263
390.05450.49950.309366
400.0981210.89930.185534
41-0.026982-0.24730.40264
42-0.004397-0.04030.483975
430.0006360.00580.497681
440.0344160.31540.376609
450.0065970.06050.475966
460.0111850.10250.459296
470.1369871.25550.106388
48-0.075641-0.69330.24503


Parameters (Session):
Parameters (R input):
par1 = 48 ; par2 = 1 ; par3 = 0 ; par4 = 0 ; par5 = 12 ; par6 = White Noise ; par7 = 0.95 ;
R code (references can be found in the software module):
if (par1 == 'Default') {
par1 = 10*log10(length(x))
} else {
par1 <- as.numeric(par1)
}
par2 <- as.numeric(par2)
par3 <- as.numeric(par3)
par4 <- as.numeric(par4)
par5 <- as.numeric(par5)
if (par6 == 'White Noise') par6 <- 'white' else par6 <- 'ma'
par7 <- as.numeric(par7)
if (par2 == 0) {
x <- log(x)
} else {
x <- (x ^ par2 - 1) / par2
}
if (par3 > 0) x <- diff(x,lag=1,difference=par3)
if (par4 > 0) x <- diff(x,lag=par5,difference=par4)
bitmap(file='pic1.png')
racf <- acf(x, par1, main='Autocorrelation', xlab='time lag', ylab='ACF', ci.type=par6, ci=par7, sub=paste('(lambda=',par2,', d=',par3,', D=',par4,', CI=', par7, ', CI type=',par6,')',sep=''))
dev.off()
bitmap(file='pic2.png')
rpacf <- pacf(x,par1,main='Partial Autocorrelation',xlab='lags',ylab='PACF')
dev.off()
(myacf <- c(racf$acf))
(mypacf <- c(rpacf$acf))
lengthx <- length(x)
sqrtn <- sqrt(lengthx)
load(file='createtable')
a<-table.start()
a<-table.row.start(a)
a<-table.element(a,'Autocorrelation Function',4,TRUE)
a<-table.row.end(a)
a<-table.row.start(a)
a<-table.element(a,'Time lag k',header=TRUE)
a<-table.element(a,hyperlink('basics.htm','ACF(k)','click here for more information about the Autocorrelation Function'),header=TRUE)
a<-table.element(a,'T-STAT',header=TRUE)
a<-table.element(a,'P-value',header=TRUE)
a<-table.row.end(a)
for (i in 2:(par1+1)) {
a<-table.row.start(a)
a<-table.element(a,i-1,header=TRUE)
a<-table.element(a,round(myacf[i],6))
mytstat <- myacf[i]*sqrtn
a<-table.element(a,round(mytstat,4))
a<-table.element(a,round(1-pt(abs(mytstat),lengthx),6))
a<-table.row.end(a)
}
a<-table.end(a)
table.save(a,file='mytable.tab')
a<-table.start()
a<-table.row.start(a)
a<-table.element(a,'Partial Autocorrelation Function',4,TRUE)
a<-table.row.end(a)
a<-table.row.start(a)
a<-table.element(a,'Time lag k',header=TRUE)
a<-table.element(a,hyperlink('basics.htm','PACF(k)','click here for more information about the Partial Autocorrelation Function'),header=TRUE)
a<-table.element(a,'T-STAT',header=TRUE)
a<-table.element(a,'P-value',header=TRUE)
a<-table.row.end(a)
for (i in 1:par1) {
a<-table.row.start(a)
a<-table.element(a,i,header=TRUE)
a<-table.element(a,round(mypacf[i],6))
mytstat <- mypacf[i]*sqrtn
a<-table.element(a,round(mytstat,4))
a<-table.element(a,round(1-pt(abs(mytstat),lengthx),6))
a<-table.row.end(a)
}
a<-table.end(a)
table.save(a,file='mytable1.tab')