Free Statistics

of Irreproducible Research!

Author's title

Author*Unverified author*
R Software Modulerwasp_autocorrelation.wasp
Title produced by software(Partial) Autocorrelation Function
Date of computationThu, 19 Aug 2010 18:53:13 +0000
Cite this page as followsStatistical Computations at FreeStatistics.org, Office for Research Development and Education, URL https://freestatistics.org/blog/index.php?v=date/2010/Aug/19/t1282244012c00bkmbm2wu58tb.htm/, Retrieved Fri, 03 May 2024 06:26:20 +0000
Statistical Computations at FreeStatistics.org, Office for Research Development and Education, URL https://freestatistics.org/blog/index.php?pk=79343, Retrieved Fri, 03 May 2024 06:26:20 +0000
QR Codes:

Original text written by user:
IsPrivate?No (this computation is public)
User-defined keywordsAerts Ellen
Estimated Impact103
Family? (F = Feedback message, R = changed R code, M = changed R Module, P = changed Parameters, D = changed Data)
-       [(Partial) Autocorrelation Function] [tijdreeks 1- stap 20] [2010-08-19 18:53:13] [6e43eada780a1520be8ab5bc59456d41] [Current]
Feedback Forum

Post a new message
Dataseries X:
25
24
23
21
41
40
25
15
16
16
17
19
18
19
20
21
46
47
30
16
15
18
30
31
32
36
30
31
61
57
45
33
31
36
46
49
34
40
41
48
75
77
71
54
50
56
66
66
48
63
71
70
88
92
91
80
81
81
98
106
85
93
96
92
115
109
119
107
107
106
132
143
120
123
132
136
158
151
155
138
143
139
168
182
154
158
167
170
197
190
196
174
180
171
200
215
184
186
197
186
211
205
218
199
213
207
236
248
211
220
235
223
245
236
253
246
255
248
274
288


Summary of computational transaction
Raw Inputview raw input (R code)
Raw Outputview raw output of R engine
Computing time2 seconds
R Server'Sir Ronald Aylmer Fisher' @ 193.190.124.24

\begin{tabular}{lllllllll}
\hline
Summary of computational transaction \tabularnewline
Raw Input & view raw input (R code)  \tabularnewline
Raw Output & view raw output of R engine  \tabularnewline
Computing time & 2 seconds \tabularnewline
R Server & 'Sir Ronald Aylmer Fisher' @ 193.190.124.24 \tabularnewline
\hline
\end{tabular}
%Source: https://freestatistics.org/blog/index.php?pk=79343&T=0

[TABLE]
[ROW][C]Summary of computational transaction[/C][/ROW]
[ROW][C]Raw Input[/C][C]view raw input (R code) [/C][/ROW]
[ROW][C]Raw Output[/C][C]view raw output of R engine [/C][/ROW]
[ROW][C]Computing time[/C][C]2 seconds[/C][/ROW]
[ROW][C]R Server[/C][C]'Sir Ronald Aylmer Fisher' @ 193.190.124.24[/C][/ROW]
[/TABLE]
Source: https://freestatistics.org/blog/index.php?pk=79343&T=0

Globally Unique Identifier (entire table): ba.freestatistics.org/blog/index.php?pk=79343&T=0

As an alternative you can also use a QR Code:  

The GUIDs for individual cells are displayed in the table below:

Summary of computational transaction
Raw Inputview raw input (R code)
Raw Outputview raw output of R engine
Computing time2 seconds
R Server'Sir Ronald Aylmer Fisher' @ 193.190.124.24


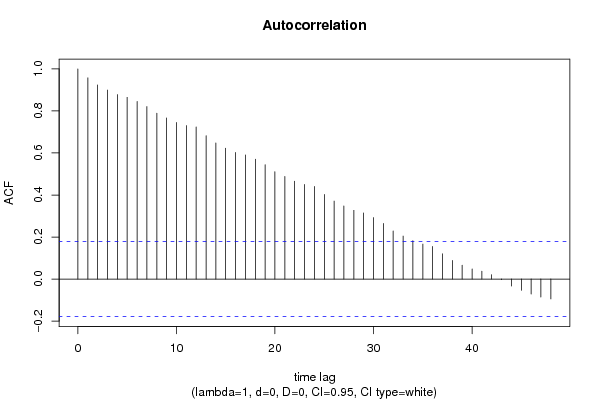
Autocorrelation Function
Time lag kACF(k)T-STATP-value
10.95760110.490
20.92354110.11690
30.899369.8520
40.8780169.61820
50.8648889.47440
60.8452079.25880
70.8207718.99110
80.7889848.64290
90.7666958.39870
100.7448378.15930
110.7304858.00210
120.7239097.930
130.68267.47750
140.647787.09610
150.6230646.82530
160.6021346.5960
170.5908556.47250
180.5703336.24770
190.5439655.95880
200.510685.59420
210.4881175.34710
220.4656555.1011e-06
230.4502854.93261e-06
240.4406124.82672e-06
250.4029464.41411.1e-05
260.3709544.06364.3e-05
270.3476853.80870.000111
280.3271243.58350.000246
290.3147353.44770.00039
300.2926653.2060.000863
310.26422.89420.002259
320.2285932.50410.006809
330.2045072.24030.013457
340.1827532.0020.023772
350.1663271.8220.035471
360.1555511.7040.045486
370.1199561.31410.095667
380.0887450.97220.166466
390.0663160.72650.234486
400.0483290.52940.298745
410.0376750.41270.340279
420.0203970.22340.411789
43-0.002738-0.030.488062
44-0.03309-0.36250.358813
45-0.053155-0.58230.280733
46-0.071585-0.78420.217242
47-0.08526-0.9340.176096
48-0.094447-1.03460.151465

\begin{tabular}{lllllllll}
\hline
Autocorrelation Function \tabularnewline
Time lag k & ACF(k) & T-STAT & P-value \tabularnewline
1 & 0.957601 & 10.49 & 0 \tabularnewline
2 & 0.923541 & 10.1169 & 0 \tabularnewline
3 & 0.89936 & 9.852 & 0 \tabularnewline
4 & 0.878016 & 9.6182 & 0 \tabularnewline
5 & 0.864888 & 9.4744 & 0 \tabularnewline
6 & 0.845207 & 9.2588 & 0 \tabularnewline
7 & 0.820771 & 8.9911 & 0 \tabularnewline
8 & 0.788984 & 8.6429 & 0 \tabularnewline
9 & 0.766695 & 8.3987 & 0 \tabularnewline
10 & 0.744837 & 8.1593 & 0 \tabularnewline
11 & 0.730485 & 8.0021 & 0 \tabularnewline
12 & 0.723909 & 7.93 & 0 \tabularnewline
13 & 0.6826 & 7.4775 & 0 \tabularnewline
14 & 0.64778 & 7.0961 & 0 \tabularnewline
15 & 0.623064 & 6.8253 & 0 \tabularnewline
16 & 0.602134 & 6.596 & 0 \tabularnewline
17 & 0.590855 & 6.4725 & 0 \tabularnewline
18 & 0.570333 & 6.2477 & 0 \tabularnewline
19 & 0.543965 & 5.9588 & 0 \tabularnewline
20 & 0.51068 & 5.5942 & 0 \tabularnewline
21 & 0.488117 & 5.3471 & 0 \tabularnewline
22 & 0.465655 & 5.101 & 1e-06 \tabularnewline
23 & 0.450285 & 4.9326 & 1e-06 \tabularnewline
24 & 0.440612 & 4.8267 & 2e-06 \tabularnewline
25 & 0.402946 & 4.4141 & 1.1e-05 \tabularnewline
26 & 0.370954 & 4.0636 & 4.3e-05 \tabularnewline
27 & 0.347685 & 3.8087 & 0.000111 \tabularnewline
28 & 0.327124 & 3.5835 & 0.000246 \tabularnewline
29 & 0.314735 & 3.4477 & 0.00039 \tabularnewline
30 & 0.292665 & 3.206 & 0.000863 \tabularnewline
31 & 0.2642 & 2.8942 & 0.002259 \tabularnewline
32 & 0.228593 & 2.5041 & 0.006809 \tabularnewline
33 & 0.204507 & 2.2403 & 0.013457 \tabularnewline
34 & 0.182753 & 2.002 & 0.023772 \tabularnewline
35 & 0.166327 & 1.822 & 0.035471 \tabularnewline
36 & 0.155551 & 1.704 & 0.045486 \tabularnewline
37 & 0.119956 & 1.3141 & 0.095667 \tabularnewline
38 & 0.088745 & 0.9722 & 0.166466 \tabularnewline
39 & 0.066316 & 0.7265 & 0.234486 \tabularnewline
40 & 0.048329 & 0.5294 & 0.298745 \tabularnewline
41 & 0.037675 & 0.4127 & 0.340279 \tabularnewline
42 & 0.020397 & 0.2234 & 0.411789 \tabularnewline
43 & -0.002738 & -0.03 & 0.488062 \tabularnewline
44 & -0.03309 & -0.3625 & 0.358813 \tabularnewline
45 & -0.053155 & -0.5823 & 0.280733 \tabularnewline
46 & -0.071585 & -0.7842 & 0.217242 \tabularnewline
47 & -0.08526 & -0.934 & 0.176096 \tabularnewline
48 & -0.094447 & -1.0346 & 0.151465 \tabularnewline
\hline
\end{tabular}
%Source: https://freestatistics.org/blog/index.php?pk=79343&T=1

[TABLE]
[ROW][C]Autocorrelation Function[/C][/ROW]
[ROW][C]Time lag k[/C][C]ACF(k)[/C][C]T-STAT[/C][C]P-value[/C][/ROW]
[ROW][C]1[/C][C]0.957601[/C][C]10.49[/C][C]0[/C][/ROW]
[ROW][C]2[/C][C]0.923541[/C][C]10.1169[/C][C]0[/C][/ROW]
[ROW][C]3[/C][C]0.89936[/C][C]9.852[/C][C]0[/C][/ROW]
[ROW][C]4[/C][C]0.878016[/C][C]9.6182[/C][C]0[/C][/ROW]
[ROW][C]5[/C][C]0.864888[/C][C]9.4744[/C][C]0[/C][/ROW]
[ROW][C]6[/C][C]0.845207[/C][C]9.2588[/C][C]0[/C][/ROW]
[ROW][C]7[/C][C]0.820771[/C][C]8.9911[/C][C]0[/C][/ROW]
[ROW][C]8[/C][C]0.788984[/C][C]8.6429[/C][C]0[/C][/ROW]
[ROW][C]9[/C][C]0.766695[/C][C]8.3987[/C][C]0[/C][/ROW]
[ROW][C]10[/C][C]0.744837[/C][C]8.1593[/C][C]0[/C][/ROW]
[ROW][C]11[/C][C]0.730485[/C][C]8.0021[/C][C]0[/C][/ROW]
[ROW][C]12[/C][C]0.723909[/C][C]7.93[/C][C]0[/C][/ROW]
[ROW][C]13[/C][C]0.6826[/C][C]7.4775[/C][C]0[/C][/ROW]
[ROW][C]14[/C][C]0.64778[/C][C]7.0961[/C][C]0[/C][/ROW]
[ROW][C]15[/C][C]0.623064[/C][C]6.8253[/C][C]0[/C][/ROW]
[ROW][C]16[/C][C]0.602134[/C][C]6.596[/C][C]0[/C][/ROW]
[ROW][C]17[/C][C]0.590855[/C][C]6.4725[/C][C]0[/C][/ROW]
[ROW][C]18[/C][C]0.570333[/C][C]6.2477[/C][C]0[/C][/ROW]
[ROW][C]19[/C][C]0.543965[/C][C]5.9588[/C][C]0[/C][/ROW]
[ROW][C]20[/C][C]0.51068[/C][C]5.5942[/C][C]0[/C][/ROW]
[ROW][C]21[/C][C]0.488117[/C][C]5.3471[/C][C]0[/C][/ROW]
[ROW][C]22[/C][C]0.465655[/C][C]5.101[/C][C]1e-06[/C][/ROW]
[ROW][C]23[/C][C]0.450285[/C][C]4.9326[/C][C]1e-06[/C][/ROW]
[ROW][C]24[/C][C]0.440612[/C][C]4.8267[/C][C]2e-06[/C][/ROW]
[ROW][C]25[/C][C]0.402946[/C][C]4.4141[/C][C]1.1e-05[/C][/ROW]
[ROW][C]26[/C][C]0.370954[/C][C]4.0636[/C][C]4.3e-05[/C][/ROW]
[ROW][C]27[/C][C]0.347685[/C][C]3.8087[/C][C]0.000111[/C][/ROW]
[ROW][C]28[/C][C]0.327124[/C][C]3.5835[/C][C]0.000246[/C][/ROW]
[ROW][C]29[/C][C]0.314735[/C][C]3.4477[/C][C]0.00039[/C][/ROW]
[ROW][C]30[/C][C]0.292665[/C][C]3.206[/C][C]0.000863[/C][/ROW]
[ROW][C]31[/C][C]0.2642[/C][C]2.8942[/C][C]0.002259[/C][/ROW]
[ROW][C]32[/C][C]0.228593[/C][C]2.5041[/C][C]0.006809[/C][/ROW]
[ROW][C]33[/C][C]0.204507[/C][C]2.2403[/C][C]0.013457[/C][/ROW]
[ROW][C]34[/C][C]0.182753[/C][C]2.002[/C][C]0.023772[/C][/ROW]
[ROW][C]35[/C][C]0.166327[/C][C]1.822[/C][C]0.035471[/C][/ROW]
[ROW][C]36[/C][C]0.155551[/C][C]1.704[/C][C]0.045486[/C][/ROW]
[ROW][C]37[/C][C]0.119956[/C][C]1.3141[/C][C]0.095667[/C][/ROW]
[ROW][C]38[/C][C]0.088745[/C][C]0.9722[/C][C]0.166466[/C][/ROW]
[ROW][C]39[/C][C]0.066316[/C][C]0.7265[/C][C]0.234486[/C][/ROW]
[ROW][C]40[/C][C]0.048329[/C][C]0.5294[/C][C]0.298745[/C][/ROW]
[ROW][C]41[/C][C]0.037675[/C][C]0.4127[/C][C]0.340279[/C][/ROW]
[ROW][C]42[/C][C]0.020397[/C][C]0.2234[/C][C]0.411789[/C][/ROW]
[ROW][C]43[/C][C]-0.002738[/C][C]-0.03[/C][C]0.488062[/C][/ROW]
[ROW][C]44[/C][C]-0.03309[/C][C]-0.3625[/C][C]0.358813[/C][/ROW]
[ROW][C]45[/C][C]-0.053155[/C][C]-0.5823[/C][C]0.280733[/C][/ROW]
[ROW][C]46[/C][C]-0.071585[/C][C]-0.7842[/C][C]0.217242[/C][/ROW]
[ROW][C]47[/C][C]-0.08526[/C][C]-0.934[/C][C]0.176096[/C][/ROW]
[ROW][C]48[/C][C]-0.094447[/C][C]-1.0346[/C][C]0.151465[/C][/ROW]
[/TABLE]
Source: https://freestatistics.org/blog/index.php?pk=79343&T=1

Globally Unique Identifier (entire table): ba.freestatistics.org/blog/index.php?pk=79343&T=1

As an alternative you can also use a QR Code:  

The GUIDs for individual cells are displayed in the table below:

Autocorrelation Function
Time lag kACF(k)T-STATP-value
10.95760110.490
20.92354110.11690
30.899369.8520
40.8780169.61820
50.8648889.47440
60.8452079.25880
70.8207718.99110
80.7889848.64290
90.7666958.39870
100.7448378.15930
110.7304858.00210
120.7239097.930
130.68267.47750
140.647787.09610
150.6230646.82530
160.6021346.5960
170.5908556.47250
180.5703336.24770
190.5439655.95880
200.510685.59420
210.4881175.34710
220.4656555.1011e-06
230.4502854.93261e-06
240.4406124.82672e-06
250.4029464.41411.1e-05
260.3709544.06364.3e-05
270.3476853.80870.000111
280.3271243.58350.000246
290.3147353.44770.00039
300.2926653.2060.000863
310.26422.89420.002259
320.2285932.50410.006809
330.2045072.24030.013457
340.1827532.0020.023772
350.1663271.8220.035471
360.1555511.7040.045486
370.1199561.31410.095667
380.0887450.97220.166466
390.0663160.72650.234486
400.0483290.52940.298745
410.0376750.41270.340279
420.0203970.22340.411789
43-0.002738-0.030.488062
44-0.03309-0.36250.358813
45-0.053155-0.58230.280733
46-0.071585-0.78420.217242
47-0.08526-0.9340.176096
48-0.094447-1.03460.151465


Partial Autocorrelation Function
Time lag kPACF(k)T-STATP-value
10.95760110.490
20.0788080.86330.194847
30.1116021.22250.11195
40.0471120.51610.303371
50.1149741.25950.105152
6-0.051025-0.5590.288617
7-0.051959-0.56920.285147
8-0.122169-1.33830.091666
90.0710510.77830.218955
10-0.030172-0.33050.370791
110.0944371.03450.151491
120.1061791.16310.123543
13-0.366168-4.01125.3e-05
140.0153810.16850.433242
150.0567940.62220.267511
160.0250390.27430.392168
170.0800240.87660.191222
18-0.072059-0.78940.215728
19-0.043683-0.47850.316576
20-0.059931-0.65650.256375
210.0315750.34590.365015
22-0.024937-0.27320.392594
230.0457530.50120.308574
240.0147950.16210.435762
25-0.159541-1.74770.041539
260.0020270.02220.491159
270.0213810.23420.407608
28-0.011187-0.12250.451337
290.0215150.23570.407039
30-0.062763-0.68750.246537
31-0.041654-0.45630.3245
32-0.066138-0.72450.235083
330.0142980.15660.437902
340.0045550.04990.480144
350.0112110.12280.45123
360.0170820.18710.425939
37-0.101388-1.11070.134469
38-0.021443-0.23490.407344
390.0172650.18910.425157
400.0097850.10720.457407
410.0095970.10510.458225
42-0.002768-0.03030.48793
43-0.022147-0.24260.40436
44-0.051474-0.56390.286949
45-0.013522-0.14810.441246
46-0.02901-0.31780.375599
470.0065180.07140.471598
48-0.005428-0.05950.476344

\begin{tabular}{lllllllll}
\hline
Partial Autocorrelation Function \tabularnewline
Time lag k & PACF(k) & T-STAT & P-value \tabularnewline
1 & 0.957601 & 10.49 & 0 \tabularnewline
2 & 0.078808 & 0.8633 & 0.194847 \tabularnewline
3 & 0.111602 & 1.2225 & 0.11195 \tabularnewline
4 & 0.047112 & 0.5161 & 0.303371 \tabularnewline
5 & 0.114974 & 1.2595 & 0.105152 \tabularnewline
6 & -0.051025 & -0.559 & 0.288617 \tabularnewline
7 & -0.051959 & -0.5692 & 0.285147 \tabularnewline
8 & -0.122169 & -1.3383 & 0.091666 \tabularnewline
9 & 0.071051 & 0.7783 & 0.218955 \tabularnewline
10 & -0.030172 & -0.3305 & 0.370791 \tabularnewline
11 & 0.094437 & 1.0345 & 0.151491 \tabularnewline
12 & 0.106179 & 1.1631 & 0.123543 \tabularnewline
13 & -0.366168 & -4.0112 & 5.3e-05 \tabularnewline
14 & 0.015381 & 0.1685 & 0.433242 \tabularnewline
15 & 0.056794 & 0.6222 & 0.267511 \tabularnewline
16 & 0.025039 & 0.2743 & 0.392168 \tabularnewline
17 & 0.080024 & 0.8766 & 0.191222 \tabularnewline
18 & -0.072059 & -0.7894 & 0.215728 \tabularnewline
19 & -0.043683 & -0.4785 & 0.316576 \tabularnewline
20 & -0.059931 & -0.6565 & 0.256375 \tabularnewline
21 & 0.031575 & 0.3459 & 0.365015 \tabularnewline
22 & -0.024937 & -0.2732 & 0.392594 \tabularnewline
23 & 0.045753 & 0.5012 & 0.308574 \tabularnewline
24 & 0.014795 & 0.1621 & 0.435762 \tabularnewline
25 & -0.159541 & -1.7477 & 0.041539 \tabularnewline
26 & 0.002027 & 0.0222 & 0.491159 \tabularnewline
27 & 0.021381 & 0.2342 & 0.407608 \tabularnewline
28 & -0.011187 & -0.1225 & 0.451337 \tabularnewline
29 & 0.021515 & 0.2357 & 0.407039 \tabularnewline
30 & -0.062763 & -0.6875 & 0.246537 \tabularnewline
31 & -0.041654 & -0.4563 & 0.3245 \tabularnewline
32 & -0.066138 & -0.7245 & 0.235083 \tabularnewline
33 & 0.014298 & 0.1566 & 0.437902 \tabularnewline
34 & 0.004555 & 0.0499 & 0.480144 \tabularnewline
35 & 0.011211 & 0.1228 & 0.45123 \tabularnewline
36 & 0.017082 & 0.1871 & 0.425939 \tabularnewline
37 & -0.101388 & -1.1107 & 0.134469 \tabularnewline
38 & -0.021443 & -0.2349 & 0.407344 \tabularnewline
39 & 0.017265 & 0.1891 & 0.425157 \tabularnewline
40 & 0.009785 & 0.1072 & 0.457407 \tabularnewline
41 & 0.009597 & 0.1051 & 0.458225 \tabularnewline
42 & -0.002768 & -0.0303 & 0.48793 \tabularnewline
43 & -0.022147 & -0.2426 & 0.40436 \tabularnewline
44 & -0.051474 & -0.5639 & 0.286949 \tabularnewline
45 & -0.013522 & -0.1481 & 0.441246 \tabularnewline
46 & -0.02901 & -0.3178 & 0.375599 \tabularnewline
47 & 0.006518 & 0.0714 & 0.471598 \tabularnewline
48 & -0.005428 & -0.0595 & 0.476344 \tabularnewline
\hline
\end{tabular}
%Source: https://freestatistics.org/blog/index.php?pk=79343&T=2

[TABLE]
[ROW][C]Partial Autocorrelation Function[/C][/ROW]
[ROW][C]Time lag k[/C][C]PACF(k)[/C][C]T-STAT[/C][C]P-value[/C][/ROW]
[ROW][C]1[/C][C]0.957601[/C][C]10.49[/C][C]0[/C][/ROW]
[ROW][C]2[/C][C]0.078808[/C][C]0.8633[/C][C]0.194847[/C][/ROW]
[ROW][C]3[/C][C]0.111602[/C][C]1.2225[/C][C]0.11195[/C][/ROW]
[ROW][C]4[/C][C]0.047112[/C][C]0.5161[/C][C]0.303371[/C][/ROW]
[ROW][C]5[/C][C]0.114974[/C][C]1.2595[/C][C]0.105152[/C][/ROW]
[ROW][C]6[/C][C]-0.051025[/C][C]-0.559[/C][C]0.288617[/C][/ROW]
[ROW][C]7[/C][C]-0.051959[/C][C]-0.5692[/C][C]0.285147[/C][/ROW]
[ROW][C]8[/C][C]-0.122169[/C][C]-1.3383[/C][C]0.091666[/C][/ROW]
[ROW][C]9[/C][C]0.071051[/C][C]0.7783[/C][C]0.218955[/C][/ROW]
[ROW][C]10[/C][C]-0.030172[/C][C]-0.3305[/C][C]0.370791[/C][/ROW]
[ROW][C]11[/C][C]0.094437[/C][C]1.0345[/C][C]0.151491[/C][/ROW]
[ROW][C]12[/C][C]0.106179[/C][C]1.1631[/C][C]0.123543[/C][/ROW]
[ROW][C]13[/C][C]-0.366168[/C][C]-4.0112[/C][C]5.3e-05[/C][/ROW]
[ROW][C]14[/C][C]0.015381[/C][C]0.1685[/C][C]0.433242[/C][/ROW]
[ROW][C]15[/C][C]0.056794[/C][C]0.6222[/C][C]0.267511[/C][/ROW]
[ROW][C]16[/C][C]0.025039[/C][C]0.2743[/C][C]0.392168[/C][/ROW]
[ROW][C]17[/C][C]0.080024[/C][C]0.8766[/C][C]0.191222[/C][/ROW]
[ROW][C]18[/C][C]-0.072059[/C][C]-0.7894[/C][C]0.215728[/C][/ROW]
[ROW][C]19[/C][C]-0.043683[/C][C]-0.4785[/C][C]0.316576[/C][/ROW]
[ROW][C]20[/C][C]-0.059931[/C][C]-0.6565[/C][C]0.256375[/C][/ROW]
[ROW][C]21[/C][C]0.031575[/C][C]0.3459[/C][C]0.365015[/C][/ROW]
[ROW][C]22[/C][C]-0.024937[/C][C]-0.2732[/C][C]0.392594[/C][/ROW]
[ROW][C]23[/C][C]0.045753[/C][C]0.5012[/C][C]0.308574[/C][/ROW]
[ROW][C]24[/C][C]0.014795[/C][C]0.1621[/C][C]0.435762[/C][/ROW]
[ROW][C]25[/C][C]-0.159541[/C][C]-1.7477[/C][C]0.041539[/C][/ROW]
[ROW][C]26[/C][C]0.002027[/C][C]0.0222[/C][C]0.491159[/C][/ROW]
[ROW][C]27[/C][C]0.021381[/C][C]0.2342[/C][C]0.407608[/C][/ROW]
[ROW][C]28[/C][C]-0.011187[/C][C]-0.1225[/C][C]0.451337[/C][/ROW]
[ROW][C]29[/C][C]0.021515[/C][C]0.2357[/C][C]0.407039[/C][/ROW]
[ROW][C]30[/C][C]-0.062763[/C][C]-0.6875[/C][C]0.246537[/C][/ROW]
[ROW][C]31[/C][C]-0.041654[/C][C]-0.4563[/C][C]0.3245[/C][/ROW]
[ROW][C]32[/C][C]-0.066138[/C][C]-0.7245[/C][C]0.235083[/C][/ROW]
[ROW][C]33[/C][C]0.014298[/C][C]0.1566[/C][C]0.437902[/C][/ROW]
[ROW][C]34[/C][C]0.004555[/C][C]0.0499[/C][C]0.480144[/C][/ROW]
[ROW][C]35[/C][C]0.011211[/C][C]0.1228[/C][C]0.45123[/C][/ROW]
[ROW][C]36[/C][C]0.017082[/C][C]0.1871[/C][C]0.425939[/C][/ROW]
[ROW][C]37[/C][C]-0.101388[/C][C]-1.1107[/C][C]0.134469[/C][/ROW]
[ROW][C]38[/C][C]-0.021443[/C][C]-0.2349[/C][C]0.407344[/C][/ROW]
[ROW][C]39[/C][C]0.017265[/C][C]0.1891[/C][C]0.425157[/C][/ROW]
[ROW][C]40[/C][C]0.009785[/C][C]0.1072[/C][C]0.457407[/C][/ROW]
[ROW][C]41[/C][C]0.009597[/C][C]0.1051[/C][C]0.458225[/C][/ROW]
[ROW][C]42[/C][C]-0.002768[/C][C]-0.0303[/C][C]0.48793[/C][/ROW]
[ROW][C]43[/C][C]-0.022147[/C][C]-0.2426[/C][C]0.40436[/C][/ROW]
[ROW][C]44[/C][C]-0.051474[/C][C]-0.5639[/C][C]0.286949[/C][/ROW]
[ROW][C]45[/C][C]-0.013522[/C][C]-0.1481[/C][C]0.441246[/C][/ROW]
[ROW][C]46[/C][C]-0.02901[/C][C]-0.3178[/C][C]0.375599[/C][/ROW]
[ROW][C]47[/C][C]0.006518[/C][C]0.0714[/C][C]0.471598[/C][/ROW]
[ROW][C]48[/C][C]-0.005428[/C][C]-0.0595[/C][C]0.476344[/C][/ROW]
[/TABLE]
Source: https://freestatistics.org/blog/index.php?pk=79343&T=2

Globally Unique Identifier (entire table): ba.freestatistics.org/blog/index.php?pk=79343&T=2

As an alternative you can also use a QR Code:  

The GUIDs for individual cells are displayed in the table below:

Partial Autocorrelation Function
Time lag kPACF(k)T-STATP-value
10.95760110.490
20.0788080.86330.194847
30.1116021.22250.11195
40.0471120.51610.303371
50.1149741.25950.105152
6-0.051025-0.5590.288617
7-0.051959-0.56920.285147
8-0.122169-1.33830.091666
90.0710510.77830.218955
10-0.030172-0.33050.370791
110.0944371.03450.151491
120.1061791.16310.123543
13-0.366168-4.01125.3e-05
140.0153810.16850.433242
150.0567940.62220.267511
160.0250390.27430.392168
170.0800240.87660.191222
18-0.072059-0.78940.215728
19-0.043683-0.47850.316576
20-0.059931-0.65650.256375
210.0315750.34590.365015
22-0.024937-0.27320.392594
230.0457530.50120.308574
240.0147950.16210.435762
25-0.159541-1.74770.041539
260.0020270.02220.491159
270.0213810.23420.407608
28-0.011187-0.12250.451337
290.0215150.23570.407039
30-0.062763-0.68750.246537
31-0.041654-0.45630.3245
32-0.066138-0.72450.235083
330.0142980.15660.437902
340.0045550.04990.480144
350.0112110.12280.45123
360.0170820.18710.425939
37-0.101388-1.11070.134469
38-0.021443-0.23490.407344
390.0172650.18910.425157
400.0097850.10720.457407
410.0095970.10510.458225
42-0.002768-0.03030.48793
43-0.022147-0.24260.40436
44-0.051474-0.56390.286949
45-0.013522-0.14810.441246
46-0.02901-0.31780.375599
470.0065180.07140.471598
48-0.005428-0.05950.476344


Parameters (Session):
par1 = 48 ; par2 = 1 ; par3 = 0 ; par4 = 0 ; par5 = 12 ; par6 = White Noise ; par7 = 0.95 ;
Parameters (R input):
par1 = 48 ; par2 = 1 ; par3 = 0 ; par4 = 0 ; par5 = 12 ; par6 = White Noise ; par7 = 0.95 ;
R code (references can be found in the software module):
if (par1 == 'Default') {
par1 = 10*log10(length(x))
} else {
par1 <- as.numeric(par1)
}
par2 <- as.numeric(par2)
par3 <- as.numeric(par3)
par4 <- as.numeric(par4)
par5 <- as.numeric(par5)
if (par6 == 'White Noise') par6 <- 'white' else par6 <- 'ma'
par7 <- as.numeric(par7)
if (par2 == 0) {
x <- log(x)
} else {
x <- (x ^ par2 - 1) / par2
}
if (par3 > 0) x <- diff(x,lag=1,difference=par3)
if (par4 > 0) x <- diff(x,lag=par5,difference=par4)
bitmap(file='pic1.png')
racf <- acf(x, par1, main='Autocorrelation', xlab='time lag', ylab='ACF', ci.type=par6, ci=par7, sub=paste('(lambda=',par2,', d=',par3,', D=',par4,', CI=', par7, ', CI type=',par6,')',sep=''))
dev.off()
bitmap(file='pic2.png')
rpacf <- pacf(x,par1,main='Partial Autocorrelation',xlab='lags',ylab='PACF')
dev.off()
(myacf <- c(racf$acf))
(mypacf <- c(rpacf$acf))
lengthx <- length(x)
sqrtn <- sqrt(lengthx)
load(file='createtable')
a<-table.start()
a<-table.row.start(a)
a<-table.element(a,'Autocorrelation Function',4,TRUE)
a<-table.row.end(a)
a<-table.row.start(a)
a<-table.element(a,'Time lag k',header=TRUE)
a<-table.element(a,hyperlink('basics.htm','ACF(k)','click here for more information about the Autocorrelation Function'),header=TRUE)
a<-table.element(a,'T-STAT',header=TRUE)
a<-table.element(a,'P-value',header=TRUE)
a<-table.row.end(a)
for (i in 2:(par1+1)) {
a<-table.row.start(a)
a<-table.element(a,i-1,header=TRUE)
a<-table.element(a,round(myacf[i],6))
mytstat <- myacf[i]*sqrtn
a<-table.element(a,round(mytstat,4))
a<-table.element(a,round(1-pt(abs(mytstat),lengthx),6))
a<-table.row.end(a)
}
a<-table.end(a)
table.save(a,file='mytable.tab')
a<-table.start()
a<-table.row.start(a)
a<-table.element(a,'Partial Autocorrelation Function',4,TRUE)
a<-table.row.end(a)
a<-table.row.start(a)
a<-table.element(a,'Time lag k',header=TRUE)
a<-table.element(a,hyperlink('basics.htm','PACF(k)','click here for more information about the Partial Autocorrelation Function'),header=TRUE)
a<-table.element(a,'T-STAT',header=TRUE)
a<-table.element(a,'P-value',header=TRUE)
a<-table.row.end(a)
for (i in 1:par1) {
a<-table.row.start(a)
a<-table.element(a,i,header=TRUE)
a<-table.element(a,round(mypacf[i],6))
mytstat <- mypacf[i]*sqrtn
a<-table.element(a,round(mytstat,4))
a<-table.element(a,round(1-pt(abs(mytstat),lengthx),6))
a<-table.row.end(a)
}
a<-table.end(a)
table.save(a,file='mytable1.tab')