Free Statistics

of Irreproducible Research!

Author's title

Author*Unverified author*
R Software Modulerwasp_autocorrelation.wasp
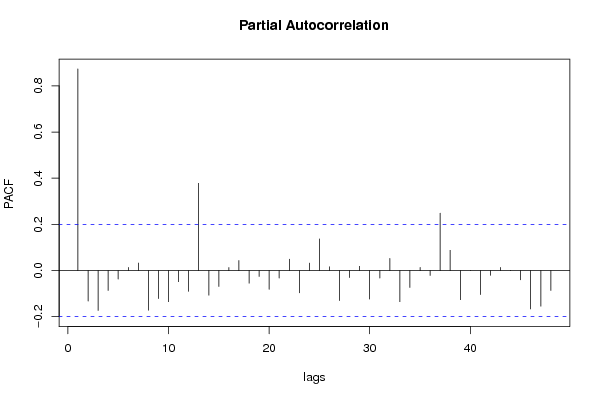
Title produced by software(Partial) Autocorrelation Function
Date of computationThu, 19 Aug 2010 13:56:57 +0000
Cite this page as followsStatistical Computations at FreeStatistics.org, Office for Research Development and Education, URL https://freestatistics.org/blog/index.php?v=date/2010/Aug/19/t1282226203isf941h8kma6t85.htm/, Retrieved Fri, 03 May 2024 14:03:12 +0000
Statistical Computations at FreeStatistics.org, Office for Research Development and Education, URL https://freestatistics.org/blog/index.php?pk=79298, Retrieved Fri, 03 May 2024 14:03:12 +0000
QR Codes:

Original text written by user:
IsPrivate?No (this computation is public)
User-defined keywordsSebastien Delforge
Estimated Impact109
Family? (F = Feedback message, R = changed R code, M = changed R Module, P = changed Parameters, D = changed Data)
-       [(Partial) Autocorrelation Function] [Gediferentierde a...] [2010-08-19 13:56:57] [923770d86edf74ed976a539eae527e37] [Current]
Feedback Forum

Post a new message
Dataseries X:
75
74
73
71
91
90
75
65
66
66
67
69
75
79
75
77
100
100
94
83
83
83
84
88
89
98
94
84
111
98
98
83
79
78
80
94
98
104
94
90
115
104
114
99
96
98
104
111
117
125
117
118
151
145
155
133
124
125
131
133
136
141
130
137
177
183
191
166
156
153
164
164
168
173
164
165
205
207
215
190
169
175
188
188
196
201
194
197
237
236
244
222
195
199
207
204
212
222
214
217
258
256
251
223
198
206
214
212
227
238
228
235
275
278
278
251
225
232
238
239


Summary of computational transaction
Raw Inputview raw input (R code)
Raw Outputview raw output of R engine
Computing time1 seconds
R Server'George Udny Yule' @ 72.249.76.132

\begin{tabular}{lllllllll}
\hline
Summary of computational transaction \tabularnewline
Raw Input & view raw input (R code)  \tabularnewline
Raw Output & view raw output of R engine  \tabularnewline
Computing time & 1 seconds \tabularnewline
R Server & 'George Udny Yule' @ 72.249.76.132 \tabularnewline
\hline
\end{tabular}
%Source: https://freestatistics.org/blog/index.php?pk=79298&T=0

[TABLE]
[ROW][C]Summary of computational transaction[/C][/ROW]
[ROW][C]Raw Input[/C][C]view raw input (R code) [/C][/ROW]
[ROW][C]Raw Output[/C][C]view raw output of R engine [/C][/ROW]
[ROW][C]Computing time[/C][C]1 seconds[/C][/ROW]
[ROW][C]R Server[/C][C]'George Udny Yule' @ 72.249.76.132[/C][/ROW]
[/TABLE]
Source: https://freestatistics.org/blog/index.php?pk=79298&T=0

Globally Unique Identifier (entire table): ba.freestatistics.org/blog/index.php?pk=79298&T=0

As an alternative you can also use a QR Code:  

The GUIDs for individual cells are displayed in the table below:

Summary of computational transaction
Raw Inputview raw input (R code)
Raw Outputview raw output of R engine
Computing time1 seconds
R Server'George Udny Yule' @ 72.249.76.132


Autocorrelation Function
Time lag kACF(k)T-STATP-value
10.8737788.56120
20.7321767.17380
30.568555.57060
40.4072083.98986.5e-05
50.2621032.56810.005884
60.147511.44530.075815
70.0680990.66720.253114
8-0.02342-0.22950.409495
9-0.114694-1.12380.131957
10-0.214803-2.10460.018968
11-0.302229-2.96120.001931
12-0.384352-3.76590.000143
13-0.35407-3.46920.000392
14-0.318615-3.12180.001188
15-0.267806-2.6240.005056
16-0.201633-1.97560.025536
17-0.133011-1.30320.097806
18-0.086198-0.84460.200226
19-0.070318-0.6890.246252
20-0.054357-0.53260.297776
21-0.043526-0.42650.335361
22-0.014822-0.14520.442419
23-0.004134-0.04050.483887
240.0257980.25280.400495
250.0403160.3950.346854
260.0645420.63240.264322
270.0629940.61720.269278
280.03970.3890.349078
290.0142450.13960.444644
30-0.028687-0.28110.389628
31-0.061802-0.60550.273126
32-0.081752-0.8010.212553
33-0.10455-1.02440.154117
34-0.138822-1.36020.088481
35-0.149293-1.46280.073399
36-0.168345-1.64940.051164
37-0.150685-1.47640.071553
38-0.125397-1.22860.111107
39-0.081879-0.80230.212194
40-0.028625-0.28050.389862
41-0.008333-0.08160.467548
420.0287150.28130.389525
430.0466720.45730.324247
440.0517370.50690.306687
450.0631940.61920.268633
460.0638350.62540.26658
470.0355340.34820.36424
48-0.004436-0.04350.482713

\begin{tabular}{lllllllll}
\hline
Autocorrelation Function \tabularnewline
Time lag k & ACF(k) & T-STAT & P-value \tabularnewline
1 & 0.873778 & 8.5612 & 0 \tabularnewline
2 & 0.732176 & 7.1738 & 0 \tabularnewline
3 & 0.56855 & 5.5706 & 0 \tabularnewline
4 & 0.407208 & 3.9898 & 6.5e-05 \tabularnewline
5 & 0.262103 & 2.5681 & 0.005884 \tabularnewline
6 & 0.14751 & 1.4453 & 0.075815 \tabularnewline
7 & 0.068099 & 0.6672 & 0.253114 \tabularnewline
8 & -0.02342 & -0.2295 & 0.409495 \tabularnewline
9 & -0.114694 & -1.1238 & 0.131957 \tabularnewline
10 & -0.214803 & -2.1046 & 0.018968 \tabularnewline
11 & -0.302229 & -2.9612 & 0.001931 \tabularnewline
12 & -0.384352 & -3.7659 & 0.000143 \tabularnewline
13 & -0.35407 & -3.4692 & 0.000392 \tabularnewline
14 & -0.318615 & -3.1218 & 0.001188 \tabularnewline
15 & -0.267806 & -2.624 & 0.005056 \tabularnewline
16 & -0.201633 & -1.9756 & 0.025536 \tabularnewline
17 & -0.133011 & -1.3032 & 0.097806 \tabularnewline
18 & -0.086198 & -0.8446 & 0.200226 \tabularnewline
19 & -0.070318 & -0.689 & 0.246252 \tabularnewline
20 & -0.054357 & -0.5326 & 0.297776 \tabularnewline
21 & -0.043526 & -0.4265 & 0.335361 \tabularnewline
22 & -0.014822 & -0.1452 & 0.442419 \tabularnewline
23 & -0.004134 & -0.0405 & 0.483887 \tabularnewline
24 & 0.025798 & 0.2528 & 0.400495 \tabularnewline
25 & 0.040316 & 0.395 & 0.346854 \tabularnewline
26 & 0.064542 & 0.6324 & 0.264322 \tabularnewline
27 & 0.062994 & 0.6172 & 0.269278 \tabularnewline
28 & 0.0397 & 0.389 & 0.349078 \tabularnewline
29 & 0.014245 & 0.1396 & 0.444644 \tabularnewline
30 & -0.028687 & -0.2811 & 0.389628 \tabularnewline
31 & -0.061802 & -0.6055 & 0.273126 \tabularnewline
32 & -0.081752 & -0.801 & 0.212553 \tabularnewline
33 & -0.10455 & -1.0244 & 0.154117 \tabularnewline
34 & -0.138822 & -1.3602 & 0.088481 \tabularnewline
35 & -0.149293 & -1.4628 & 0.073399 \tabularnewline
36 & -0.168345 & -1.6494 & 0.051164 \tabularnewline
37 & -0.150685 & -1.4764 & 0.071553 \tabularnewline
38 & -0.125397 & -1.2286 & 0.111107 \tabularnewline
39 & -0.081879 & -0.8023 & 0.212194 \tabularnewline
40 & -0.028625 & -0.2805 & 0.389862 \tabularnewline
41 & -0.008333 & -0.0816 & 0.467548 \tabularnewline
42 & 0.028715 & 0.2813 & 0.389525 \tabularnewline
43 & 0.046672 & 0.4573 & 0.324247 \tabularnewline
44 & 0.051737 & 0.5069 & 0.306687 \tabularnewline
45 & 0.063194 & 0.6192 & 0.268633 \tabularnewline
46 & 0.063835 & 0.6254 & 0.26658 \tabularnewline
47 & 0.035534 & 0.3482 & 0.36424 \tabularnewline
48 & -0.004436 & -0.0435 & 0.482713 \tabularnewline
\hline
\end{tabular}
%Source: https://freestatistics.org/blog/index.php?pk=79298&T=1

[TABLE]
[ROW][C]Autocorrelation Function[/C][/ROW]
[ROW][C]Time lag k[/C][C]ACF(k)[/C][C]T-STAT[/C][C]P-value[/C][/ROW]
[ROW][C]1[/C][C]0.873778[/C][C]8.5612[/C][C]0[/C][/ROW]
[ROW][C]2[/C][C]0.732176[/C][C]7.1738[/C][C]0[/C][/ROW]
[ROW][C]3[/C][C]0.56855[/C][C]5.5706[/C][C]0[/C][/ROW]
[ROW][C]4[/C][C]0.407208[/C][C]3.9898[/C][C]6.5e-05[/C][/ROW]
[ROW][C]5[/C][C]0.262103[/C][C]2.5681[/C][C]0.005884[/C][/ROW]
[ROW][C]6[/C][C]0.14751[/C][C]1.4453[/C][C]0.075815[/C][/ROW]
[ROW][C]7[/C][C]0.068099[/C][C]0.6672[/C][C]0.253114[/C][/ROW]
[ROW][C]8[/C][C]-0.02342[/C][C]-0.2295[/C][C]0.409495[/C][/ROW]
[ROW][C]9[/C][C]-0.114694[/C][C]-1.1238[/C][C]0.131957[/C][/ROW]
[ROW][C]10[/C][C]-0.214803[/C][C]-2.1046[/C][C]0.018968[/C][/ROW]
[ROW][C]11[/C][C]-0.302229[/C][C]-2.9612[/C][C]0.001931[/C][/ROW]
[ROW][C]12[/C][C]-0.384352[/C][C]-3.7659[/C][C]0.000143[/C][/ROW]
[ROW][C]13[/C][C]-0.35407[/C][C]-3.4692[/C][C]0.000392[/C][/ROW]
[ROW][C]14[/C][C]-0.318615[/C][C]-3.1218[/C][C]0.001188[/C][/ROW]
[ROW][C]15[/C][C]-0.267806[/C][C]-2.624[/C][C]0.005056[/C][/ROW]
[ROW][C]16[/C][C]-0.201633[/C][C]-1.9756[/C][C]0.025536[/C][/ROW]
[ROW][C]17[/C][C]-0.133011[/C][C]-1.3032[/C][C]0.097806[/C][/ROW]
[ROW][C]18[/C][C]-0.086198[/C][C]-0.8446[/C][C]0.200226[/C][/ROW]
[ROW][C]19[/C][C]-0.070318[/C][C]-0.689[/C][C]0.246252[/C][/ROW]
[ROW][C]20[/C][C]-0.054357[/C][C]-0.5326[/C][C]0.297776[/C][/ROW]
[ROW][C]21[/C][C]-0.043526[/C][C]-0.4265[/C][C]0.335361[/C][/ROW]
[ROW][C]22[/C][C]-0.014822[/C][C]-0.1452[/C][C]0.442419[/C][/ROW]
[ROW][C]23[/C][C]-0.004134[/C][C]-0.0405[/C][C]0.483887[/C][/ROW]
[ROW][C]24[/C][C]0.025798[/C][C]0.2528[/C][C]0.400495[/C][/ROW]
[ROW][C]25[/C][C]0.040316[/C][C]0.395[/C][C]0.346854[/C][/ROW]
[ROW][C]26[/C][C]0.064542[/C][C]0.6324[/C][C]0.264322[/C][/ROW]
[ROW][C]27[/C][C]0.062994[/C][C]0.6172[/C][C]0.269278[/C][/ROW]
[ROW][C]28[/C][C]0.0397[/C][C]0.389[/C][C]0.349078[/C][/ROW]
[ROW][C]29[/C][C]0.014245[/C][C]0.1396[/C][C]0.444644[/C][/ROW]
[ROW][C]30[/C][C]-0.028687[/C][C]-0.2811[/C][C]0.389628[/C][/ROW]
[ROW][C]31[/C][C]-0.061802[/C][C]-0.6055[/C][C]0.273126[/C][/ROW]
[ROW][C]32[/C][C]-0.081752[/C][C]-0.801[/C][C]0.212553[/C][/ROW]
[ROW][C]33[/C][C]-0.10455[/C][C]-1.0244[/C][C]0.154117[/C][/ROW]
[ROW][C]34[/C][C]-0.138822[/C][C]-1.3602[/C][C]0.088481[/C][/ROW]
[ROW][C]35[/C][C]-0.149293[/C][C]-1.4628[/C][C]0.073399[/C][/ROW]
[ROW][C]36[/C][C]-0.168345[/C][C]-1.6494[/C][C]0.051164[/C][/ROW]
[ROW][C]37[/C][C]-0.150685[/C][C]-1.4764[/C][C]0.071553[/C][/ROW]
[ROW][C]38[/C][C]-0.125397[/C][C]-1.2286[/C][C]0.111107[/C][/ROW]
[ROW][C]39[/C][C]-0.081879[/C][C]-0.8023[/C][C]0.212194[/C][/ROW]
[ROW][C]40[/C][C]-0.028625[/C][C]-0.2805[/C][C]0.389862[/C][/ROW]
[ROW][C]41[/C][C]-0.008333[/C][C]-0.0816[/C][C]0.467548[/C][/ROW]
[ROW][C]42[/C][C]0.028715[/C][C]0.2813[/C][C]0.389525[/C][/ROW]
[ROW][C]43[/C][C]0.046672[/C][C]0.4573[/C][C]0.324247[/C][/ROW]
[ROW][C]44[/C][C]0.051737[/C][C]0.5069[/C][C]0.306687[/C][/ROW]
[ROW][C]45[/C][C]0.063194[/C][C]0.6192[/C][C]0.268633[/C][/ROW]
[ROW][C]46[/C][C]0.063835[/C][C]0.6254[/C][C]0.26658[/C][/ROW]
[ROW][C]47[/C][C]0.035534[/C][C]0.3482[/C][C]0.36424[/C][/ROW]
[ROW][C]48[/C][C]-0.004436[/C][C]-0.0435[/C][C]0.482713[/C][/ROW]
[/TABLE]
Source: https://freestatistics.org/blog/index.php?pk=79298&T=1

Globally Unique Identifier (entire table): ba.freestatistics.org/blog/index.php?pk=79298&T=1

As an alternative you can also use a QR Code:  

The GUIDs for individual cells are displayed in the table below:

Autocorrelation Function
Time lag kACF(k)T-STATP-value
10.8737788.56120
20.7321767.17380
30.568555.57060
40.4072083.98986.5e-05
50.2621032.56810.005884
60.147511.44530.075815
70.0680990.66720.253114
8-0.02342-0.22950.409495
9-0.114694-1.12380.131957
10-0.214803-2.10460.018968
11-0.302229-2.96120.001931
12-0.384352-3.76590.000143
13-0.35407-3.46920.000392
14-0.318615-3.12180.001188
15-0.267806-2.6240.005056
16-0.201633-1.97560.025536
17-0.133011-1.30320.097806
18-0.086198-0.84460.200226
19-0.070318-0.6890.246252
20-0.054357-0.53260.297776
21-0.043526-0.42650.335361
22-0.014822-0.14520.442419
23-0.004134-0.04050.483887
240.0257980.25280.400495
250.0403160.3950.346854
260.0645420.63240.264322
270.0629940.61720.269278
280.03970.3890.349078
290.0142450.13960.444644
30-0.028687-0.28110.389628
31-0.061802-0.60550.273126
32-0.081752-0.8010.212553
33-0.10455-1.02440.154117
34-0.138822-1.36020.088481
35-0.149293-1.46280.073399
36-0.168345-1.64940.051164
37-0.150685-1.47640.071553
38-0.125397-1.22860.111107
39-0.081879-0.80230.212194
40-0.028625-0.28050.389862
41-0.008333-0.08160.467548
420.0287150.28130.389525
430.0466720.45730.324247
440.0517370.50690.306687
450.0631940.61920.268633
460.0638350.62540.26658
470.0355340.34820.36424
48-0.004436-0.04350.482713


Partial Autocorrelation Function
Time lag kPACF(k)T-STATP-value
10.8737788.56120
2-0.132391-1.29720.098843
3-0.173121-1.69620.046541
4-0.086666-0.84910.198956
5-0.036904-0.36160.359227
60.0133470.13080.448113
70.0324280.31770.375692
8-0.172284-1.6880.047326
9-0.121531-1.19080.118343
10-0.135352-1.32620.093964
11-0.048756-0.47770.316971
12-0.090323-0.8850.189189
130.3777953.70160.000179
14-0.106726-1.04570.149163
15-0.069238-0.67840.249577
160.0129010.12640.449838
170.0431260.42250.336786
18-0.054743-0.53640.296472
19-0.02552-0.250.401546
20-0.081618-0.79970.212933
21-0.032977-0.32310.373659
220.0493430.48350.314934
23-0.096837-0.94880.172552
240.0320220.31380.377196
250.1366691.33910.091854
260.015810.15490.438609
27-0.130499-1.27860.102057
28-0.030717-0.3010.382046
290.0181810.17810.429497
30-0.124008-1.2150.113668
31-0.032911-0.32250.373903
320.0522110.51160.305065
33-0.134945-1.32220.094625
34-0.073628-0.72140.236208
350.0132340.12970.44855
36-0.021212-0.20780.417899
370.2485372.43520.008366
380.0876210.85850.196377
39-0.12677-1.24210.108615
40-0.00054-0.00530.497894
41-0.104202-1.0210.154919
42-0.020956-0.20530.418877
430.013390.13120.447949
440.0007310.00720.497151
45-0.040483-0.39660.346253
46-0.166533-1.63170.053011
47-0.154476-1.51360.066712
48-0.086195-0.84450.200235

\begin{tabular}{lllllllll}
\hline
Partial Autocorrelation Function \tabularnewline
Time lag k & PACF(k) & T-STAT & P-value \tabularnewline
1 & 0.873778 & 8.5612 & 0 \tabularnewline
2 & -0.132391 & -1.2972 & 0.098843 \tabularnewline
3 & -0.173121 & -1.6962 & 0.046541 \tabularnewline
4 & -0.086666 & -0.8491 & 0.198956 \tabularnewline
5 & -0.036904 & -0.3616 & 0.359227 \tabularnewline
6 & 0.013347 & 0.1308 & 0.448113 \tabularnewline
7 & 0.032428 & 0.3177 & 0.375692 \tabularnewline
8 & -0.172284 & -1.688 & 0.047326 \tabularnewline
9 & -0.121531 & -1.1908 & 0.118343 \tabularnewline
10 & -0.135352 & -1.3262 & 0.093964 \tabularnewline
11 & -0.048756 & -0.4777 & 0.316971 \tabularnewline
12 & -0.090323 & -0.885 & 0.189189 \tabularnewline
13 & 0.377795 & 3.7016 & 0.000179 \tabularnewline
14 & -0.106726 & -1.0457 & 0.149163 \tabularnewline
15 & -0.069238 & -0.6784 & 0.249577 \tabularnewline
16 & 0.012901 & 0.1264 & 0.449838 \tabularnewline
17 & 0.043126 & 0.4225 & 0.336786 \tabularnewline
18 & -0.054743 & -0.5364 & 0.296472 \tabularnewline
19 & -0.02552 & -0.25 & 0.401546 \tabularnewline
20 & -0.081618 & -0.7997 & 0.212933 \tabularnewline
21 & -0.032977 & -0.3231 & 0.373659 \tabularnewline
22 & 0.049343 & 0.4835 & 0.314934 \tabularnewline
23 & -0.096837 & -0.9488 & 0.172552 \tabularnewline
24 & 0.032022 & 0.3138 & 0.377196 \tabularnewline
25 & 0.136669 & 1.3391 & 0.091854 \tabularnewline
26 & 0.01581 & 0.1549 & 0.438609 \tabularnewline
27 & -0.130499 & -1.2786 & 0.102057 \tabularnewline
28 & -0.030717 & -0.301 & 0.382046 \tabularnewline
29 & 0.018181 & 0.1781 & 0.429497 \tabularnewline
30 & -0.124008 & -1.215 & 0.113668 \tabularnewline
31 & -0.032911 & -0.3225 & 0.373903 \tabularnewline
32 & 0.052211 & 0.5116 & 0.305065 \tabularnewline
33 & -0.134945 & -1.3222 & 0.094625 \tabularnewline
34 & -0.073628 & -0.7214 & 0.236208 \tabularnewline
35 & 0.013234 & 0.1297 & 0.44855 \tabularnewline
36 & -0.021212 & -0.2078 & 0.417899 \tabularnewline
37 & 0.248537 & 2.4352 & 0.008366 \tabularnewline
38 & 0.087621 & 0.8585 & 0.196377 \tabularnewline
39 & -0.12677 & -1.2421 & 0.108615 \tabularnewline
40 & -0.00054 & -0.0053 & 0.497894 \tabularnewline
41 & -0.104202 & -1.021 & 0.154919 \tabularnewline
42 & -0.020956 & -0.2053 & 0.418877 \tabularnewline
43 & 0.01339 & 0.1312 & 0.447949 \tabularnewline
44 & 0.000731 & 0.0072 & 0.497151 \tabularnewline
45 & -0.040483 & -0.3966 & 0.346253 \tabularnewline
46 & -0.166533 & -1.6317 & 0.053011 \tabularnewline
47 & -0.154476 & -1.5136 & 0.066712 \tabularnewline
48 & -0.086195 & -0.8445 & 0.200235 \tabularnewline
\hline
\end{tabular}
%Source: https://freestatistics.org/blog/index.php?pk=79298&T=2

[TABLE]
[ROW][C]Partial Autocorrelation Function[/C][/ROW]
[ROW][C]Time lag k[/C][C]PACF(k)[/C][C]T-STAT[/C][C]P-value[/C][/ROW]
[ROW][C]1[/C][C]0.873778[/C][C]8.5612[/C][C]0[/C][/ROW]
[ROW][C]2[/C][C]-0.132391[/C][C]-1.2972[/C][C]0.098843[/C][/ROW]
[ROW][C]3[/C][C]-0.173121[/C][C]-1.6962[/C][C]0.046541[/C][/ROW]
[ROW][C]4[/C][C]-0.086666[/C][C]-0.8491[/C][C]0.198956[/C][/ROW]
[ROW][C]5[/C][C]-0.036904[/C][C]-0.3616[/C][C]0.359227[/C][/ROW]
[ROW][C]6[/C][C]0.013347[/C][C]0.1308[/C][C]0.448113[/C][/ROW]
[ROW][C]7[/C][C]0.032428[/C][C]0.3177[/C][C]0.375692[/C][/ROW]
[ROW][C]8[/C][C]-0.172284[/C][C]-1.688[/C][C]0.047326[/C][/ROW]
[ROW][C]9[/C][C]-0.121531[/C][C]-1.1908[/C][C]0.118343[/C][/ROW]
[ROW][C]10[/C][C]-0.135352[/C][C]-1.3262[/C][C]0.093964[/C][/ROW]
[ROW][C]11[/C][C]-0.048756[/C][C]-0.4777[/C][C]0.316971[/C][/ROW]
[ROW][C]12[/C][C]-0.090323[/C][C]-0.885[/C][C]0.189189[/C][/ROW]
[ROW][C]13[/C][C]0.377795[/C][C]3.7016[/C][C]0.000179[/C][/ROW]
[ROW][C]14[/C][C]-0.106726[/C][C]-1.0457[/C][C]0.149163[/C][/ROW]
[ROW][C]15[/C][C]-0.069238[/C][C]-0.6784[/C][C]0.249577[/C][/ROW]
[ROW][C]16[/C][C]0.012901[/C][C]0.1264[/C][C]0.449838[/C][/ROW]
[ROW][C]17[/C][C]0.043126[/C][C]0.4225[/C][C]0.336786[/C][/ROW]
[ROW][C]18[/C][C]-0.054743[/C][C]-0.5364[/C][C]0.296472[/C][/ROW]
[ROW][C]19[/C][C]-0.02552[/C][C]-0.25[/C][C]0.401546[/C][/ROW]
[ROW][C]20[/C][C]-0.081618[/C][C]-0.7997[/C][C]0.212933[/C][/ROW]
[ROW][C]21[/C][C]-0.032977[/C][C]-0.3231[/C][C]0.373659[/C][/ROW]
[ROW][C]22[/C][C]0.049343[/C][C]0.4835[/C][C]0.314934[/C][/ROW]
[ROW][C]23[/C][C]-0.096837[/C][C]-0.9488[/C][C]0.172552[/C][/ROW]
[ROW][C]24[/C][C]0.032022[/C][C]0.3138[/C][C]0.377196[/C][/ROW]
[ROW][C]25[/C][C]0.136669[/C][C]1.3391[/C][C]0.091854[/C][/ROW]
[ROW][C]26[/C][C]0.01581[/C][C]0.1549[/C][C]0.438609[/C][/ROW]
[ROW][C]27[/C][C]-0.130499[/C][C]-1.2786[/C][C]0.102057[/C][/ROW]
[ROW][C]28[/C][C]-0.030717[/C][C]-0.301[/C][C]0.382046[/C][/ROW]
[ROW][C]29[/C][C]0.018181[/C][C]0.1781[/C][C]0.429497[/C][/ROW]
[ROW][C]30[/C][C]-0.124008[/C][C]-1.215[/C][C]0.113668[/C][/ROW]
[ROW][C]31[/C][C]-0.032911[/C][C]-0.3225[/C][C]0.373903[/C][/ROW]
[ROW][C]32[/C][C]0.052211[/C][C]0.5116[/C][C]0.305065[/C][/ROW]
[ROW][C]33[/C][C]-0.134945[/C][C]-1.3222[/C][C]0.094625[/C][/ROW]
[ROW][C]34[/C][C]-0.073628[/C][C]-0.7214[/C][C]0.236208[/C][/ROW]
[ROW][C]35[/C][C]0.013234[/C][C]0.1297[/C][C]0.44855[/C][/ROW]
[ROW][C]36[/C][C]-0.021212[/C][C]-0.2078[/C][C]0.417899[/C][/ROW]
[ROW][C]37[/C][C]0.248537[/C][C]2.4352[/C][C]0.008366[/C][/ROW]
[ROW][C]38[/C][C]0.087621[/C][C]0.8585[/C][C]0.196377[/C][/ROW]
[ROW][C]39[/C][C]-0.12677[/C][C]-1.2421[/C][C]0.108615[/C][/ROW]
[ROW][C]40[/C][C]-0.00054[/C][C]-0.0053[/C][C]0.497894[/C][/ROW]
[ROW][C]41[/C][C]-0.104202[/C][C]-1.021[/C][C]0.154919[/C][/ROW]
[ROW][C]42[/C][C]-0.020956[/C][C]-0.2053[/C][C]0.418877[/C][/ROW]
[ROW][C]43[/C][C]0.01339[/C][C]0.1312[/C][C]0.447949[/C][/ROW]
[ROW][C]44[/C][C]0.000731[/C][C]0.0072[/C][C]0.497151[/C][/ROW]
[ROW][C]45[/C][C]-0.040483[/C][C]-0.3966[/C][C]0.346253[/C][/ROW]
[ROW][C]46[/C][C]-0.166533[/C][C]-1.6317[/C][C]0.053011[/C][/ROW]
[ROW][C]47[/C][C]-0.154476[/C][C]-1.5136[/C][C]0.066712[/C][/ROW]
[ROW][C]48[/C][C]-0.086195[/C][C]-0.8445[/C][C]0.200235[/C][/ROW]
[/TABLE]
Source: https://freestatistics.org/blog/index.php?pk=79298&T=2

Globally Unique Identifier (entire table): ba.freestatistics.org/blog/index.php?pk=79298&T=2

As an alternative you can also use a QR Code:  

The GUIDs for individual cells are displayed in the table below:

Partial Autocorrelation Function
Time lag kPACF(k)T-STATP-value
10.8737788.56120
2-0.132391-1.29720.098843
3-0.173121-1.69620.046541
4-0.086666-0.84910.198956
5-0.036904-0.36160.359227
60.0133470.13080.448113
70.0324280.31770.375692
8-0.172284-1.6880.047326
9-0.121531-1.19080.118343
10-0.135352-1.32620.093964
11-0.048756-0.47770.316971
12-0.090323-0.8850.189189
130.3777953.70160.000179
14-0.106726-1.04570.149163
15-0.069238-0.67840.249577
160.0129010.12640.449838
170.0431260.42250.336786
18-0.054743-0.53640.296472
19-0.02552-0.250.401546
20-0.081618-0.79970.212933
21-0.032977-0.32310.373659
220.0493430.48350.314934
23-0.096837-0.94880.172552
240.0320220.31380.377196
250.1366691.33910.091854
260.015810.15490.438609
27-0.130499-1.27860.102057
28-0.030717-0.3010.382046
290.0181810.17810.429497
30-0.124008-1.2150.113668
31-0.032911-0.32250.373903
320.0522110.51160.305065
33-0.134945-1.32220.094625
34-0.073628-0.72140.236208
350.0132340.12970.44855
36-0.021212-0.20780.417899
370.2485372.43520.008366
380.0876210.85850.196377
39-0.12677-1.24210.108615
40-0.00054-0.00530.497894
41-0.104202-1.0210.154919
42-0.020956-0.20530.418877
430.013390.13120.447949
440.0007310.00720.497151
45-0.040483-0.39660.346253
46-0.166533-1.63170.053011
47-0.154476-1.51360.066712
48-0.086195-0.84450.200235


Parameters (Session):
par1 = 48 ; par2 = 1 ; par3 = 0 ; par4 = 2 ; par5 = 12 ; par6 = White Noise ; par7 = 0.95 ;
Parameters (R input):
par1 = 48 ; par2 = 1 ; par3 = 0 ; par4 = 2 ; par5 = 12 ; par6 = White Noise ; par7 = 0.95 ;
R code (references can be found in the software module):
if (par1 == 'Default') {
par1 = 10*log10(length(x))
} else {
par1 <- as.numeric(par1)
}
par2 <- as.numeric(par2)
par3 <- as.numeric(par3)
par4 <- as.numeric(par4)
par5 <- as.numeric(par5)
if (par6 == 'White Noise') par6 <- 'white' else par6 <- 'ma'
par7 <- as.numeric(par7)
if (par2 == 0) {
x <- log(x)
} else {
x <- (x ^ par2 - 1) / par2
}
if (par3 > 0) x <- diff(x,lag=1,difference=par3)
if (par4 > 0) x <- diff(x,lag=par5,difference=par4)
bitmap(file='pic1.png')
racf <- acf(x, par1, main='Autocorrelation', xlab='time lag', ylab='ACF', ci.type=par6, ci=par7, sub=paste('(lambda=',par2,', d=',par3,', D=',par4,', CI=', par7, ', CI type=',par6,')',sep=''))
dev.off()
bitmap(file='pic2.png')
rpacf <- pacf(x,par1,main='Partial Autocorrelation',xlab='lags',ylab='PACF')
dev.off()
(myacf <- c(racf$acf))
(mypacf <- c(rpacf$acf))
lengthx <- length(x)
sqrtn <- sqrt(lengthx)
load(file='createtable')
a<-table.start()
a<-table.row.start(a)
a<-table.element(a,'Autocorrelation Function',4,TRUE)
a<-table.row.end(a)
a<-table.row.start(a)
a<-table.element(a,'Time lag k',header=TRUE)
a<-table.element(a,hyperlink('basics.htm','ACF(k)','click here for more information about the Autocorrelation Function'),header=TRUE)
a<-table.element(a,'T-STAT',header=TRUE)
a<-table.element(a,'P-value',header=TRUE)
a<-table.row.end(a)
for (i in 2:(par1+1)) {
a<-table.row.start(a)
a<-table.element(a,i-1,header=TRUE)
a<-table.element(a,round(myacf[i],6))
mytstat <- myacf[i]*sqrtn
a<-table.element(a,round(mytstat,4))
a<-table.element(a,round(1-pt(abs(mytstat),lengthx),6))
a<-table.row.end(a)
}
a<-table.end(a)
table.save(a,file='mytable.tab')
a<-table.start()
a<-table.row.start(a)
a<-table.element(a,'Partial Autocorrelation Function',4,TRUE)
a<-table.row.end(a)
a<-table.row.start(a)
a<-table.element(a,'Time lag k',header=TRUE)
a<-table.element(a,hyperlink('basics.htm','PACF(k)','click here for more information about the Partial Autocorrelation Function'),header=TRUE)
a<-table.element(a,'T-STAT',header=TRUE)
a<-table.element(a,'P-value',header=TRUE)
a<-table.row.end(a)
for (i in 1:par1) {
a<-table.row.start(a)
a<-table.element(a,i,header=TRUE)
a<-table.element(a,round(mypacf[i],6))
mytstat <- mypacf[i]*sqrtn
a<-table.element(a,round(mytstat,4))
a<-table.element(a,round(1-pt(abs(mytstat),lengthx),6))
a<-table.row.end(a)
}
a<-table.end(a)
table.save(a,file='mytable1.tab')