Free Statistics

of Irreproducible Research!

Author's title

Author*Unverified author*
R Software Modulerwasp_autocorrelation.wasp
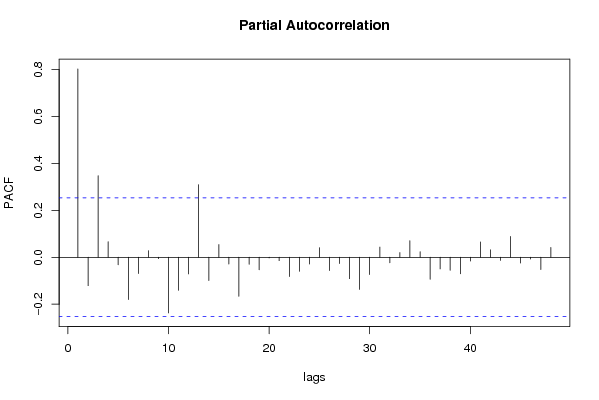
Title produced by software(Partial) Autocorrelation Function
Date of computationThu, 19 Aug 2010 09:12:15 +0000
Cite this page as followsStatistical Computations at FreeStatistics.org, Office for Research Development and Education, URL https://freestatistics.org/blog/index.php?v=date/2010/Aug/19/t1282209182hdmq41usbsa42af.htm/, Retrieved Fri, 03 May 2024 12:29:27 +0000
Statistical Computations at FreeStatistics.org, Office for Research Development and Education, URL https://freestatistics.org/blog/index.php?pk=79249, Retrieved Fri, 03 May 2024 12:29:27 +0000
QR Codes:

Original text written by user:
IsPrivate?No (this computation is public)
User-defined keywordsDeGroodtOlivierREEKSBStap18
Estimated Impact145
Family? (F = Feedback message, R = changed R code, M = changed R Module, P = changed Parameters, D = changed Data)
-       [(Partial) Autocorrelation Function] [] [2010-08-19 09:12:15] [461523bf9c5715e033e9a40193969321] [Current]
Feedback Forum

Post a new message
Dataseries X:
80
79
78
76
74
73
74
76
77
77
78
80
90
90
89
82
78
76
74
78
81
82
88
99
117
113
106
100
97
96
100
104
104
111
117
118
140
147
134
126
116
114
120
122
117
119
132
134
154
152
132
130
123
129
124
128
128
129
141
138
155
160
142
133
131
140
134
134
134
136
145
137
152
168
160
157
147
161
159
164
163
158
175
163


Summary of computational transaction
Raw Inputview raw input (R code)
Raw Outputview raw output of R engine
Computing time5 seconds
R Server'Sir Ronald Aylmer Fisher' @ 193.190.124.24

\begin{tabular}{lllllllll}
\hline
Summary of computational transaction \tabularnewline
Raw Input & view raw input (R code)  \tabularnewline
Raw Output & view raw output of R engine  \tabularnewline
Computing time & 5 seconds \tabularnewline
R Server & 'Sir Ronald Aylmer Fisher' @ 193.190.124.24 \tabularnewline
\hline
\end{tabular}
%Source: https://freestatistics.org/blog/index.php?pk=79249&T=0

[TABLE]
[ROW][C]Summary of computational transaction[/C][/ROW]
[ROW][C]Raw Input[/C][C]view raw input (R code) [/C][/ROW]
[ROW][C]Raw Output[/C][C]view raw output of R engine [/C][/ROW]
[ROW][C]Computing time[/C][C]5 seconds[/C][/ROW]
[ROW][C]R Server[/C][C]'Sir Ronald Aylmer Fisher' @ 193.190.124.24[/C][/ROW]
[/TABLE]
Source: https://freestatistics.org/blog/index.php?pk=79249&T=0

Globally Unique Identifier (entire table): ba.freestatistics.org/blog/index.php?pk=79249&T=0

As an alternative you can also use a QR Code:  

The GUIDs for individual cells are displayed in the table below:

Summary of computational transaction
Raw Inputview raw input (R code)
Raw Outputview raw output of R engine
Computing time5 seconds
R Server'Sir Ronald Aylmer Fisher' @ 193.190.124.24


Autocorrelation Function
Time lag kACF(k)T-STATP-value
10.8027376.2180
20.6014034.65849e-06
30.5658034.38272.4e-05
40.5714834.42672.1e-05
50.5108433.9570.000102
60.3748472.90360.002578
70.2622532.03140.023325
80.2331811.80620.037951
90.2180661.68910.048193
100.0942580.73010.23408
11-0.066795-0.51740.303392
12-0.147004-1.13870.12968
13-0.071401-0.55310.291135
14-0.055246-0.42790.335116
15-0.138635-1.07390.143591
16-0.195957-1.51790.067149
17-0.22156-1.71620.045643
18-0.212783-1.64820.052268
19-0.228172-1.76740.041122
20-0.275712-2.13570.018399
21-0.296519-2.29680.012567
22-0.261801-2.02790.023509
23-0.247255-1.91520.030117
24-0.275618-2.13490.01843
25-0.312229-2.41850.009318
26-0.31682-2.45410.008522
27-0.289448-2.24210.014333
28-0.293476-2.27330.013302
29-0.318077-2.46380.008315
30-0.339961-2.63330.005369
31-0.314997-2.440.00883
32-0.282375-2.18730.016316
33-0.278624-2.15820.017462
34-0.256092-1.98370.025936
35-0.202597-1.56930.060917
36-0.170144-1.31790.096268
37-0.165315-1.28050.102644
38-0.153016-1.18530.120294
39-0.137747-1.0670.145127
40-0.093466-0.7240.235943
41-0.026562-0.20570.418842
420.0193340.14980.440729
430.0299250.23180.408741
440.0700150.54230.294798
450.1151230.89170.188048
460.1192080.92340.179753
470.1175570.91060.183076
480.1632531.26460.105461

\begin{tabular}{lllllllll}
\hline
Autocorrelation Function \tabularnewline
Time lag k & ACF(k) & T-STAT & P-value \tabularnewline
1 & 0.802737 & 6.218 & 0 \tabularnewline
2 & 0.601403 & 4.6584 & 9e-06 \tabularnewline
3 & 0.565803 & 4.3827 & 2.4e-05 \tabularnewline
4 & 0.571483 & 4.4267 & 2.1e-05 \tabularnewline
5 & 0.510843 & 3.957 & 0.000102 \tabularnewline
6 & 0.374847 & 2.9036 & 0.002578 \tabularnewline
7 & 0.262253 & 2.0314 & 0.023325 \tabularnewline
8 & 0.233181 & 1.8062 & 0.037951 \tabularnewline
9 & 0.218066 & 1.6891 & 0.048193 \tabularnewline
10 & 0.094258 & 0.7301 & 0.23408 \tabularnewline
11 & -0.066795 & -0.5174 & 0.303392 \tabularnewline
12 & -0.147004 & -1.1387 & 0.12968 \tabularnewline
13 & -0.071401 & -0.5531 & 0.291135 \tabularnewline
14 & -0.055246 & -0.4279 & 0.335116 \tabularnewline
15 & -0.138635 & -1.0739 & 0.143591 \tabularnewline
16 & -0.195957 & -1.5179 & 0.067149 \tabularnewline
17 & -0.22156 & -1.7162 & 0.045643 \tabularnewline
18 & -0.212783 & -1.6482 & 0.052268 \tabularnewline
19 & -0.228172 & -1.7674 & 0.041122 \tabularnewline
20 & -0.275712 & -2.1357 & 0.018399 \tabularnewline
21 & -0.296519 & -2.2968 & 0.012567 \tabularnewline
22 & -0.261801 & -2.0279 & 0.023509 \tabularnewline
23 & -0.247255 & -1.9152 & 0.030117 \tabularnewline
24 & -0.275618 & -2.1349 & 0.01843 \tabularnewline
25 & -0.312229 & -2.4185 & 0.009318 \tabularnewline
26 & -0.31682 & -2.4541 & 0.008522 \tabularnewline
27 & -0.289448 & -2.2421 & 0.014333 \tabularnewline
28 & -0.293476 & -2.2733 & 0.013302 \tabularnewline
29 & -0.318077 & -2.4638 & 0.008315 \tabularnewline
30 & -0.339961 & -2.6333 & 0.005369 \tabularnewline
31 & -0.314997 & -2.44 & 0.00883 \tabularnewline
32 & -0.282375 & -2.1873 & 0.016316 \tabularnewline
33 & -0.278624 & -2.1582 & 0.017462 \tabularnewline
34 & -0.256092 & -1.9837 & 0.025936 \tabularnewline
35 & -0.202597 & -1.5693 & 0.060917 \tabularnewline
36 & -0.170144 & -1.3179 & 0.096268 \tabularnewline
37 & -0.165315 & -1.2805 & 0.102644 \tabularnewline
38 & -0.153016 & -1.1853 & 0.120294 \tabularnewline
39 & -0.137747 & -1.067 & 0.145127 \tabularnewline
40 & -0.093466 & -0.724 & 0.235943 \tabularnewline
41 & -0.026562 & -0.2057 & 0.418842 \tabularnewline
42 & 0.019334 & 0.1498 & 0.440729 \tabularnewline
43 & 0.029925 & 0.2318 & 0.408741 \tabularnewline
44 & 0.070015 & 0.5423 & 0.294798 \tabularnewline
45 & 0.115123 & 0.8917 & 0.188048 \tabularnewline
46 & 0.119208 & 0.9234 & 0.179753 \tabularnewline
47 & 0.117557 & 0.9106 & 0.183076 \tabularnewline
48 & 0.163253 & 1.2646 & 0.105461 \tabularnewline
\hline
\end{tabular}
%Source: https://freestatistics.org/blog/index.php?pk=79249&T=1

[TABLE]
[ROW][C]Autocorrelation Function[/C][/ROW]
[ROW][C]Time lag k[/C][C]ACF(k)[/C][C]T-STAT[/C][C]P-value[/C][/ROW]
[ROW][C]1[/C][C]0.802737[/C][C]6.218[/C][C]0[/C][/ROW]
[ROW][C]2[/C][C]0.601403[/C][C]4.6584[/C][C]9e-06[/C][/ROW]
[ROW][C]3[/C][C]0.565803[/C][C]4.3827[/C][C]2.4e-05[/C][/ROW]
[ROW][C]4[/C][C]0.571483[/C][C]4.4267[/C][C]2.1e-05[/C][/ROW]
[ROW][C]5[/C][C]0.510843[/C][C]3.957[/C][C]0.000102[/C][/ROW]
[ROW][C]6[/C][C]0.374847[/C][C]2.9036[/C][C]0.002578[/C][/ROW]
[ROW][C]7[/C][C]0.262253[/C][C]2.0314[/C][C]0.023325[/C][/ROW]
[ROW][C]8[/C][C]0.233181[/C][C]1.8062[/C][C]0.037951[/C][/ROW]
[ROW][C]9[/C][C]0.218066[/C][C]1.6891[/C][C]0.048193[/C][/ROW]
[ROW][C]10[/C][C]0.094258[/C][C]0.7301[/C][C]0.23408[/C][/ROW]
[ROW][C]11[/C][C]-0.066795[/C][C]-0.5174[/C][C]0.303392[/C][/ROW]
[ROW][C]12[/C][C]-0.147004[/C][C]-1.1387[/C][C]0.12968[/C][/ROW]
[ROW][C]13[/C][C]-0.071401[/C][C]-0.5531[/C][C]0.291135[/C][/ROW]
[ROW][C]14[/C][C]-0.055246[/C][C]-0.4279[/C][C]0.335116[/C][/ROW]
[ROW][C]15[/C][C]-0.138635[/C][C]-1.0739[/C][C]0.143591[/C][/ROW]
[ROW][C]16[/C][C]-0.195957[/C][C]-1.5179[/C][C]0.067149[/C][/ROW]
[ROW][C]17[/C][C]-0.22156[/C][C]-1.7162[/C][C]0.045643[/C][/ROW]
[ROW][C]18[/C][C]-0.212783[/C][C]-1.6482[/C][C]0.052268[/C][/ROW]
[ROW][C]19[/C][C]-0.228172[/C][C]-1.7674[/C][C]0.041122[/C][/ROW]
[ROW][C]20[/C][C]-0.275712[/C][C]-2.1357[/C][C]0.018399[/C][/ROW]
[ROW][C]21[/C][C]-0.296519[/C][C]-2.2968[/C][C]0.012567[/C][/ROW]
[ROW][C]22[/C][C]-0.261801[/C][C]-2.0279[/C][C]0.023509[/C][/ROW]
[ROW][C]23[/C][C]-0.247255[/C][C]-1.9152[/C][C]0.030117[/C][/ROW]
[ROW][C]24[/C][C]-0.275618[/C][C]-2.1349[/C][C]0.01843[/C][/ROW]
[ROW][C]25[/C][C]-0.312229[/C][C]-2.4185[/C][C]0.009318[/C][/ROW]
[ROW][C]26[/C][C]-0.31682[/C][C]-2.4541[/C][C]0.008522[/C][/ROW]
[ROW][C]27[/C][C]-0.289448[/C][C]-2.2421[/C][C]0.014333[/C][/ROW]
[ROW][C]28[/C][C]-0.293476[/C][C]-2.2733[/C][C]0.013302[/C][/ROW]
[ROW][C]29[/C][C]-0.318077[/C][C]-2.4638[/C][C]0.008315[/C][/ROW]
[ROW][C]30[/C][C]-0.339961[/C][C]-2.6333[/C][C]0.005369[/C][/ROW]
[ROW][C]31[/C][C]-0.314997[/C][C]-2.44[/C][C]0.00883[/C][/ROW]
[ROW][C]32[/C][C]-0.282375[/C][C]-2.1873[/C][C]0.016316[/C][/ROW]
[ROW][C]33[/C][C]-0.278624[/C][C]-2.1582[/C][C]0.017462[/C][/ROW]
[ROW][C]34[/C][C]-0.256092[/C][C]-1.9837[/C][C]0.025936[/C][/ROW]
[ROW][C]35[/C][C]-0.202597[/C][C]-1.5693[/C][C]0.060917[/C][/ROW]
[ROW][C]36[/C][C]-0.170144[/C][C]-1.3179[/C][C]0.096268[/C][/ROW]
[ROW][C]37[/C][C]-0.165315[/C][C]-1.2805[/C][C]0.102644[/C][/ROW]
[ROW][C]38[/C][C]-0.153016[/C][C]-1.1853[/C][C]0.120294[/C][/ROW]
[ROW][C]39[/C][C]-0.137747[/C][C]-1.067[/C][C]0.145127[/C][/ROW]
[ROW][C]40[/C][C]-0.093466[/C][C]-0.724[/C][C]0.235943[/C][/ROW]
[ROW][C]41[/C][C]-0.026562[/C][C]-0.2057[/C][C]0.418842[/C][/ROW]
[ROW][C]42[/C][C]0.019334[/C][C]0.1498[/C][C]0.440729[/C][/ROW]
[ROW][C]43[/C][C]0.029925[/C][C]0.2318[/C][C]0.408741[/C][/ROW]
[ROW][C]44[/C][C]0.070015[/C][C]0.5423[/C][C]0.294798[/C][/ROW]
[ROW][C]45[/C][C]0.115123[/C][C]0.8917[/C][C]0.188048[/C][/ROW]
[ROW][C]46[/C][C]0.119208[/C][C]0.9234[/C][C]0.179753[/C][/ROW]
[ROW][C]47[/C][C]0.117557[/C][C]0.9106[/C][C]0.183076[/C][/ROW]
[ROW][C]48[/C][C]0.163253[/C][C]1.2646[/C][C]0.105461[/C][/ROW]
[/TABLE]
Source: https://freestatistics.org/blog/index.php?pk=79249&T=1

Globally Unique Identifier (entire table): ba.freestatistics.org/blog/index.php?pk=79249&T=1

As an alternative you can also use a QR Code:  

The GUIDs for individual cells are displayed in the table below:

Autocorrelation Function
Time lag kACF(k)T-STATP-value
10.8027376.2180
20.6014034.65849e-06
30.5658034.38272.4e-05
40.5714834.42672.1e-05
50.5108433.9570.000102
60.3748472.90360.002578
70.2622532.03140.023325
80.2331811.80620.037951
90.2180661.68910.048193
100.0942580.73010.23408
11-0.066795-0.51740.303392
12-0.147004-1.13870.12968
13-0.071401-0.55310.291135
14-0.055246-0.42790.335116
15-0.138635-1.07390.143591
16-0.195957-1.51790.067149
17-0.22156-1.71620.045643
18-0.212783-1.64820.052268
19-0.228172-1.76740.041122
20-0.275712-2.13570.018399
21-0.296519-2.29680.012567
22-0.261801-2.02790.023509
23-0.247255-1.91520.030117
24-0.275618-2.13490.01843
25-0.312229-2.41850.009318
26-0.31682-2.45410.008522
27-0.289448-2.24210.014333
28-0.293476-2.27330.013302
29-0.318077-2.46380.008315
30-0.339961-2.63330.005369
31-0.314997-2.440.00883
32-0.282375-2.18730.016316
33-0.278624-2.15820.017462
34-0.256092-1.98370.025936
35-0.202597-1.56930.060917
36-0.170144-1.31790.096268
37-0.165315-1.28050.102644
38-0.153016-1.18530.120294
39-0.137747-1.0670.145127
40-0.093466-0.7240.235943
41-0.026562-0.20570.418842
420.0193340.14980.440729
430.0299250.23180.408741
440.0700150.54230.294798
450.1151230.89170.188048
460.1192080.92340.179753
470.1175570.91060.183076
480.1632531.26460.105461


Partial Autocorrelation Function
Time lag kPACF(k)T-STATP-value
10.8027376.2180
2-0.120873-0.93630.176442
30.347332.69040.004615
40.0664160.51450.304412
5-0.032025-0.24810.402465
6-0.180299-1.39660.083841
7-0.069562-0.53880.296
80.0281150.21780.41417
9-0.00571-0.04420.482433
10-0.237066-1.83630.035634
11-0.140842-1.0910.139826
12-0.070908-0.54920.292436
130.3090742.39410.009902
14-0.099449-0.77030.222065
150.0539710.41810.338699
16-0.028395-0.21990.413329
17-0.166212-1.28750.101437
18-0.029969-0.23210.408609
19-0.053552-0.41480.339878
20-0.002706-0.0210.491673
21-0.014445-0.11190.455643
22-0.082016-0.63530.263826
23-0.059877-0.46380.322234
24-0.029052-0.2250.411357
250.0407510.31570.37668
26-0.056209-0.43540.332419
27-0.026492-0.20520.419052
28-0.091116-0.70580.241528
29-0.136912-1.06050.146581
30-0.073534-0.56960.285539
310.0435220.33710.368603
32-0.023727-0.18380.4274
330.0199040.15420.438995
340.0708190.54860.29267
350.0239810.18580.42663
36-0.094027-0.72830.234623
37-0.049536-0.38370.351278
38-0.05509-0.42670.335552
39-0.07019-0.54370.294334
40-0.01562-0.1210.452051
410.0653730.50640.307223
420.0318310.24660.403043
43-0.013331-0.10330.459051
440.0885190.68570.247782
45-0.024712-0.19140.424423
46-0.007072-0.05480.478249
47-0.052075-0.40340.344054
480.0421390.32640.372627

\begin{tabular}{lllllllll}
\hline
Partial Autocorrelation Function \tabularnewline
Time lag k & PACF(k) & T-STAT & P-value \tabularnewline
1 & 0.802737 & 6.218 & 0 \tabularnewline
2 & -0.120873 & -0.9363 & 0.176442 \tabularnewline
3 & 0.34733 & 2.6904 & 0.004615 \tabularnewline
4 & 0.066416 & 0.5145 & 0.304412 \tabularnewline
5 & -0.032025 & -0.2481 & 0.402465 \tabularnewline
6 & -0.180299 & -1.3966 & 0.083841 \tabularnewline
7 & -0.069562 & -0.5388 & 0.296 \tabularnewline
8 & 0.028115 & 0.2178 & 0.41417 \tabularnewline
9 & -0.00571 & -0.0442 & 0.482433 \tabularnewline
10 & -0.237066 & -1.8363 & 0.035634 \tabularnewline
11 & -0.140842 & -1.091 & 0.139826 \tabularnewline
12 & -0.070908 & -0.5492 & 0.292436 \tabularnewline
13 & 0.309074 & 2.3941 & 0.009902 \tabularnewline
14 & -0.099449 & -0.7703 & 0.222065 \tabularnewline
15 & 0.053971 & 0.4181 & 0.338699 \tabularnewline
16 & -0.028395 & -0.2199 & 0.413329 \tabularnewline
17 & -0.166212 & -1.2875 & 0.101437 \tabularnewline
18 & -0.029969 & -0.2321 & 0.408609 \tabularnewline
19 & -0.053552 & -0.4148 & 0.339878 \tabularnewline
20 & -0.002706 & -0.021 & 0.491673 \tabularnewline
21 & -0.014445 & -0.1119 & 0.455643 \tabularnewline
22 & -0.082016 & -0.6353 & 0.263826 \tabularnewline
23 & -0.059877 & -0.4638 & 0.322234 \tabularnewline
24 & -0.029052 & -0.225 & 0.411357 \tabularnewline
25 & 0.040751 & 0.3157 & 0.37668 \tabularnewline
26 & -0.056209 & -0.4354 & 0.332419 \tabularnewline
27 & -0.026492 & -0.2052 & 0.419052 \tabularnewline
28 & -0.091116 & -0.7058 & 0.241528 \tabularnewline
29 & -0.136912 & -1.0605 & 0.146581 \tabularnewline
30 & -0.073534 & -0.5696 & 0.285539 \tabularnewline
31 & 0.043522 & 0.3371 & 0.368603 \tabularnewline
32 & -0.023727 & -0.1838 & 0.4274 \tabularnewline
33 & 0.019904 & 0.1542 & 0.438995 \tabularnewline
34 & 0.070819 & 0.5486 & 0.29267 \tabularnewline
35 & 0.023981 & 0.1858 & 0.42663 \tabularnewline
36 & -0.094027 & -0.7283 & 0.234623 \tabularnewline
37 & -0.049536 & -0.3837 & 0.351278 \tabularnewline
38 & -0.05509 & -0.4267 & 0.335552 \tabularnewline
39 & -0.07019 & -0.5437 & 0.294334 \tabularnewline
40 & -0.01562 & -0.121 & 0.452051 \tabularnewline
41 & 0.065373 & 0.5064 & 0.307223 \tabularnewline
42 & 0.031831 & 0.2466 & 0.403043 \tabularnewline
43 & -0.013331 & -0.1033 & 0.459051 \tabularnewline
44 & 0.088519 & 0.6857 & 0.247782 \tabularnewline
45 & -0.024712 & -0.1914 & 0.424423 \tabularnewline
46 & -0.007072 & -0.0548 & 0.478249 \tabularnewline
47 & -0.052075 & -0.4034 & 0.344054 \tabularnewline
48 & 0.042139 & 0.3264 & 0.372627 \tabularnewline
\hline
\end{tabular}
%Source: https://freestatistics.org/blog/index.php?pk=79249&T=2

[TABLE]
[ROW][C]Partial Autocorrelation Function[/C][/ROW]
[ROW][C]Time lag k[/C][C]PACF(k)[/C][C]T-STAT[/C][C]P-value[/C][/ROW]
[ROW][C]1[/C][C]0.802737[/C][C]6.218[/C][C]0[/C][/ROW]
[ROW][C]2[/C][C]-0.120873[/C][C]-0.9363[/C][C]0.176442[/C][/ROW]
[ROW][C]3[/C][C]0.34733[/C][C]2.6904[/C][C]0.004615[/C][/ROW]
[ROW][C]4[/C][C]0.066416[/C][C]0.5145[/C][C]0.304412[/C][/ROW]
[ROW][C]5[/C][C]-0.032025[/C][C]-0.2481[/C][C]0.402465[/C][/ROW]
[ROW][C]6[/C][C]-0.180299[/C][C]-1.3966[/C][C]0.083841[/C][/ROW]
[ROW][C]7[/C][C]-0.069562[/C][C]-0.5388[/C][C]0.296[/C][/ROW]
[ROW][C]8[/C][C]0.028115[/C][C]0.2178[/C][C]0.41417[/C][/ROW]
[ROW][C]9[/C][C]-0.00571[/C][C]-0.0442[/C][C]0.482433[/C][/ROW]
[ROW][C]10[/C][C]-0.237066[/C][C]-1.8363[/C][C]0.035634[/C][/ROW]
[ROW][C]11[/C][C]-0.140842[/C][C]-1.091[/C][C]0.139826[/C][/ROW]
[ROW][C]12[/C][C]-0.070908[/C][C]-0.5492[/C][C]0.292436[/C][/ROW]
[ROW][C]13[/C][C]0.309074[/C][C]2.3941[/C][C]0.009902[/C][/ROW]
[ROW][C]14[/C][C]-0.099449[/C][C]-0.7703[/C][C]0.222065[/C][/ROW]
[ROW][C]15[/C][C]0.053971[/C][C]0.4181[/C][C]0.338699[/C][/ROW]
[ROW][C]16[/C][C]-0.028395[/C][C]-0.2199[/C][C]0.413329[/C][/ROW]
[ROW][C]17[/C][C]-0.166212[/C][C]-1.2875[/C][C]0.101437[/C][/ROW]
[ROW][C]18[/C][C]-0.029969[/C][C]-0.2321[/C][C]0.408609[/C][/ROW]
[ROW][C]19[/C][C]-0.053552[/C][C]-0.4148[/C][C]0.339878[/C][/ROW]
[ROW][C]20[/C][C]-0.002706[/C][C]-0.021[/C][C]0.491673[/C][/ROW]
[ROW][C]21[/C][C]-0.014445[/C][C]-0.1119[/C][C]0.455643[/C][/ROW]
[ROW][C]22[/C][C]-0.082016[/C][C]-0.6353[/C][C]0.263826[/C][/ROW]
[ROW][C]23[/C][C]-0.059877[/C][C]-0.4638[/C][C]0.322234[/C][/ROW]
[ROW][C]24[/C][C]-0.029052[/C][C]-0.225[/C][C]0.411357[/C][/ROW]
[ROW][C]25[/C][C]0.040751[/C][C]0.3157[/C][C]0.37668[/C][/ROW]
[ROW][C]26[/C][C]-0.056209[/C][C]-0.4354[/C][C]0.332419[/C][/ROW]
[ROW][C]27[/C][C]-0.026492[/C][C]-0.2052[/C][C]0.419052[/C][/ROW]
[ROW][C]28[/C][C]-0.091116[/C][C]-0.7058[/C][C]0.241528[/C][/ROW]
[ROW][C]29[/C][C]-0.136912[/C][C]-1.0605[/C][C]0.146581[/C][/ROW]
[ROW][C]30[/C][C]-0.073534[/C][C]-0.5696[/C][C]0.285539[/C][/ROW]
[ROW][C]31[/C][C]0.043522[/C][C]0.3371[/C][C]0.368603[/C][/ROW]
[ROW][C]32[/C][C]-0.023727[/C][C]-0.1838[/C][C]0.4274[/C][/ROW]
[ROW][C]33[/C][C]0.019904[/C][C]0.1542[/C][C]0.438995[/C][/ROW]
[ROW][C]34[/C][C]0.070819[/C][C]0.5486[/C][C]0.29267[/C][/ROW]
[ROW][C]35[/C][C]0.023981[/C][C]0.1858[/C][C]0.42663[/C][/ROW]
[ROW][C]36[/C][C]-0.094027[/C][C]-0.7283[/C][C]0.234623[/C][/ROW]
[ROW][C]37[/C][C]-0.049536[/C][C]-0.3837[/C][C]0.351278[/C][/ROW]
[ROW][C]38[/C][C]-0.05509[/C][C]-0.4267[/C][C]0.335552[/C][/ROW]
[ROW][C]39[/C][C]-0.07019[/C][C]-0.5437[/C][C]0.294334[/C][/ROW]
[ROW][C]40[/C][C]-0.01562[/C][C]-0.121[/C][C]0.452051[/C][/ROW]
[ROW][C]41[/C][C]0.065373[/C][C]0.5064[/C][C]0.307223[/C][/ROW]
[ROW][C]42[/C][C]0.031831[/C][C]0.2466[/C][C]0.403043[/C][/ROW]
[ROW][C]43[/C][C]-0.013331[/C][C]-0.1033[/C][C]0.459051[/C][/ROW]
[ROW][C]44[/C][C]0.088519[/C][C]0.6857[/C][C]0.247782[/C][/ROW]
[ROW][C]45[/C][C]-0.024712[/C][C]-0.1914[/C][C]0.424423[/C][/ROW]
[ROW][C]46[/C][C]-0.007072[/C][C]-0.0548[/C][C]0.478249[/C][/ROW]
[ROW][C]47[/C][C]-0.052075[/C][C]-0.4034[/C][C]0.344054[/C][/ROW]
[ROW][C]48[/C][C]0.042139[/C][C]0.3264[/C][C]0.372627[/C][/ROW]
[/TABLE]
Source: https://freestatistics.org/blog/index.php?pk=79249&T=2

Globally Unique Identifier (entire table): ba.freestatistics.org/blog/index.php?pk=79249&T=2

As an alternative you can also use a QR Code:  

The GUIDs for individual cells are displayed in the table below:

Partial Autocorrelation Function
Time lag kPACF(k)T-STATP-value
10.8027376.2180
2-0.120873-0.93630.176442
30.347332.69040.004615
40.0664160.51450.304412
5-0.032025-0.24810.402465
6-0.180299-1.39660.083841
7-0.069562-0.53880.296
80.0281150.21780.41417
9-0.00571-0.04420.482433
10-0.237066-1.83630.035634
11-0.140842-1.0910.139826
12-0.070908-0.54920.292436
130.3090742.39410.009902
14-0.099449-0.77030.222065
150.0539710.41810.338699
16-0.028395-0.21990.413329
17-0.166212-1.28750.101437
18-0.029969-0.23210.408609
19-0.053552-0.41480.339878
20-0.002706-0.0210.491673
21-0.014445-0.11190.455643
22-0.082016-0.63530.263826
23-0.059877-0.46380.322234
24-0.029052-0.2250.411357
250.0407510.31570.37668
26-0.056209-0.43540.332419
27-0.026492-0.20520.419052
28-0.091116-0.70580.241528
29-0.136912-1.06050.146581
30-0.073534-0.56960.285539
310.0435220.33710.368603
32-0.023727-0.18380.4274
330.0199040.15420.438995
340.0708190.54860.29267
350.0239810.18580.42663
36-0.094027-0.72830.234623
37-0.049536-0.38370.351278
38-0.05509-0.42670.335552
39-0.07019-0.54370.294334
40-0.01562-0.1210.452051
410.0653730.50640.307223
420.0318310.24660.403043
43-0.013331-0.10330.459051
440.0885190.68570.247782
45-0.024712-0.19140.424423
46-0.007072-0.05480.478249
47-0.052075-0.40340.344054
480.0421390.32640.372627


Parameters (Session):
par1 = 48 ; par2 = 1 ; par3 = 0 ; par4 = 2 ; par5 = 12 ; par6 = White Noise ; par7 = 0.95 ;
Parameters (R input):
par1 = 48 ; par2 = 1 ; par3 = 0 ; par4 = 2 ; par5 = 12 ; par6 = White Noise ; par7 = 0.95 ;
R code (references can be found in the software module):
if (par1 == 'Default') {
par1 = 10*log10(length(x))
} else {
par1 <- as.numeric(par1)
}
par2 <- as.numeric(par2)
par3 <- as.numeric(par3)
par4 <- as.numeric(par4)
par5 <- as.numeric(par5)
if (par6 == 'White Noise') par6 <- 'white' else par6 <- 'ma'
par7 <- as.numeric(par7)
if (par2 == 0) {
x <- log(x)
} else {
x <- (x ^ par2 - 1) / par2
}
if (par3 > 0) x <- diff(x,lag=1,difference=par3)
if (par4 > 0) x <- diff(x,lag=par5,difference=par4)
bitmap(file='pic1.png')
racf <- acf(x, par1, main='Autocorrelation', xlab='time lag', ylab='ACF', ci.type=par6, ci=par7, sub=paste('(lambda=',par2,', d=',par3,', D=',par4,', CI=', par7, ', CI type=',par6,')',sep=''))
dev.off()
bitmap(file='pic2.png')
rpacf <- pacf(x,par1,main='Partial Autocorrelation',xlab='lags',ylab='PACF')
dev.off()
(myacf <- c(racf$acf))
(mypacf <- c(rpacf$acf))
lengthx <- length(x)
sqrtn <- sqrt(lengthx)
load(file='createtable')
a<-table.start()
a<-table.row.start(a)
a<-table.element(a,'Autocorrelation Function',4,TRUE)
a<-table.row.end(a)
a<-table.row.start(a)
a<-table.element(a,'Time lag k',header=TRUE)
a<-table.element(a,hyperlink('basics.htm','ACF(k)','click here for more information about the Autocorrelation Function'),header=TRUE)
a<-table.element(a,'T-STAT',header=TRUE)
a<-table.element(a,'P-value',header=TRUE)
a<-table.row.end(a)
for (i in 2:(par1+1)) {
a<-table.row.start(a)
a<-table.element(a,i-1,header=TRUE)
a<-table.element(a,round(myacf[i],6))
mytstat <- myacf[i]*sqrtn
a<-table.element(a,round(mytstat,4))
a<-table.element(a,round(1-pt(abs(mytstat),lengthx),6))
a<-table.row.end(a)
}
a<-table.end(a)
table.save(a,file='mytable.tab')
a<-table.start()
a<-table.row.start(a)
a<-table.element(a,'Partial Autocorrelation Function',4,TRUE)
a<-table.row.end(a)
a<-table.row.start(a)
a<-table.element(a,'Time lag k',header=TRUE)
a<-table.element(a,hyperlink('basics.htm','PACF(k)','click here for more information about the Partial Autocorrelation Function'),header=TRUE)
a<-table.element(a,'T-STAT',header=TRUE)
a<-table.element(a,'P-value',header=TRUE)
a<-table.row.end(a)
for (i in 1:par1) {
a<-table.row.start(a)
a<-table.element(a,i,header=TRUE)
a<-table.element(a,round(mypacf[i],6))
mytstat <- mypacf[i]*sqrtn
a<-table.element(a,round(mytstat,4))
a<-table.element(a,round(1-pt(abs(mytstat),lengthx),6))
a<-table.row.end(a)
}
a<-table.end(a)
table.save(a,file='mytable1.tab')