Free Statistics

of Irreproducible Research!

Author's title

Author*Unverified author*
R Software Modulerwasp_smp.wasp
Title produced by softwareStandard Deviation-Mean Plot
Date of computationTue, 17 Aug 2010 16:24:17 +0000
Cite this page as followsStatistical Computations at FreeStatistics.org, Office for Research Development and Education, URL https://freestatistics.org/blog/index.php?v=date/2010/Aug/17/t128206221332gbyr0vcw0izcb.htm/, Retrieved Sat, 27 Apr 2024 07:12:11 +0000
Statistical Computations at FreeStatistics.org, Office for Research Development and Education, URL https://freestatistics.org/blog/index.php?pk=79149, Retrieved Sat, 27 Apr 2024 07:12:11 +0000
QR Codes:

Original text written by user:
IsPrivate?No (this computation is public)
User-defined keywordsMagali De Reu
Estimated Impact121
Family? (F = Feedback message, R = changed R code, M = changed R Module, P = changed Parameters, D = changed Data)
-       [Standard Deviation-Mean Plot] [tijdreeks 2 stap 21] [2010-08-17 16:24:17] [07915b1f88a41fb8d82e27c5eaa7bbed] [Current]
Feedback Forum

Post a new message
Dataseries X:
120
119
118
116
114
113
114
116
117
117
118
120
123
125
120
116
111
108
113
112
126
124
124
118
119
122
114
108
104
101
107
104
123
125
134
131
127
124
123
117
112
118
123
124
144
148
152
154
146
132
136
128
120
124
126
121
140
142
142
139
131
117
122
112
98
103
108
102
126
129
126
126
112
99
106
104
90
98
99
91
118
115
119
123


Summary of computational transaction
Raw Inputview raw input (R code)
Raw Outputview raw output of R engine
Computing time2 seconds
R Server'RServer@AstonUniversity' @ vre.aston.ac.uk

\begin{tabular}{lllllllll}
\hline
Summary of computational transaction \tabularnewline
Raw Input & view raw input (R code)  \tabularnewline
Raw Output & view raw output of R engine  \tabularnewline
Computing time & 2 seconds \tabularnewline
R Server & 'RServer@AstonUniversity' @ vre.aston.ac.uk \tabularnewline
\hline
\end{tabular}
%Source: https://freestatistics.org/blog/index.php?pk=79149&T=0

[TABLE]
[ROW][C]Summary of computational transaction[/C][/ROW]
[ROW][C]Raw Input[/C][C]view raw input (R code) [/C][/ROW]
[ROW][C]Raw Output[/C][C]view raw output of R engine [/C][/ROW]
[ROW][C]Computing time[/C][C]2 seconds[/C][/ROW]
[ROW][C]R Server[/C][C]'RServer@AstonUniversity' @ vre.aston.ac.uk[/C][/ROW]
[/TABLE]
Source: https://freestatistics.org/blog/index.php?pk=79149&T=0

Globally Unique Identifier (entire table): ba.freestatistics.org/blog/index.php?pk=79149&T=0

As an alternative you can also use a QR Code:  

The GUIDs for individual cells are displayed in the table below:

Summary of computational transaction
Raw Inputview raw input (R code)
Raw Outputview raw output of R engine
Computing time2 seconds
R Server'RServer@AstonUniversity' @ vre.aston.ac.uk


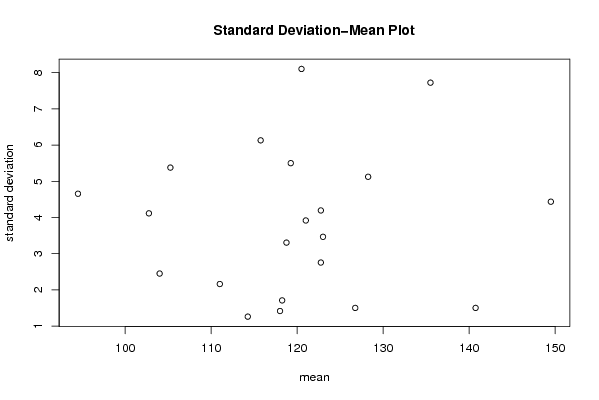
Standard Deviation-Mean Plot
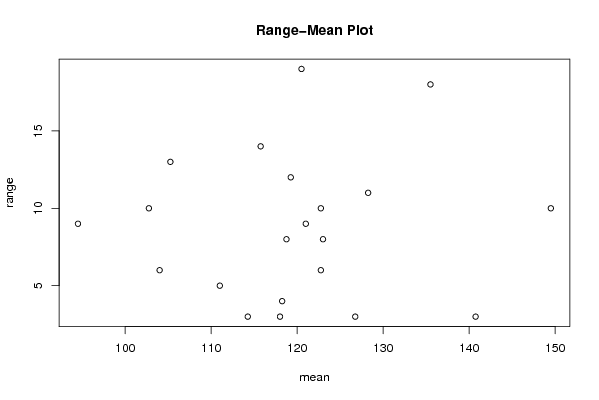
SectionMeanStandard DeviationRange
1118.251.707825127659934
2114.251.258305739211793
31181.41421356237313
41213.915780041490249
51112.160246899469295
61233.464101615137758
7115.756.1305247192498414
81042.449489742783186
9128.255.123475382979811
10122.754.1932485418030410
11119.255.512
12149.54.4347115652166910
13135.57.7244201508376418
14122.752.753785273643056
15140.751.53
16120.58.1034971874288119
17102.754.1129875597510210
18126.751.53
19105.255.3774219349672313
2094.54.654746681256319
21118.753.304037933599838

\begin{tabular}{lllllllll}
\hline
Standard Deviation-Mean Plot \tabularnewline
Section & Mean & Standard Deviation & Range \tabularnewline
1 & 118.25 & 1.70782512765993 & 4 \tabularnewline
2 & 114.25 & 1.25830573921179 & 3 \tabularnewline
3 & 118 & 1.4142135623731 & 3 \tabularnewline
4 & 121 & 3.91578004149024 & 9 \tabularnewline
5 & 111 & 2.16024689946929 & 5 \tabularnewline
6 & 123 & 3.46410161513775 & 8 \tabularnewline
7 & 115.75 & 6.13052471924984 & 14 \tabularnewline
8 & 104 & 2.44948974278318 & 6 \tabularnewline
9 & 128.25 & 5.1234753829798 & 11 \tabularnewline
10 & 122.75 & 4.19324854180304 & 10 \tabularnewline
11 & 119.25 & 5.5 & 12 \tabularnewline
12 & 149.5 & 4.43471156521669 & 10 \tabularnewline
13 & 135.5 & 7.72442015083764 & 18 \tabularnewline
14 & 122.75 & 2.75378527364305 & 6 \tabularnewline
15 & 140.75 & 1.5 & 3 \tabularnewline
16 & 120.5 & 8.10349718742881 & 19 \tabularnewline
17 & 102.75 & 4.11298755975102 & 10 \tabularnewline
18 & 126.75 & 1.5 & 3 \tabularnewline
19 & 105.25 & 5.37742193496723 & 13 \tabularnewline
20 & 94.5 & 4.65474668125631 & 9 \tabularnewline
21 & 118.75 & 3.30403793359983 & 8 \tabularnewline
\hline
\end{tabular}
%Source: https://freestatistics.org/blog/index.php?pk=79149&T=1

[TABLE]
[ROW][C]Standard Deviation-Mean Plot[/C][/ROW]
[ROW][C]Section[/C][C]Mean[/C][C]Standard Deviation[/C][C]Range[/C][/ROW]
[ROW][C]1[/C][C]118.25[/C][C]1.70782512765993[/C][C]4[/C][/ROW]
[ROW][C]2[/C][C]114.25[/C][C]1.25830573921179[/C][C]3[/C][/ROW]
[ROW][C]3[/C][C]118[/C][C]1.4142135623731[/C][C]3[/C][/ROW]
[ROW][C]4[/C][C]121[/C][C]3.91578004149024[/C][C]9[/C][/ROW]
[ROW][C]5[/C][C]111[/C][C]2.16024689946929[/C][C]5[/C][/ROW]
[ROW][C]6[/C][C]123[/C][C]3.46410161513775[/C][C]8[/C][/ROW]
[ROW][C]7[/C][C]115.75[/C][C]6.13052471924984[/C][C]14[/C][/ROW]
[ROW][C]8[/C][C]104[/C][C]2.44948974278318[/C][C]6[/C][/ROW]
[ROW][C]9[/C][C]128.25[/C][C]5.1234753829798[/C][C]11[/C][/ROW]
[ROW][C]10[/C][C]122.75[/C][C]4.19324854180304[/C][C]10[/C][/ROW]
[ROW][C]11[/C][C]119.25[/C][C]5.5[/C][C]12[/C][/ROW]
[ROW][C]12[/C][C]149.5[/C][C]4.43471156521669[/C][C]10[/C][/ROW]
[ROW][C]13[/C][C]135.5[/C][C]7.72442015083764[/C][C]18[/C][/ROW]
[ROW][C]14[/C][C]122.75[/C][C]2.75378527364305[/C][C]6[/C][/ROW]
[ROW][C]15[/C][C]140.75[/C][C]1.5[/C][C]3[/C][/ROW]
[ROW][C]16[/C][C]120.5[/C][C]8.10349718742881[/C][C]19[/C][/ROW]
[ROW][C]17[/C][C]102.75[/C][C]4.11298755975102[/C][C]10[/C][/ROW]
[ROW][C]18[/C][C]126.75[/C][C]1.5[/C][C]3[/C][/ROW]
[ROW][C]19[/C][C]105.25[/C][C]5.37742193496723[/C][C]13[/C][/ROW]
[ROW][C]20[/C][C]94.5[/C][C]4.65474668125631[/C][C]9[/C][/ROW]
[ROW][C]21[/C][C]118.75[/C][C]3.30403793359983[/C][C]8[/C][/ROW]
[/TABLE]
Source: https://freestatistics.org/blog/index.php?pk=79149&T=1

Globally Unique Identifier (entire table): ba.freestatistics.org/blog/index.php?pk=79149&T=1

As an alternative you can also use a QR Code:  

The GUIDs for individual cells are displayed in the table below:

Standard Deviation-Mean Plot
SectionMeanStandard DeviationRange
1118.251.707825127659934
2114.251.258305739211793
31181.41421356237313
41213.915780041490249
51112.160246899469295
61233.464101615137758
7115.756.1305247192498414
81042.449489742783186
9128.255.123475382979811
10122.754.1932485418030410
11119.255.512
12149.54.4347115652166910
13135.57.7244201508376418
14122.752.753785273643056
15140.751.53
16120.58.1034971874288119
17102.754.1129875597510210
18126.751.53
19105.255.3774219349672313
2094.54.654746681256319
21118.753.304037933599838


Regression: S.E.(k) = alpha + beta * Mean(k)
alpha2.90784325883232
beta0.00784800446701681
S.D.0.0362087975286237
T-STAT0.21674302939259
p-value0.830718879965459

\begin{tabular}{lllllllll}
\hline
Regression: S.E.(k) = alpha + beta * Mean(k) \tabularnewline
alpha & 2.90784325883232 \tabularnewline
beta & 0.00784800446701681 \tabularnewline
S.D. & 0.0362087975286237 \tabularnewline
T-STAT & 0.21674302939259 \tabularnewline
p-value & 0.830718879965459 \tabularnewline
\hline
\end{tabular}
%Source: https://freestatistics.org/blog/index.php?pk=79149&T=2

[TABLE]
[ROW][C]Regression: S.E.(k) = alpha + beta * Mean(k)[/C][/ROW]
[ROW][C]alpha[/C][C]2.90784325883232[/C][/ROW]
[ROW][C]beta[/C][C]0.00784800446701681[/C][/ROW]
[ROW][C]S.D.[/C][C]0.0362087975286237[/C][/ROW]
[ROW][C]T-STAT[/C][C]0.21674302939259[/C][/ROW]
[ROW][C]p-value[/C][C]0.830718879965459[/C][/ROW]
[/TABLE]
Source: https://freestatistics.org/blog/index.php?pk=79149&T=2

Globally Unique Identifier (entire table): ba.freestatistics.org/blog/index.php?pk=79149&T=2

As an alternative you can also use a QR Code:  

The GUIDs for individual cells are displayed in the table below:

Regression: S.E.(k) = alpha + beta * Mean(k)
alpha2.90784325883232
beta0.00784800446701681
S.D.0.0362087975286237
T-STAT0.21674302939259
p-value0.830718879965459


Regression: ln S.E.(k) = alpha + beta * ln Mean(k)
alpha1.65193965634226
beta-0.094067613959715
S.D.1.23867155187979
T-STAT-0.0759423382388652
p-value0.940258922003047
Lambda1.09406761395971

\begin{tabular}{lllllllll}
\hline
Regression: ln S.E.(k) = alpha + beta * ln Mean(k) \tabularnewline
alpha & 1.65193965634226 \tabularnewline
beta & -0.094067613959715 \tabularnewline
S.D. & 1.23867155187979 \tabularnewline
T-STAT & -0.0759423382388652 \tabularnewline
p-value & 0.940258922003047 \tabularnewline
Lambda & 1.09406761395971 \tabularnewline
\hline
\end{tabular}
%Source: https://freestatistics.org/blog/index.php?pk=79149&T=3

[TABLE]
[ROW][C]Regression: ln S.E.(k) = alpha + beta * ln Mean(k)[/C][/ROW]
[ROW][C]alpha[/C][C]1.65193965634226[/C][/ROW]
[ROW][C]beta[/C][C]-0.094067613959715[/C][/ROW]
[ROW][C]S.D.[/C][C]1.23867155187979[/C][/ROW]
[ROW][C]T-STAT[/C][C]-0.0759423382388652[/C][/ROW]
[ROW][C]p-value[/C][C]0.940258922003047[/C][/ROW]
[ROW][C]Lambda[/C][C]1.09406761395971[/C][/ROW]
[/TABLE]
Source: https://freestatistics.org/blog/index.php?pk=79149&T=3

Globally Unique Identifier (entire table): ba.freestatistics.org/blog/index.php?pk=79149&T=3

As an alternative you can also use a QR Code:  

The GUIDs for individual cells are displayed in the table below:

Regression: ln S.E.(k) = alpha + beta * ln Mean(k)
alpha1.65193965634226
beta-0.094067613959715
S.D.1.23867155187979
T-STAT-0.0759423382388652
p-value0.940258922003047
Lambda1.09406761395971


Parameters (Session):
Parameters (R input):
par1 = 4 ;
R code (references can be found in the software module):
par1 <- as.numeric(par1)
(n <- length(x))
(np <- floor(n / par1))
arr <- array(NA,dim=c(par1,np))
j <- 0
k <- 1
for (i in 1:(np*par1))
{
j = j + 1
arr[j,k] <- x[i]
if (j == par1) {
j = 0
k=k+1
}
}
arr
arr.mean <- array(NA,dim=np)
arr.sd <- array(NA,dim=np)
arr.range <- array(NA,dim=np)
for (j in 1:np)
{
arr.mean[j] <- mean(arr[,j],na.rm=TRUE)
arr.sd[j] <- sd(arr[,j],na.rm=TRUE)
arr.range[j] <- max(arr[,j],na.rm=TRUE) - min(arr[,j],na.rm=TRUE)
}
arr.mean
arr.sd
arr.range
(lm1 <- lm(arr.sd~arr.mean))
(lnlm1 <- lm(log(arr.sd)~log(arr.mean)))
(lm2 <- lm(arr.range~arr.mean))
bitmap(file='test1.png')
plot(arr.mean,arr.sd,main='Standard Deviation-Mean Plot',xlab='mean',ylab='standard deviation')
dev.off()
bitmap(file='test2.png')
plot(arr.mean,arr.range,main='Range-Mean Plot',xlab='mean',ylab='range')
dev.off()
load(file='createtable')
a<-table.start()
a<-table.row.start(a)
a<-table.element(a,'Standard Deviation-Mean Plot',4,TRUE)
a<-table.row.end(a)
a<-table.row.start(a)
a<-table.element(a,'Section',header=TRUE)
a<-table.element(a,'Mean',header=TRUE)
a<-table.element(a,'Standard Deviation',header=TRUE)
a<-table.element(a,'Range',header=TRUE)
a<-table.row.end(a)
for (j in 1:np) {
a<-table.row.start(a)
a<-table.element(a,j,header=TRUE)
a<-table.element(a,arr.mean[j])
a<-table.element(a,arr.sd[j] )
a<-table.element(a,arr.range[j] )
a<-table.row.end(a)
}
a<-table.end(a)
table.save(a,file='mytable.tab')
a<-table.start()
a<-table.row.start(a)
a<-table.element(a,'Regression: S.E.(k) = alpha + beta * Mean(k)',2,TRUE)
a<-table.row.end(a)
a<-table.row.start(a)
a<-table.element(a,'alpha',header=TRUE)
a<-table.element(a,lm1$coefficients[[1]])
a<-table.row.end(a)
a<-table.row.start(a)
a<-table.element(a,'beta',header=TRUE)
a<-table.element(a,lm1$coefficients[[2]])
a<-table.row.end(a)
a<-table.row.start(a)
a<-table.element(a,'S.D.',header=TRUE)
a<-table.element(a,summary(lm1)$coefficients[2,2])
a<-table.row.end(a)
a<-table.row.start(a)
a<-table.element(a,'T-STAT',header=TRUE)
a<-table.element(a,summary(lm1)$coefficients[2,3])
a<-table.row.end(a)
a<-table.row.start(a)
a<-table.element(a,'p-value',header=TRUE)
a<-table.element(a,summary(lm1)$coefficients[2,4])
a<-table.row.end(a)
a<-table.end(a)
table.save(a,file='mytable1.tab')
a<-table.start()
a<-table.row.start(a)
a<-table.element(a,'Regression: ln S.E.(k) = alpha + beta * ln Mean(k)',2,TRUE)
a<-table.row.end(a)
a<-table.row.start(a)
a<-table.element(a,'alpha',header=TRUE)
a<-table.element(a,lnlm1$coefficients[[1]])
a<-table.row.end(a)
a<-table.row.start(a)
a<-table.element(a,'beta',header=TRUE)
a<-table.element(a,lnlm1$coefficients[[2]])
a<-table.row.end(a)
a<-table.row.start(a)
a<-table.element(a,'S.D.',header=TRUE)
a<-table.element(a,summary(lnlm1)$coefficients[2,2])
a<-table.row.end(a)
a<-table.row.start(a)
a<-table.element(a,'T-STAT',header=TRUE)
a<-table.element(a,summary(lnlm1)$coefficients[2,3])
a<-table.row.end(a)
a<-table.row.start(a)
a<-table.element(a,'p-value',header=TRUE)
a<-table.element(a,summary(lnlm1)$coefficients[2,4])
a<-table.row.end(a)
a<-table.row.start(a)
a<-table.element(a,'Lambda',header=TRUE)
a<-table.element(a,1-lnlm1$coefficients[[2]])
a<-table.row.end(a)
a<-table.end(a)
table.save(a,file='mytable2.tab')