Free Statistics

of Irreproducible Research!

Author's title

Author*Unverified author*
R Software Modulerwasp_autocorrelation.wasp
Title produced by software(Partial) Autocorrelation Function
Date of computationTue, 17 Aug 2010 15:57:36 +0000
Cite this page as followsStatistical Computations at FreeStatistics.org, Office for Research Development and Education, URL https://freestatistics.org/blog/index.php?v=date/2010/Aug/17/t1282060633e4plrd4025dkjl8.htm/, Retrieved Sat, 27 Apr 2024 07:19:26 +0000
Statistical Computations at FreeStatistics.org, Office for Research Development and Education, URL https://freestatistics.org/blog/index.php?pk=79145, Retrieved Sat, 27 Apr 2024 07:19:26 +0000
QR Codes:

Original text written by user:
IsPrivate?No (this computation is public)
User-defined keywordsMagali De Reu
Estimated Impact104
Family? (F = Feedback message, R = changed R code, M = changed R Module, P = changed Parameters, D = changed Data)
-       [(Partial) Autocorrelation Function] [tijdreeks 2 stap 17] [2010-08-17 15:57:36] [07915b1f88a41fb8d82e27c5eaa7bbed] [Current]
Feedback Forum

Post a new message
Dataseries X:
120
119
118
116
114
113
114
116
117
117
118
120
123
125
120
116
111
108
113
112
126
124
124
118
119
122
114
108
104
101
107
104
123
125
134
131
127
124
123
117
112
118
123
124
144
148
152
154
146
132
136
128
120
124
126
121
140
142
142
139
131
117
122
112
98
103
108
102
126
129
126
126
112
99
106
104
90
98
99
91
118
115
119
123


Summary of computational transaction
Raw Inputview raw input (R code)
Raw Outputview raw output of R engine
Computing time2 seconds
R Server'RServer@AstonUniversity' @ vre.aston.ac.uk

\begin{tabular}{lllllllll}
\hline
Summary of computational transaction \tabularnewline
Raw Input & view raw input (R code)  \tabularnewline
Raw Output & view raw output of R engine  \tabularnewline
Computing time & 2 seconds \tabularnewline
R Server & 'RServer@AstonUniversity' @ vre.aston.ac.uk \tabularnewline
\hline
\end{tabular}
%Source: https://freestatistics.org/blog/index.php?pk=79145&T=0

[TABLE]
[ROW][C]Summary of computational transaction[/C][/ROW]
[ROW][C]Raw Input[/C][C]view raw input (R code) [/C][/ROW]
[ROW][C]Raw Output[/C][C]view raw output of R engine [/C][/ROW]
[ROW][C]Computing time[/C][C]2 seconds[/C][/ROW]
[ROW][C]R Server[/C][C]'RServer@AstonUniversity' @ vre.aston.ac.uk[/C][/ROW]
[/TABLE]
Source: https://freestatistics.org/blog/index.php?pk=79145&T=0

Globally Unique Identifier (entire table): ba.freestatistics.org/blog/index.php?pk=79145&T=0

As an alternative you can also use a QR Code:  

The GUIDs for individual cells are displayed in the table below:

Summary of computational transaction
Raw Inputview raw input (R code)
Raw Outputview raw output of R engine
Computing time2 seconds
R Server'RServer@AstonUniversity' @ vre.aston.ac.uk


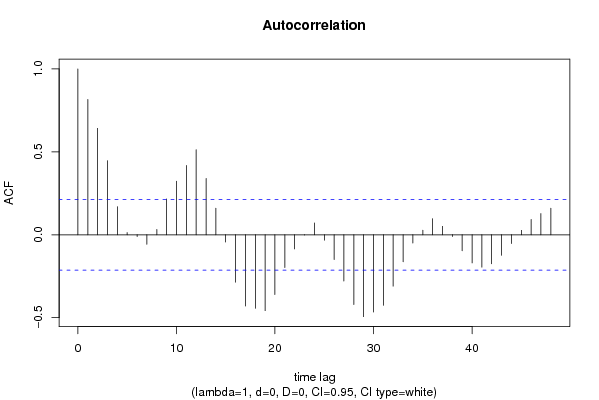
Autocorrelation Function
Time lag kACF(k)T-STATP-value
10.8160497.47920
20.6419175.88330
30.4470414.09724.8e-05
40.1693681.55230.062177
50.0130480.11960.452549
6-0.01059-0.09710.461455
7-0.057362-0.52570.300232
80.0315660.28930.38653
90.2159031.97880.025558
100.3227952.95850.002008
110.4181653.83250.000122
120.5132984.70455e-06
130.3397363.11370.001263
140.1597571.46420.073436
15-0.043588-0.39950.345273
16-0.285949-2.62080.005206
17-0.429454-3.9368.5e-05
18-0.443784-4.06735.3e-05
19-0.457689-4.19483.4e-05
20-0.360161-3.30090.000708
21-0.197477-1.80990.036943
22-0.085507-0.78370.217715
23-0.002133-0.01950.492225
240.0715590.65590.256856
25-0.032546-0.29830.38311
26-0.148971-1.36530.087896
27-0.27913-2.55830.006157
28-0.420619-3.8550.000113
29-0.493965-4.52731e-05
30-0.466055-4.27152.5e-05
31-0.424946-3.89479.8e-05
32-0.310157-2.84260.002808
33-0.163223-1.4960.069205
34-0.0505-0.46280.322337
350.0278560.25530.399557
360.0968080.88730.188736
370.050840.4660.321226
38-0.01099-0.10070.460004
39-0.097101-0.88990.188019
40-0.169871-1.55690.061628
41-0.195601-1.79270.03831
42-0.174553-1.59980.056698
43-0.124358-1.13980.128812
44-0.052743-0.48340.315035
450.0266590.24430.403784
460.0924380.84720.199644
470.127671.17010.122632
480.1601581.46790.072937

\begin{tabular}{lllllllll}
\hline
Autocorrelation Function \tabularnewline
Time lag k & ACF(k) & T-STAT & P-value \tabularnewline
1 & 0.816049 & 7.4792 & 0 \tabularnewline
2 & 0.641917 & 5.8833 & 0 \tabularnewline
3 & 0.447041 & 4.0972 & 4.8e-05 \tabularnewline
4 & 0.169368 & 1.5523 & 0.062177 \tabularnewline
5 & 0.013048 & 0.1196 & 0.452549 \tabularnewline
6 & -0.01059 & -0.0971 & 0.461455 \tabularnewline
7 & -0.057362 & -0.5257 & 0.300232 \tabularnewline
8 & 0.031566 & 0.2893 & 0.38653 \tabularnewline
9 & 0.215903 & 1.9788 & 0.025558 \tabularnewline
10 & 0.322795 & 2.9585 & 0.002008 \tabularnewline
11 & 0.418165 & 3.8325 & 0.000122 \tabularnewline
12 & 0.513298 & 4.7045 & 5e-06 \tabularnewline
13 & 0.339736 & 3.1137 & 0.001263 \tabularnewline
14 & 0.159757 & 1.4642 & 0.073436 \tabularnewline
15 & -0.043588 & -0.3995 & 0.345273 \tabularnewline
16 & -0.285949 & -2.6208 & 0.005206 \tabularnewline
17 & -0.429454 & -3.936 & 8.5e-05 \tabularnewline
18 & -0.443784 & -4.0673 & 5.3e-05 \tabularnewline
19 & -0.457689 & -4.1948 & 3.4e-05 \tabularnewline
20 & -0.360161 & -3.3009 & 0.000708 \tabularnewline
21 & -0.197477 & -1.8099 & 0.036943 \tabularnewline
22 & -0.085507 & -0.7837 & 0.217715 \tabularnewline
23 & -0.002133 & -0.0195 & 0.492225 \tabularnewline
24 & 0.071559 & 0.6559 & 0.256856 \tabularnewline
25 & -0.032546 & -0.2983 & 0.38311 \tabularnewline
26 & -0.148971 & -1.3653 & 0.087896 \tabularnewline
27 & -0.27913 & -2.5583 & 0.006157 \tabularnewline
28 & -0.420619 & -3.855 & 0.000113 \tabularnewline
29 & -0.493965 & -4.5273 & 1e-05 \tabularnewline
30 & -0.466055 & -4.2715 & 2.5e-05 \tabularnewline
31 & -0.424946 & -3.8947 & 9.8e-05 \tabularnewline
32 & -0.310157 & -2.8426 & 0.002808 \tabularnewline
33 & -0.163223 & -1.496 & 0.069205 \tabularnewline
34 & -0.0505 & -0.4628 & 0.322337 \tabularnewline
35 & 0.027856 & 0.2553 & 0.399557 \tabularnewline
36 & 0.096808 & 0.8873 & 0.188736 \tabularnewline
37 & 0.05084 & 0.466 & 0.321226 \tabularnewline
38 & -0.01099 & -0.1007 & 0.460004 \tabularnewline
39 & -0.097101 & -0.8899 & 0.188019 \tabularnewline
40 & -0.169871 & -1.5569 & 0.061628 \tabularnewline
41 & -0.195601 & -1.7927 & 0.03831 \tabularnewline
42 & -0.174553 & -1.5998 & 0.056698 \tabularnewline
43 & -0.124358 & -1.1398 & 0.128812 \tabularnewline
44 & -0.052743 & -0.4834 & 0.315035 \tabularnewline
45 & 0.026659 & 0.2443 & 0.403784 \tabularnewline
46 & 0.092438 & 0.8472 & 0.199644 \tabularnewline
47 & 0.12767 & 1.1701 & 0.122632 \tabularnewline
48 & 0.160158 & 1.4679 & 0.072937 \tabularnewline
\hline
\end{tabular}
%Source: https://freestatistics.org/blog/index.php?pk=79145&T=1

[TABLE]
[ROW][C]Autocorrelation Function[/C][/ROW]
[ROW][C]Time lag k[/C][C]ACF(k)[/C][C]T-STAT[/C][C]P-value[/C][/ROW]
[ROW][C]1[/C][C]0.816049[/C][C]7.4792[/C][C]0[/C][/ROW]
[ROW][C]2[/C][C]0.641917[/C][C]5.8833[/C][C]0[/C][/ROW]
[ROW][C]3[/C][C]0.447041[/C][C]4.0972[/C][C]4.8e-05[/C][/ROW]
[ROW][C]4[/C][C]0.169368[/C][C]1.5523[/C][C]0.062177[/C][/ROW]
[ROW][C]5[/C][C]0.013048[/C][C]0.1196[/C][C]0.452549[/C][/ROW]
[ROW][C]6[/C][C]-0.01059[/C][C]-0.0971[/C][C]0.461455[/C][/ROW]
[ROW][C]7[/C][C]-0.057362[/C][C]-0.5257[/C][C]0.300232[/C][/ROW]
[ROW][C]8[/C][C]0.031566[/C][C]0.2893[/C][C]0.38653[/C][/ROW]
[ROW][C]9[/C][C]0.215903[/C][C]1.9788[/C][C]0.025558[/C][/ROW]
[ROW][C]10[/C][C]0.322795[/C][C]2.9585[/C][C]0.002008[/C][/ROW]
[ROW][C]11[/C][C]0.418165[/C][C]3.8325[/C][C]0.000122[/C][/ROW]
[ROW][C]12[/C][C]0.513298[/C][C]4.7045[/C][C]5e-06[/C][/ROW]
[ROW][C]13[/C][C]0.339736[/C][C]3.1137[/C][C]0.001263[/C][/ROW]
[ROW][C]14[/C][C]0.159757[/C][C]1.4642[/C][C]0.073436[/C][/ROW]
[ROW][C]15[/C][C]-0.043588[/C][C]-0.3995[/C][C]0.345273[/C][/ROW]
[ROW][C]16[/C][C]-0.285949[/C][C]-2.6208[/C][C]0.005206[/C][/ROW]
[ROW][C]17[/C][C]-0.429454[/C][C]-3.936[/C][C]8.5e-05[/C][/ROW]
[ROW][C]18[/C][C]-0.443784[/C][C]-4.0673[/C][C]5.3e-05[/C][/ROW]
[ROW][C]19[/C][C]-0.457689[/C][C]-4.1948[/C][C]3.4e-05[/C][/ROW]
[ROW][C]20[/C][C]-0.360161[/C][C]-3.3009[/C][C]0.000708[/C][/ROW]
[ROW][C]21[/C][C]-0.197477[/C][C]-1.8099[/C][C]0.036943[/C][/ROW]
[ROW][C]22[/C][C]-0.085507[/C][C]-0.7837[/C][C]0.217715[/C][/ROW]
[ROW][C]23[/C][C]-0.002133[/C][C]-0.0195[/C][C]0.492225[/C][/ROW]
[ROW][C]24[/C][C]0.071559[/C][C]0.6559[/C][C]0.256856[/C][/ROW]
[ROW][C]25[/C][C]-0.032546[/C][C]-0.2983[/C][C]0.38311[/C][/ROW]
[ROW][C]26[/C][C]-0.148971[/C][C]-1.3653[/C][C]0.087896[/C][/ROW]
[ROW][C]27[/C][C]-0.27913[/C][C]-2.5583[/C][C]0.006157[/C][/ROW]
[ROW][C]28[/C][C]-0.420619[/C][C]-3.855[/C][C]0.000113[/C][/ROW]
[ROW][C]29[/C][C]-0.493965[/C][C]-4.5273[/C][C]1e-05[/C][/ROW]
[ROW][C]30[/C][C]-0.466055[/C][C]-4.2715[/C][C]2.5e-05[/C][/ROW]
[ROW][C]31[/C][C]-0.424946[/C][C]-3.8947[/C][C]9.8e-05[/C][/ROW]
[ROW][C]32[/C][C]-0.310157[/C][C]-2.8426[/C][C]0.002808[/C][/ROW]
[ROW][C]33[/C][C]-0.163223[/C][C]-1.496[/C][C]0.069205[/C][/ROW]
[ROW][C]34[/C][C]-0.0505[/C][C]-0.4628[/C][C]0.322337[/C][/ROW]
[ROW][C]35[/C][C]0.027856[/C][C]0.2553[/C][C]0.399557[/C][/ROW]
[ROW][C]36[/C][C]0.096808[/C][C]0.8873[/C][C]0.188736[/C][/ROW]
[ROW][C]37[/C][C]0.05084[/C][C]0.466[/C][C]0.321226[/C][/ROW]
[ROW][C]38[/C][C]-0.01099[/C][C]-0.1007[/C][C]0.460004[/C][/ROW]
[ROW][C]39[/C][C]-0.097101[/C][C]-0.8899[/C][C]0.188019[/C][/ROW]
[ROW][C]40[/C][C]-0.169871[/C][C]-1.5569[/C][C]0.061628[/C][/ROW]
[ROW][C]41[/C][C]-0.195601[/C][C]-1.7927[/C][C]0.03831[/C][/ROW]
[ROW][C]42[/C][C]-0.174553[/C][C]-1.5998[/C][C]0.056698[/C][/ROW]
[ROW][C]43[/C][C]-0.124358[/C][C]-1.1398[/C][C]0.128812[/C][/ROW]
[ROW][C]44[/C][C]-0.052743[/C][C]-0.4834[/C][C]0.315035[/C][/ROW]
[ROW][C]45[/C][C]0.026659[/C][C]0.2443[/C][C]0.403784[/C][/ROW]
[ROW][C]46[/C][C]0.092438[/C][C]0.8472[/C][C]0.199644[/C][/ROW]
[ROW][C]47[/C][C]0.12767[/C][C]1.1701[/C][C]0.122632[/C][/ROW]
[ROW][C]48[/C][C]0.160158[/C][C]1.4679[/C][C]0.072937[/C][/ROW]
[/TABLE]
Source: https://freestatistics.org/blog/index.php?pk=79145&T=1

Globally Unique Identifier (entire table): ba.freestatistics.org/blog/index.php?pk=79145&T=1

As an alternative you can also use a QR Code:  

The GUIDs for individual cells are displayed in the table below:

Autocorrelation Function
Time lag kACF(k)T-STATP-value
10.8160497.47920
20.6419175.88330
30.4470414.09724.8e-05
40.1693681.55230.062177
50.0130480.11960.452549
6-0.01059-0.09710.461455
7-0.057362-0.52570.300232
80.0315660.28930.38653
90.2159031.97880.025558
100.3227952.95850.002008
110.4181653.83250.000122
120.5132984.70455e-06
130.3397363.11370.001263
140.1597571.46420.073436
15-0.043588-0.39950.345273
16-0.285949-2.62080.005206
17-0.429454-3.9368.5e-05
18-0.443784-4.06735.3e-05
19-0.457689-4.19483.4e-05
20-0.360161-3.30090.000708
21-0.197477-1.80990.036943
22-0.085507-0.78370.217715
23-0.002133-0.01950.492225
240.0715590.65590.256856
25-0.032546-0.29830.38311
26-0.148971-1.36530.087896
27-0.27913-2.55830.006157
28-0.420619-3.8550.000113
29-0.493965-4.52731e-05
30-0.466055-4.27152.5e-05
31-0.424946-3.89479.8e-05
32-0.310157-2.84260.002808
33-0.163223-1.4960.069205
34-0.0505-0.46280.322337
350.0278560.25530.399557
360.0968080.88730.188736
370.050840.4660.321226
38-0.01099-0.10070.460004
39-0.097101-0.88990.188019
40-0.169871-1.55690.061628
41-0.195601-1.79270.03831
42-0.174553-1.59980.056698
43-0.124358-1.13980.128812
44-0.052743-0.48340.315035
450.0266590.24430.403784
460.0924380.84720.199644
470.127671.17010.122632
480.1601581.46790.072937


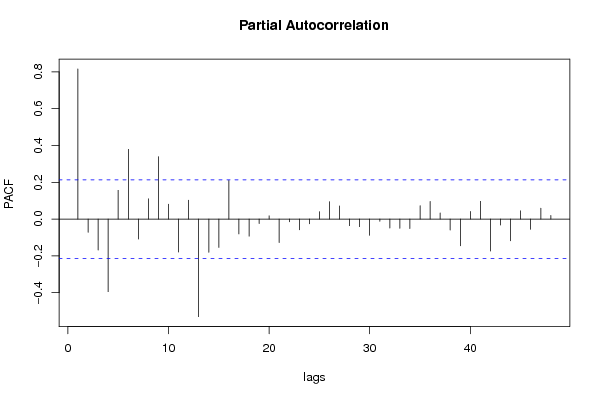
Partial Autocorrelation Function
Time lag kPACF(k)T-STATP-value
10.8160497.47920
2-0.071901-0.6590.255854
3-0.167855-1.53840.063853
4-0.394436-3.61510.000255
50.156411.43350.07771
60.3790183.47380.000407
7-0.108229-0.99190.162039
80.1101371.00940.157836
90.3386273.10360.001303
100.0806680.73930.230882
11-0.178847-1.63920.05246
120.1022660.93730.175651
13-0.530205-4.85943e-06
14-0.180731-1.65640.050683
15-0.153986-1.41130.080924
160.2100911.92550.028774
17-0.080617-0.73890.231024
18-0.092828-0.85080.198655
19-0.023718-0.21740.41422
200.017740.16260.435617
21-0.127704-1.17040.12257
22-0.014793-0.13560.446239
23-0.058053-0.53210.298042
24-0.0252-0.2310.408952
250.0404420.37070.355914
260.0942590.86390.195053
270.0710670.65130.258301
28-0.035506-0.32540.372839
29-0.041025-0.3760.353931
30-0.087487-0.80180.212456
31-0.011618-0.10650.457728
32-0.048546-0.44490.328758
33-0.049526-0.45390.325531
34-0.051565-0.47260.31886
350.0731890.67080.252098
360.0958220.87820.191164
370.0332870.30510.380531
38-0.059709-0.54720.292831
39-0.145204-1.33080.093425
400.041570.3810.352083
410.0964680.88410.189572
42-0.173067-1.58620.058227
43-0.032339-0.29640.383832
44-0.118157-1.08290.14097
450.0448860.41140.340917
46-0.05496-0.50370.307889
470.05860.53710.296317
480.019910.18250.427822

\begin{tabular}{lllllllll}
\hline
Partial Autocorrelation Function \tabularnewline
Time lag k & PACF(k) & T-STAT & P-value \tabularnewline
1 & 0.816049 & 7.4792 & 0 \tabularnewline
2 & -0.071901 & -0.659 & 0.255854 \tabularnewline
3 & -0.167855 & -1.5384 & 0.063853 \tabularnewline
4 & -0.394436 & -3.6151 & 0.000255 \tabularnewline
5 & 0.15641 & 1.4335 & 0.07771 \tabularnewline
6 & 0.379018 & 3.4738 & 0.000407 \tabularnewline
7 & -0.108229 & -0.9919 & 0.162039 \tabularnewline
8 & 0.110137 & 1.0094 & 0.157836 \tabularnewline
9 & 0.338627 & 3.1036 & 0.001303 \tabularnewline
10 & 0.080668 & 0.7393 & 0.230882 \tabularnewline
11 & -0.178847 & -1.6392 & 0.05246 \tabularnewline
12 & 0.102266 & 0.9373 & 0.175651 \tabularnewline
13 & -0.530205 & -4.8594 & 3e-06 \tabularnewline
14 & -0.180731 & -1.6564 & 0.050683 \tabularnewline
15 & -0.153986 & -1.4113 & 0.080924 \tabularnewline
16 & 0.210091 & 1.9255 & 0.028774 \tabularnewline
17 & -0.080617 & -0.7389 & 0.231024 \tabularnewline
18 & -0.092828 & -0.8508 & 0.198655 \tabularnewline
19 & -0.023718 & -0.2174 & 0.41422 \tabularnewline
20 & 0.01774 & 0.1626 & 0.435617 \tabularnewline
21 & -0.127704 & -1.1704 & 0.12257 \tabularnewline
22 & -0.014793 & -0.1356 & 0.446239 \tabularnewline
23 & -0.058053 & -0.5321 & 0.298042 \tabularnewline
24 & -0.0252 & -0.231 & 0.408952 \tabularnewline
25 & 0.040442 & 0.3707 & 0.355914 \tabularnewline
26 & 0.094259 & 0.8639 & 0.195053 \tabularnewline
27 & 0.071067 & 0.6513 & 0.258301 \tabularnewline
28 & -0.035506 & -0.3254 & 0.372839 \tabularnewline
29 & -0.041025 & -0.376 & 0.353931 \tabularnewline
30 & -0.087487 & -0.8018 & 0.212456 \tabularnewline
31 & -0.011618 & -0.1065 & 0.457728 \tabularnewline
32 & -0.048546 & -0.4449 & 0.328758 \tabularnewline
33 & -0.049526 & -0.4539 & 0.325531 \tabularnewline
34 & -0.051565 & -0.4726 & 0.31886 \tabularnewline
35 & 0.073189 & 0.6708 & 0.252098 \tabularnewline
36 & 0.095822 & 0.8782 & 0.191164 \tabularnewline
37 & 0.033287 & 0.3051 & 0.380531 \tabularnewline
38 & -0.059709 & -0.5472 & 0.292831 \tabularnewline
39 & -0.145204 & -1.3308 & 0.093425 \tabularnewline
40 & 0.04157 & 0.381 & 0.352083 \tabularnewline
41 & 0.096468 & 0.8841 & 0.189572 \tabularnewline
42 & -0.173067 & -1.5862 & 0.058227 \tabularnewline
43 & -0.032339 & -0.2964 & 0.383832 \tabularnewline
44 & -0.118157 & -1.0829 & 0.14097 \tabularnewline
45 & 0.044886 & 0.4114 & 0.340917 \tabularnewline
46 & -0.05496 & -0.5037 & 0.307889 \tabularnewline
47 & 0.0586 & 0.5371 & 0.296317 \tabularnewline
48 & 0.01991 & 0.1825 & 0.427822 \tabularnewline
\hline
\end{tabular}
%Source: https://freestatistics.org/blog/index.php?pk=79145&T=2

[TABLE]
[ROW][C]Partial Autocorrelation Function[/C][/ROW]
[ROW][C]Time lag k[/C][C]PACF(k)[/C][C]T-STAT[/C][C]P-value[/C][/ROW]
[ROW][C]1[/C][C]0.816049[/C][C]7.4792[/C][C]0[/C][/ROW]
[ROW][C]2[/C][C]-0.071901[/C][C]-0.659[/C][C]0.255854[/C][/ROW]
[ROW][C]3[/C][C]-0.167855[/C][C]-1.5384[/C][C]0.063853[/C][/ROW]
[ROW][C]4[/C][C]-0.394436[/C][C]-3.6151[/C][C]0.000255[/C][/ROW]
[ROW][C]5[/C][C]0.15641[/C][C]1.4335[/C][C]0.07771[/C][/ROW]
[ROW][C]6[/C][C]0.379018[/C][C]3.4738[/C][C]0.000407[/C][/ROW]
[ROW][C]7[/C][C]-0.108229[/C][C]-0.9919[/C][C]0.162039[/C][/ROW]
[ROW][C]8[/C][C]0.110137[/C][C]1.0094[/C][C]0.157836[/C][/ROW]
[ROW][C]9[/C][C]0.338627[/C][C]3.1036[/C][C]0.001303[/C][/ROW]
[ROW][C]10[/C][C]0.080668[/C][C]0.7393[/C][C]0.230882[/C][/ROW]
[ROW][C]11[/C][C]-0.178847[/C][C]-1.6392[/C][C]0.05246[/C][/ROW]
[ROW][C]12[/C][C]0.102266[/C][C]0.9373[/C][C]0.175651[/C][/ROW]
[ROW][C]13[/C][C]-0.530205[/C][C]-4.8594[/C][C]3e-06[/C][/ROW]
[ROW][C]14[/C][C]-0.180731[/C][C]-1.6564[/C][C]0.050683[/C][/ROW]
[ROW][C]15[/C][C]-0.153986[/C][C]-1.4113[/C][C]0.080924[/C][/ROW]
[ROW][C]16[/C][C]0.210091[/C][C]1.9255[/C][C]0.028774[/C][/ROW]
[ROW][C]17[/C][C]-0.080617[/C][C]-0.7389[/C][C]0.231024[/C][/ROW]
[ROW][C]18[/C][C]-0.092828[/C][C]-0.8508[/C][C]0.198655[/C][/ROW]
[ROW][C]19[/C][C]-0.023718[/C][C]-0.2174[/C][C]0.41422[/C][/ROW]
[ROW][C]20[/C][C]0.01774[/C][C]0.1626[/C][C]0.435617[/C][/ROW]
[ROW][C]21[/C][C]-0.127704[/C][C]-1.1704[/C][C]0.12257[/C][/ROW]
[ROW][C]22[/C][C]-0.014793[/C][C]-0.1356[/C][C]0.446239[/C][/ROW]
[ROW][C]23[/C][C]-0.058053[/C][C]-0.5321[/C][C]0.298042[/C][/ROW]
[ROW][C]24[/C][C]-0.0252[/C][C]-0.231[/C][C]0.408952[/C][/ROW]
[ROW][C]25[/C][C]0.040442[/C][C]0.3707[/C][C]0.355914[/C][/ROW]
[ROW][C]26[/C][C]0.094259[/C][C]0.8639[/C][C]0.195053[/C][/ROW]
[ROW][C]27[/C][C]0.071067[/C][C]0.6513[/C][C]0.258301[/C][/ROW]
[ROW][C]28[/C][C]-0.035506[/C][C]-0.3254[/C][C]0.372839[/C][/ROW]
[ROW][C]29[/C][C]-0.041025[/C][C]-0.376[/C][C]0.353931[/C][/ROW]
[ROW][C]30[/C][C]-0.087487[/C][C]-0.8018[/C][C]0.212456[/C][/ROW]
[ROW][C]31[/C][C]-0.011618[/C][C]-0.1065[/C][C]0.457728[/C][/ROW]
[ROW][C]32[/C][C]-0.048546[/C][C]-0.4449[/C][C]0.328758[/C][/ROW]
[ROW][C]33[/C][C]-0.049526[/C][C]-0.4539[/C][C]0.325531[/C][/ROW]
[ROW][C]34[/C][C]-0.051565[/C][C]-0.4726[/C][C]0.31886[/C][/ROW]
[ROW][C]35[/C][C]0.073189[/C][C]0.6708[/C][C]0.252098[/C][/ROW]
[ROW][C]36[/C][C]0.095822[/C][C]0.8782[/C][C]0.191164[/C][/ROW]
[ROW][C]37[/C][C]0.033287[/C][C]0.3051[/C][C]0.380531[/C][/ROW]
[ROW][C]38[/C][C]-0.059709[/C][C]-0.5472[/C][C]0.292831[/C][/ROW]
[ROW][C]39[/C][C]-0.145204[/C][C]-1.3308[/C][C]0.093425[/C][/ROW]
[ROW][C]40[/C][C]0.04157[/C][C]0.381[/C][C]0.352083[/C][/ROW]
[ROW][C]41[/C][C]0.096468[/C][C]0.8841[/C][C]0.189572[/C][/ROW]
[ROW][C]42[/C][C]-0.173067[/C][C]-1.5862[/C][C]0.058227[/C][/ROW]
[ROW][C]43[/C][C]-0.032339[/C][C]-0.2964[/C][C]0.383832[/C][/ROW]
[ROW][C]44[/C][C]-0.118157[/C][C]-1.0829[/C][C]0.14097[/C][/ROW]
[ROW][C]45[/C][C]0.044886[/C][C]0.4114[/C][C]0.340917[/C][/ROW]
[ROW][C]46[/C][C]-0.05496[/C][C]-0.5037[/C][C]0.307889[/C][/ROW]
[ROW][C]47[/C][C]0.0586[/C][C]0.5371[/C][C]0.296317[/C][/ROW]
[ROW][C]48[/C][C]0.01991[/C][C]0.1825[/C][C]0.427822[/C][/ROW]
[/TABLE]
Source: https://freestatistics.org/blog/index.php?pk=79145&T=2

Globally Unique Identifier (entire table): ba.freestatistics.org/blog/index.php?pk=79145&T=2

As an alternative you can also use a QR Code:  

The GUIDs for individual cells are displayed in the table below:

Partial Autocorrelation Function
Time lag kPACF(k)T-STATP-value
10.8160497.47920
2-0.071901-0.6590.255854
3-0.167855-1.53840.063853
4-0.394436-3.61510.000255
50.156411.43350.07771
60.3790183.47380.000407
7-0.108229-0.99190.162039
80.1101371.00940.157836
90.3386273.10360.001303
100.0806680.73930.230882
11-0.178847-1.63920.05246
120.1022660.93730.175651
13-0.530205-4.85943e-06
14-0.180731-1.65640.050683
15-0.153986-1.41130.080924
160.2100911.92550.028774
17-0.080617-0.73890.231024
18-0.092828-0.85080.198655
19-0.023718-0.21740.41422
200.017740.16260.435617
21-0.127704-1.17040.12257
22-0.014793-0.13560.446239
23-0.058053-0.53210.298042
24-0.0252-0.2310.408952
250.0404420.37070.355914
260.0942590.86390.195053
270.0710670.65130.258301
28-0.035506-0.32540.372839
29-0.041025-0.3760.353931
30-0.087487-0.80180.212456
31-0.011618-0.10650.457728
32-0.048546-0.44490.328758
33-0.049526-0.45390.325531
34-0.051565-0.47260.31886
350.0731890.67080.252098
360.0958220.87820.191164
370.0332870.30510.380531
38-0.059709-0.54720.292831
39-0.145204-1.33080.093425
400.041570.3810.352083
410.0964680.88410.189572
42-0.173067-1.58620.058227
43-0.032339-0.29640.383832
44-0.118157-1.08290.14097
450.0448860.41140.340917
46-0.05496-0.50370.307889
470.05860.53710.296317
480.019910.18250.427822


Parameters (Session):
par1 = 48 ; par2 = 1 ; par3 = 0 ; par4 = 0 ; par5 = 12 ; par6 = White Noise ; par7 = 0.95 ;
Parameters (R input):
par1 = 48 ; par2 = 1 ; par3 = 0 ; par4 = 0 ; par5 = 12 ; par6 = White Noise ; par7 = 0.95 ;
R code (references can be found in the software module):
if (par1 == 'Default') {
par1 = 10*log10(length(x))
} else {
par1 <- as.numeric(par1)
}
par2 <- as.numeric(par2)
par3 <- as.numeric(par3)
par4 <- as.numeric(par4)
par5 <- as.numeric(par5)
if (par6 == 'White Noise') par6 <- 'white' else par6 <- 'ma'
par7 <- as.numeric(par7)
if (par2 == 0) {
x <- log(x)
} else {
x <- (x ^ par2 - 1) / par2
}
if (par3 > 0) x <- diff(x,lag=1,difference=par3)
if (par4 > 0) x <- diff(x,lag=par5,difference=par4)
bitmap(file='pic1.png')
racf <- acf(x, par1, main='Autocorrelation', xlab='time lag', ylab='ACF', ci.type=par6, ci=par7, sub=paste('(lambda=',par2,', d=',par3,', D=',par4,', CI=', par7, ', CI type=',par6,')',sep=''))
dev.off()
bitmap(file='pic2.png')
rpacf <- pacf(x,par1,main='Partial Autocorrelation',xlab='lags',ylab='PACF')
dev.off()
(myacf <- c(racf$acf))
(mypacf <- c(rpacf$acf))
lengthx <- length(x)
sqrtn <- sqrt(lengthx)
load(file='createtable')
a<-table.start()
a<-table.row.start(a)
a<-table.element(a,'Autocorrelation Function',4,TRUE)
a<-table.row.end(a)
a<-table.row.start(a)
a<-table.element(a,'Time lag k',header=TRUE)
a<-table.element(a,hyperlink('basics.htm','ACF(k)','click here for more information about the Autocorrelation Function'),header=TRUE)
a<-table.element(a,'T-STAT',header=TRUE)
a<-table.element(a,'P-value',header=TRUE)
a<-table.row.end(a)
for (i in 2:(par1+1)) {
a<-table.row.start(a)
a<-table.element(a,i-1,header=TRUE)
a<-table.element(a,round(myacf[i],6))
mytstat <- myacf[i]*sqrtn
a<-table.element(a,round(mytstat,4))
a<-table.element(a,round(1-pt(abs(mytstat),lengthx),6))
a<-table.row.end(a)
}
a<-table.end(a)
table.save(a,file='mytable.tab')
a<-table.start()
a<-table.row.start(a)
a<-table.element(a,'Partial Autocorrelation Function',4,TRUE)
a<-table.row.end(a)
a<-table.row.start(a)
a<-table.element(a,'Time lag k',header=TRUE)
a<-table.element(a,hyperlink('basics.htm','PACF(k)','click here for more information about the Partial Autocorrelation Function'),header=TRUE)
a<-table.element(a,'T-STAT',header=TRUE)
a<-table.element(a,'P-value',header=TRUE)
a<-table.row.end(a)
for (i in 1:par1) {
a<-table.row.start(a)
a<-table.element(a,i,header=TRUE)
a<-table.element(a,round(mypacf[i],6))
mytstat <- mypacf[i]*sqrtn
a<-table.element(a,round(mytstat,4))
a<-table.element(a,round(1-pt(abs(mytstat),lengthx),6))
a<-table.row.end(a)
}
a<-table.end(a)
table.save(a,file='mytable1.tab')